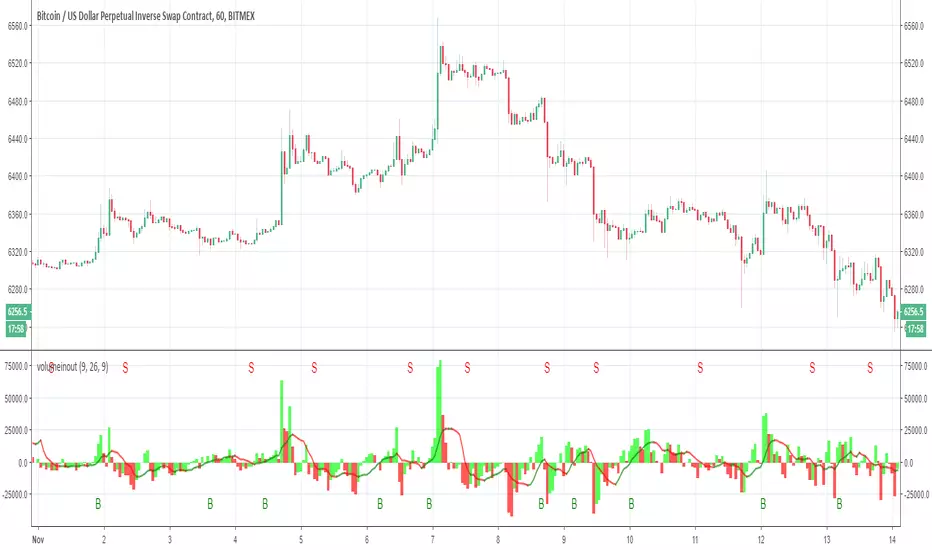
Volume in out as MACD with alerts Lets make the Volume in out as MACD
with alerts (B =buy) S=sell
have fun
Cari dalam skrip untuk "macd"

Ergotic MACD Strategy [forked from HPotter]Ergotic MACD Strategy forked from HPotter
In addition to this fine script you will find some additional features:
- Backtester
- Alerts
- Filters: RSI, MFI, Price trend
- Trailing Stop Loss
- Other minor adjustments


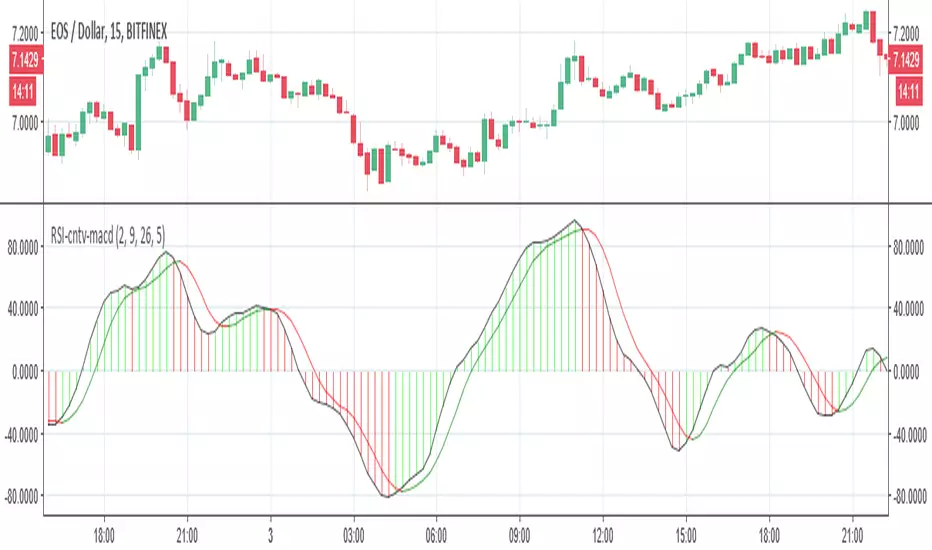
RSI-cumulative net volume as MACDSo here in this model I take the RSI-cumulative net volume and convert it to MACD
I think it look nicer then original but it just idea:)
for different time frame just change setting:)
MACD + RSI + EMA + SMA + Ichimoku + overbought + buy, sell +Doji// MACD + EMA 200 *** buy and sell strategy (RSI, EMA, SMA) *** Doji Harami *** overbought and oversold *** trend direction *** divergence *** Ichimoku
Use this script in time 1h

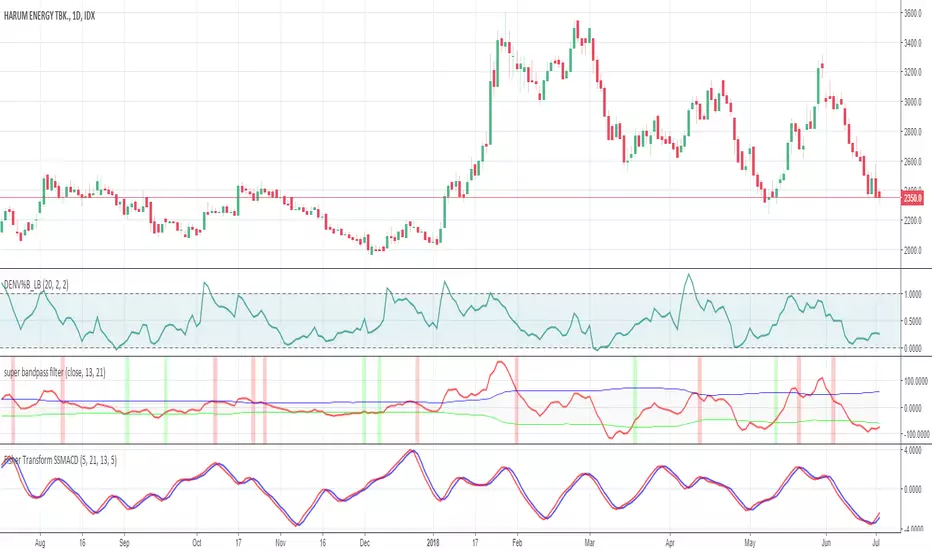
Fisher Transform SuperSmoothed MACD // This is a modification of Supersmoothed MACD (created by KIVANC using EHLERS' SUPER SMOOTHER FILTER) and sharpenned with Ehler fisher transform
//all lengths and parameters are completely configurable, tune the length according to your instrument
//give me what you think
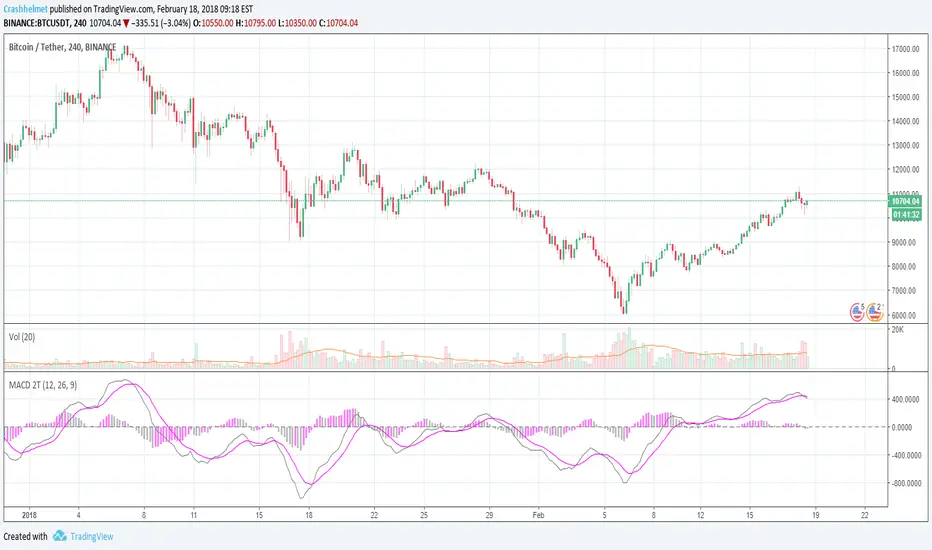
MACD [Moving Average Convergence/Divergence]MACD rendered as candles to make it easier on the eyes. Candles are hollow when the MACD line moves opposite direction of the trend, which can signal a weakening trend.


BD 4EMA RSI/MACD SIGNAL V1this chart allows 4 moving averages and gives a signal for macd cross over up and down as well as RSI oversold - purple - and overbought -yellow - all in 1 indicator.
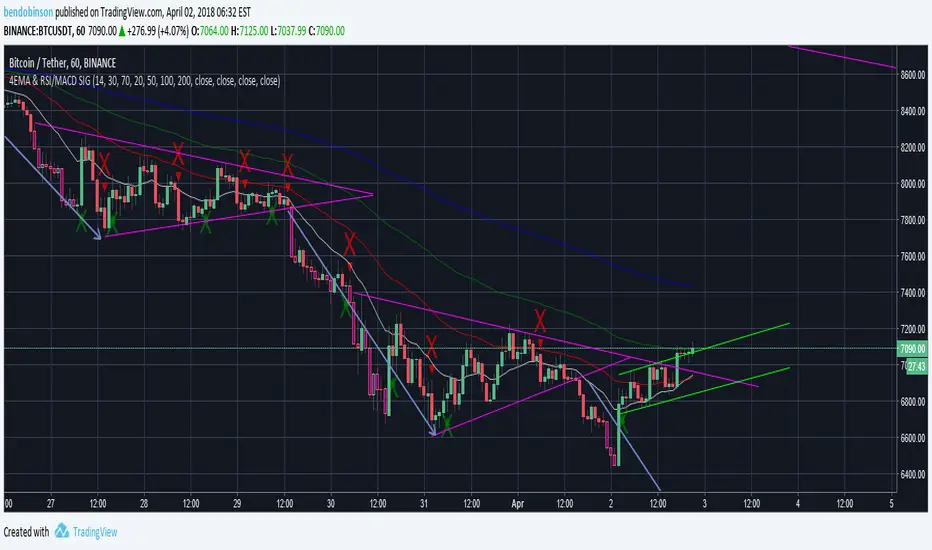


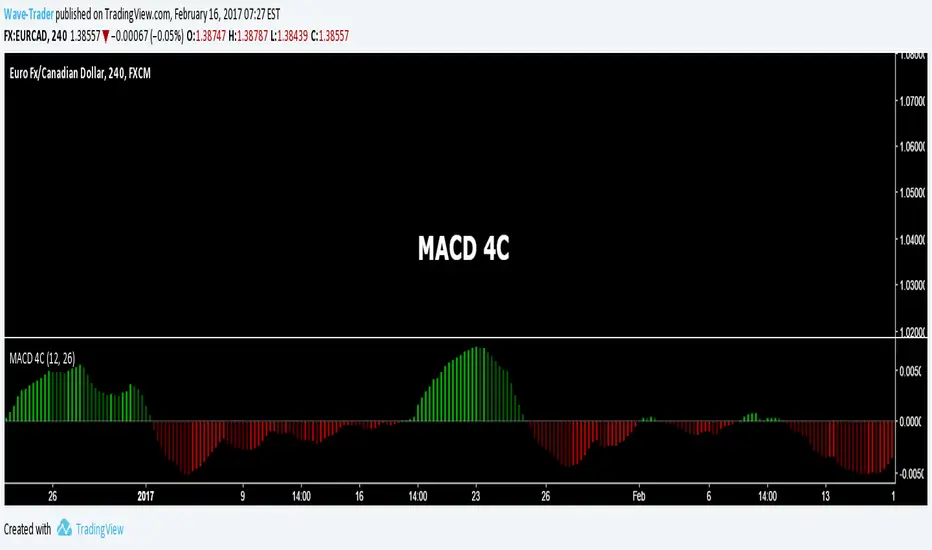
MACD represent up/down by green/red bars. MACD modified macd line to histogram and show up/down momentum by use green and red color.


MACD + RSI TSA simple strategy that use EMAs convergence/divergence and RSI peeks to take position. Fractals are really useful to positioning your stop loss.
It works well on commodities and forex markets.

MACD with LSME and triple EMAMACD - with each MA defined as follows:
ema(ema(ema(LSMA(src,len1),len2),len2)len2)

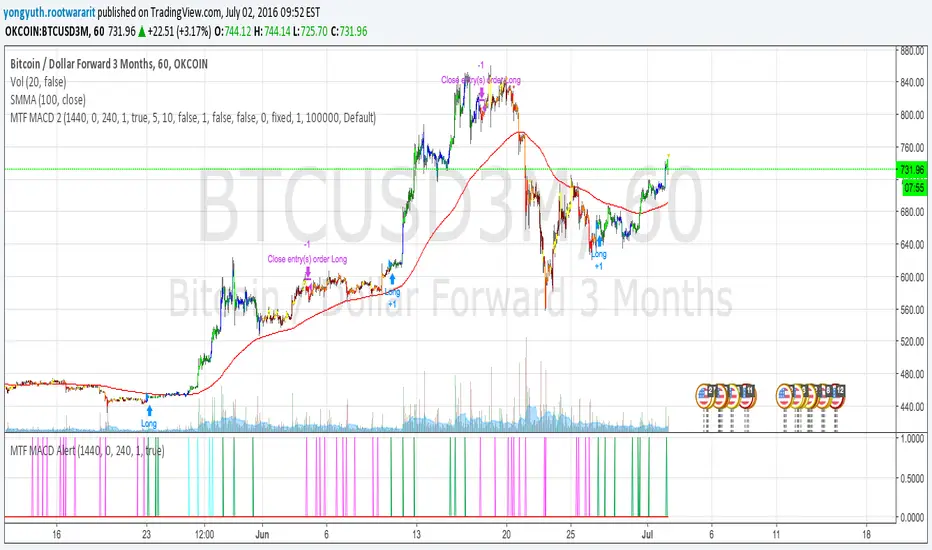
MTF MACD 2 By YuthavithiIf you want a good strategy without repaint. This one might be for you. Excellent profitable for BTCUSD3M for OKCoin.
It uses multiple time frame MACD for trading decision. To avoid repaint, set the delay period = 1 for both long term and midterm.
The idea is that, if long term, mid term and current time frame all agree on traidng direction, the trade will take place.
I also uses it in my automated trading bot with good result.
www.tradingview.com
Exponential Moving Average Convergence/DivergenceMACD modified with exponential moving averages. Simple.

Reversal + Confirm ZonesThis script is written in Pine Script (version 5) for TradingView and creates an indicator called **"Reversal + Confirm Zones"**. It overlays visual zones on a price chart to identify potential reversal points and confirmation signals for trading. The indicator combines **Bollinger Bands** and **RSI** to detect overbought/oversold conditions (reversal zones) and uses **EMA crosses** and **MACD zero-line crosses** to confirm bullish or bearish trends. Below is a detailed explanation:
---
### **1. Purpose**
- The script highlights:
- **Reversal Zones**: Areas where the price might reverse due to being overbought (green) or oversold (red).
- **Confirmation Zones**: Areas where a trend reversal is confirmed using EMA and MACD signals (green for bullish, red for bearish).
- It provides visual backgrounds and alerts to assist traders in spotting potential trade setups.
---
### **2. Components**
The script is divided into two main parts: **Reversal Logic** and **Confirmation Logic**.
---
### **3. Reversal Logic (Red & Green Zones)**
#### **Bollinger Bands**
- **Parameters**:
- Length: 20 periods.
- Source: Closing price (`close`).
- Multiplier: 2.0 (standard deviations).
- **Calculation**:
- `basis`: 20-period Simple Moving Average (SMA).
- `dev`: 2 times the standard deviation of the price over 20 periods.
- `upper`: `basis + dev` (upper band).
- `lower`: `basis - dev` (lower band).
- **Purpose**: Identifies when the price moves outside the normal range (beyond 2 standard deviations).
#### **Relative Strength Index (RSI)**
- **Parameters**:
- Length: 14 periods.
- Low Threshold: 30 (oversold).
- High Threshold: 70 (overbought).
- **Calculation**: `rsiValue = ta.rsi(close, rsiLength)`.
- **Purpose**: Measures momentum to confirm overbought or oversold conditions.
#### **Zone Conditions**
- **Red Zone (Oversold)**:
- Condition: `close < lower` (price below lower Bollinger Band) AND `rsiValue < rsiLowThreshold` (RSI < 30).
- Visual: Light red background (`color.new(color.red, 80)`).
- Alert: "Deep Oversold Signal triggered!".
- **Green Zone (Overbought)**:
- Condition: `close > upper` (price above upper Bollinger Band) AND `rsiValue > rsiHighThreshold` (RSI > 70).
- Visual: Light green background (`color.new(color.green, 80)`).
- Alert: "Deep Overbought Signal triggered!".
#### **Interpretation**
- Red Zone: Suggests the price is oversold and may reverse upward.
- Green Zone: Suggests the price is overbought and may reverse downward.
---
### **4. Confirmation Logic (EMA and MACD Crosses)**
#### **Exponential Moving Averages (EMAs)**
- **Parameters**:
- Short EMA Length: 9 periods (user adjustable).
- Long EMA Length: 21 periods (user adjustable).
- **Calculation**:
- `emaShort = ta.ema(close, emaShortLength)`.
- `emaLong = ta.ema(close, emaLongLength)`.
- **Conditions**:
- **Bullish EMA Cross**: `emaCrossBullish = ta.crossover(emaShort, emaLong)` (9 EMA crosses above 21 EMA).
- **Bearish EMA Cross**: `emaCrossBearish = ta.crossunder(emaShort, emaLong)` (9 EMA crosses below 21 EMA).
#### **MACD**
- **Parameters**:
- Fast Length: 12 periods (user adjustable).
- Slow Length: 26 periods (user adjustable).
- Signal Smoothing: 9 periods (user adjustable).
- **Calculation**:
- ` = ta.macd(close, macdFastLength, macdSlowLength, macdSignalSmoothing)`.
- Only the MACD line and signal line are used; the histogram is ignored (`_`).
- **Conditions**:
- **Bullish MACD Cross**: `macdCrossBullish = ta.crossover(macdLine, 0)` (MACD crosses above zero).
- **Bearish MACD Cross**: `macdCrossBearish = ta.crossunder(macdLine, 0)` (MACD crosses below zero).
#### **Combined Confirmation Conditions**
- **Bullish Confirmation**:
- Condition: `bullishConfirmation = emaCrossBullish and macdCrossBullish`.
- Visual: Very light green background (`color.new(color.green, 90)`).
- Meaning: A bullish trend is confirmed when the 9 EMA crosses above the 21 EMA AND the MACD crosses above zero.
- **Bearish Confirmation**:
- Condition: `bearishConfirmation = emaCrossBearish and macdCrossBearish`.
- Visual: Very light red background (`color.new(color.red, 90)`).
- Meaning: A bearish trend is confirmed when the 9 EMA crosses below the 21 EMA AND the MACD crosses below zero.
---
### **5. Visual Outputs**
- **Reversal Zones**:
- Red background for oversold conditions.
- Green background for overbought conditions.
- **Confirmation Zones**:
- Light green background for bullish confirmation.
- Light red background for bearish confirmation.
- Note: The script does not plot the Bollinger Bands, EMAs, or MACD lines—only the background zones are visualized.
---
### **6. Alerts**
- **Deep Oversold Alert**: Triggers when the red zone condition is met.
- **Deep Overbought Alert**: Triggers when the green zone condition is met.
- No alerts are set for the confirmation zones (EMA/MACD crosses).
---
### **7. How It Works**
1. **Reversal Detection**:
- The script uses Bollinger Bands and RSI to flag extreme price levels (red for oversold, green for overbought).
- These zones suggest potential reversals but are not confirmed yet.
2. **Trend Confirmation**:
- EMA crosses (9/21) and MACD zero-line crosses provide confirmation of a trend direction.
- Bullish confirmation (green) occurs when both indicators align upward.
- Bearish confirmation (red) occurs when both indicators align downward.
3. **Trading Strategy**:
- Look for a red zone (oversold) followed by a bullish confirmation for a potential long entry.
- Look for a green zone (overbought) followed by a bearish confirmation for a potential short entry.
---
### **8. How to Use**
1. Add the script to TradingView.
2. Adjust inputs (EMA lengths, MACD settings) if desired.
3. Monitor the chart:
- Red zones indicate oversold conditions—watch for a potential upward reversal.
- Green zones indicate overbought conditions—watch for a potential downward reversal.
- Light green/red backgrounds confirm the trend direction after a reversal zone.
4. Set up alerts for oversold/overbought conditions to catch reversal signals early.
---
### **9. Key Features**
- **Dual Purpose**: Combines reversal detection (Bollinger Bands + RSI) with trend confirmation (EMA + MACD).
- **Visual Simplicity**: Uses background colors instead of plotting lines, keeping the chart clean.
- **Customizable**: Allows users to tweak EMA and MACD periods.
- **Alerts**: Notifies users of extreme conditions for timely action.
---
### **10. Limitations**
- No plotted indicators (e.g., Bollinger Bands, EMAs, MACD) for visual reference—relies entirely on background shading.
- Confirmation signals (EMA/MACD) may lag behind reversal zones, potentially missing fast reversals.
- No alerts for confirmation zones, limiting real-time notification of trend confirmation.
This script is ideal for traders who want a straightforward way to spot potential reversals and confirm them with trend-following indicators, all overlaid on the price chart.
