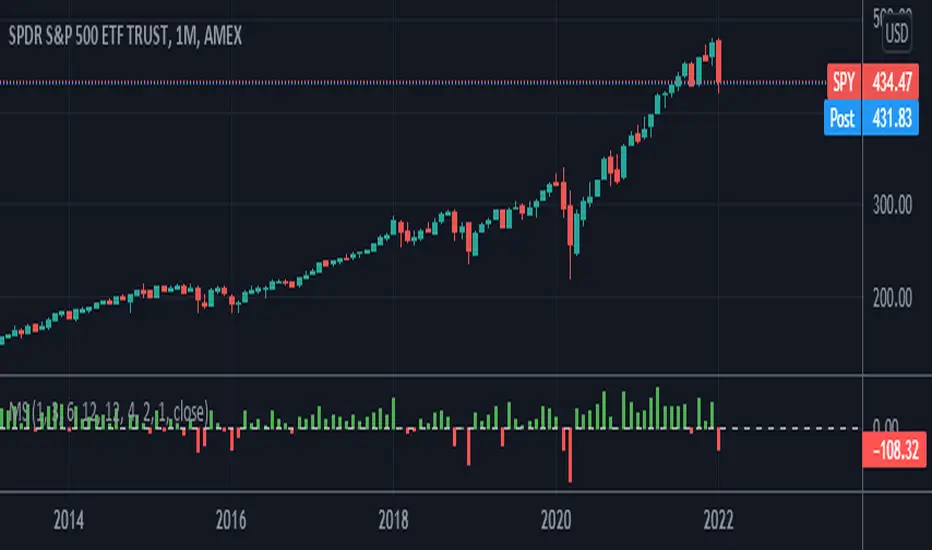
Momentum ScoreMomentum is the tendency of assets that have gone up in price to continue going up in price - and for assets that have gone down in price to continue going down in price. The reasons behind it are not well understood by academics, but momentum is a property that exists across geographies and asset classes.
The Momentum Score is a system that scores companies based on their one year total returns, excluding the last month of returns. In other words, a momentum score for today will be based on the total returns of a stock from 12 months ago today to one month ago today.
Our Momentum Score 13612W has the following composition:
MS 13612W = 12 * Roc(1) + 4 * Roc(3) + 2 * Roc(6) + 1 * Roc(12)
with ROC = (p0/pt) - 1, where pt equals price p with a t-month lag
Cari dalam skrip untuk "momentum"
Momentum IndicatorMomentum indicator with adjustable EMA's bar colors lime for volume increase red for volume decrease
Momentum With Bullish & Bearish LabelMOMENTUM WITH BULLISH AND BEARISH SIGNALS
This is a momentum oscillator that paints red or green depending on whether Momentum is above or below the zero line. It includes a label on the right hand side that will reflect the bullish or bearish direction of the current momentum by changing colors to red or green and text telling you Bullish or Bearish.
***HOW TO USE***
When Momentum is above zero, it is bullish. When Momentum is below zero it is bearish.
A label on the right side will update in real time to tell you if momentum is Bullish or Bearish for faster recognition of the trend.
When momentum is above the zero line(Bullish) but trending downward, a second label will show up in purple to notify you of a change in momentum direction.
When momentum is below the zero line(Bearish) but trending upward, a second label will show up in purple to notify you of a change in momentum direction.
This indicator was built to help you quickly identify the Bullish or Bearish nature of the current Momentum using colors as well as a live color changing label so you can glance at the label and understand it's direction without analyzing the indicator data.
***MARKETS***
This indicator can be used as a signal on all markets, including stocks, crypto, futures and forex.
***TIMEFRAMES***
This momentum indicator can be used on all timeframes.
***TIPS***
Try using numerous indicators of ours on your chart so you can instantly see the bullish or bearish trend of multiple indicators in real time without having to analyze the data. Some of our favorites are our Auto Fibonacci, Directional Movement Index, Volume Profile, Auto Support And Resistance and Money Flow Index in combination with this Momentum Oscillator. They all have real time Bullish and Bearish labels as well so you can immediately understand each indicator's trend.

Momentum Volume Divergence (MVD) EnhancedMomentum Volume Divergence (MVD) Enhanced is a powerful indicator that detects price-momentum divergences and momentum suppression for reversal trading. Optimized for XRP on 1D charts, it features dynamic lookbacks, ATR-adjusted thresholds, and SMA confirmation. Signals include strong divergences (triangles) and suppression warnings (crosses). Includes a detailed user guide—try it out and share your feedback!
Setup: Add to XRP 1D chart with defaults (mom_length_base=8, vol_length_base=10). Signals: Red triangle (sell), Green triangle (buy), Orange cross (bear warning), Yellow cross (bull warning). Confirm with 5-day SMA crossovers. See full guide for details!
Disclaimer: This indicator is for educational purposes only, not financial advice. Trading involves risk—use at your discretion.
Momentum Volume Divergence (MVD) Enhanced Indicator User Guide
Version: Pine Script v6
Designed for: TradingView
Recommended Use: XRP on 1-day (1D) chart
Date: March 18, 2025
Author: Herschel with assistance from Grok 3 (xAI)
Overview
The Momentum Volume Divergence (MVD) Enhanced indicator is a powerful tool for identifying price-momentum divergences and momentum suppression patterns on XRP’s 1-day (1D) chart. Plotted below the price chart, it provides clear visual signals to help traders spot potential reversals and trend shifts.
Purpose
Detect divergences between price and momentum for buy/sell opportunities.
Highlight momentum suppression as warnings of fading trends.
Offer actionable trading signals with intuitive markers.
Indicator Components
Main Plot
Volume-Weighted Momentum (vw_mom): Blue line showing momentum adjusted by volume.
Above 0 = bullish momentum.
Below 0 = bearish momentum.
Zero Line: Gray dashed line at 0, separating bullish/bearish zones.
Key Signals
Strong Bearish Divergence:
Marker: Red triangle at the top.
Meaning: Price makes a higher high, but momentum weakens, confirmed by a drop below the 5-day SMA.
Action: Potential sell/short signal.
Strong Bullish Divergence:
Marker: Green triangle at the bottom.
Meaning: Price makes a lower low, but momentum strengthens, confirmed by a rise above the 5-day SMA.
Action: Potential buy/long signal.
Bearish Suppression:
Marker: Orange cross at the top + red background.
Meaning: Strong bullish momentum with low volume in a volume downtrend, suggesting fading strength.
Action: Warning to avoid longs or exit early.
Bullish Suppression:
Marker: Yellow cross at the bottom + green background.
Meaning: Strong bearish momentum with low volume in a volume uptrend, suggesting fading weakness.
Action: Warning to avoid shorts or exit early.
Debug Plots (Optional)
Volume Ratio: Gray line (volume vs. its MA) vs. yellow line (threshold).
Momentum Threshold: Purple lines (positive/negative momentum cutoffs).
Smoothed Momentum: Orange line (raw momentum).
Confirmation SMA: Purple line (price trend confirmation).
Labels
Text labels (e.g., "Bear Div," "Bull Supp") mark detected patterns.
How to Use the Indicator
Step-by-Step Trading Process
1. Monitor the Chart
Load your XRP 1D chart with the indicator applied.
Observe the blue vw_mom line and signal markers.
2. Spot a Signal
Primary Signals: Look for red triangles (strong_bear) or green triangles (strong_bull).
Warnings: Note orange crosses (suppression_bear) or yellow crosses (suppression_bull).
3. Confirm the Signal
For Strong Bullish Divergence (Buy):
Green triangle appears.
Price closes above the 5-day SMA (purple line) and a recent swing high.
Optional: Volume ratio (gray line) exceeds the threshold (yellow line).
For Strong Bearish Divergence (Sell):
Red triangle appears.
Price closes below the 5-day SMA and a recent swing low.
Optional: Volume ratio (gray line) falls below the threshold (yellow line).
4. Enter the Trade
Long:
Buy at the close of the signal bar.
Stop loss: Below the recent swing low or 2 × ATR(14) below entry.
Short:
Sell/short at the close of the signal bar.
Stop loss: Above the recent swing high or 2 × ATR(14) above entry.
5. Manage the Trade
Take Profit:
Aim for a 2:1 or 3:1 risk-reward ratio (e.g., risk $0.05, target $0.10-$0.15).
Or exit when an opposite suppression signal appears (e.g., orange cross for longs).
Trailing Stop:
Move stop to breakeven after a 1:1 RR move.
Trail using the 5-day SMA or 2 × ATR(14).
Early Exit:
Exit if a suppression signal appears against your position (e.g., suppression_bull while short).
6. Filter Out Noise
Avoid trades if a suppression signal precedes a divergence within 2-3 days.
Optional: Add a 50-day SMA on the price chart:
Longs only if price > 50-SMA.
Shorts only if price < 50-SMA.
Example Trades (XRP 1D)
Bullish Trade
Signal: Green triangle (strong_bull) at $0.55.
Confirmation: Price closes above 5-SMA and $0.57 high.
Entry: Buy at $0.58.
Stop Loss: $0.53 (recent low).
Take Profit: $0.63 (2:1 RR) or exit on suppression_bear.
Outcome: Price hits $0.64, exit at $0.63 for profit.
Bearish Trade
Signal: Red triangle (strong_bear) at $0.70.
Confirmation: Price closes below 5-SMA and $0.68 low.
Entry: Short at $0.67.
Stop Loss: $0.71 (recent high).
Take Profit: $0.62 (2:1 RR) or exit on suppression_bull.
Outcome: Price drops to $0.61, exit at $0.62 for profit.
Tips for Success
Combine with Price Levels:
Use support/resistance zones (e.g., weekly pivots) to confirm entries.
Monitor Volume:
Rising volume (gray line above yellow) strengthens signals.
Adjust Sensitivity:
Too many signals? Increase div_strength_threshold to 0.7.
Too few signals? Decrease to 0.3.
Backtest:
Review 20-30 past signals on XRP 1D to assess performance.
Avoid Choppy Markets:
Skip signals during low volatility (tight price ranges).
Troubleshooting
No Signals:
Lower div_strength_threshold to 0.3 or mom_threshold_base to 0.2.
Check if XRP’s volatility is unusually low.
False Signals:
Increase sma_confirm_length to 7 or add a 50-SMA filter.
Indicator Not Loading:
Ensure the script compiles without errors.
Customization (Optional)
Change Colors: Edit color.* values (e.g., color.red to color.purple).
Add Alerts: Use TradingView’s alert menu for "Strong Bearish Divergence Confirmed," etc.
Test Other Assets: Experiment with BTC or ETH, adjusting inputs as needed.
Disclaimer
This indicator is for educational purposes only and not financial advice. Trading involves risk, and past performance does not guarantee future results. Use at your own discretion.
Setup: Use on XRP 1D with defaults (mom_length_base=8, vol_length_base=10). Signals: Red triangle (sell), Green triangle (buy), Orange cross (bear warning), Yellow cross (bull warning). Confirm with 5-day SMA cross. Stop: 2x ATR(14). Profit: 2:1 RR or suppression exit. Full guide available separately!

Momentum 2.0 [AstrideUnicorn]Momentum 2.0 is a normalized Momentum oscillator with a moving base-level. The oscillator value is normalized by its standard deviation, similar to the z-score technique. Instead of the zero level, the indicator uses the base-level calculated as the inverted long-term average value of the oscillator. Similar to the zero-level crossing signal used for the Momentum oscillator, our oscillator calculates the base level crossing signal.
The moving base-level helps to reduce the number of false signals. In an uptrend the base-level is below zero, in a downtrend it is above it. This allows us to take into account the trend stability effect. In this case, to form a reversal signal, the oscillator must cross a lower value in an uptrend and a higher value in a downtrend.
HOW TO USE
When the oscillator crosses above the base-level, it gives a bullish signal, when below it gives a bearish signal. The signals are displayed as green and red labels, respectively.
The color of the histogram shows the current direction of the price momentum. Green indicates an upward move and red indicates a downward move. The blue line represents the base-level.
SETTINGS
Oscillator Period - determines the period of the Momentum oscillator
Base Level Period - determines the period used for long-term averaging when calculating the base-level and normalizing the oscillator

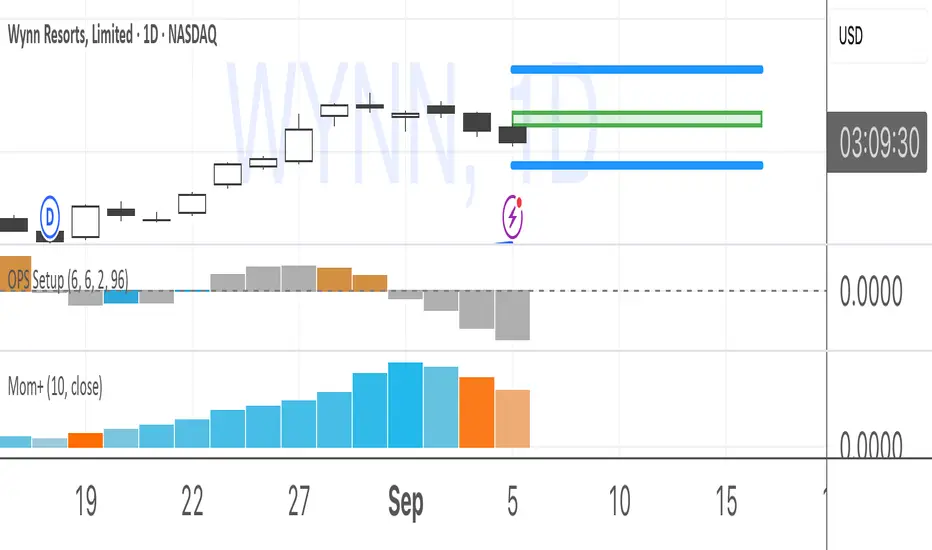
Momentum+This script provides a colored histogram of recent price action with the price derivative method for finding momentum.
Momentum of Relative strength to Index Leaf_West styleMomentum of Relative Strength to index as used by Leaf_West. This is to be used with the companion Relative Strength to Index indicator Leaf_West Style. Make sure you use the same index for comparison. If you follow his methods be aware of the different moving averages for the different time periods. From Leaf_West: "on my weekly and monthly R/S charts, I include a 13 EMA of the R/S (brown dash line) and an 8 SMA of the 13 EMA (pink solid line). The indicator on the bottom of the weekly/monthly charts is an 8 period momentum indicator of the R/S line. The red horizontal line is drawn at the zero line.
For daily or 130-minute time periods (or shorter), my R/S charts are slightly different - the moving averages of the R/S line include a 20EMA (brown dash line), a 50 EMA (blue dash line) and an 8 SMA of the20 EMA (pink solid line). The momentum indicator is also slightly different from the weekly/monthly charts – here I use a 12 period calculation (vs 8 SMA period for the weekly/monthly charts)." Leaf's methods do evolve and so watch for any changes to the preferred MAs etc..

Sumon Pal Momentum OscMomentum Indicator
This is a momentum oscillator calculated by the high/low/close of each bar price movement over a period of time.
When the short term momentum(green line) crosses above the long term momentum line(red)it indicates price is gaining momentum on upside and price may move up.
When the short term momentum(green line) crosses below the long term momentum line(red)it indicates price is gaining momentum on downside and price may go down.
When two lines are flat and converging (both lines are moving closer to each other) it shows momentum is fading out either side and price may go sideways until crossover happens.
Green line above 1 is considered to be overbought zone and below -1 is oversold zone. Look for divergences in these zone along with price action to get a probable price reversal.
When the short time line moves between -0.2 and +0.2, price generally stays in congestion mode
This indicator alone can't be used for buying or selling decision. This indicator can be used along with price action and volume confirmation to get an idea if volume is supporting the momentum or not..
Disclaimer: Backtest this indicator with price action over a period of time and understand how it works before taking any trading decision. The above points are derived based on my observation over a period of time. Trading in equity is always risky. Asses your risk profile and trade by managing proper risk.

Momentum Indicator (Market Experts)Market Experts Momentum Indicator identifies when the price is moving upward or downward and how strongly. When the first version of the momentum indicator is a positive number, the price is above the price "n" periods ago. When it's a negative number, the price is below the price "n" periods ago.

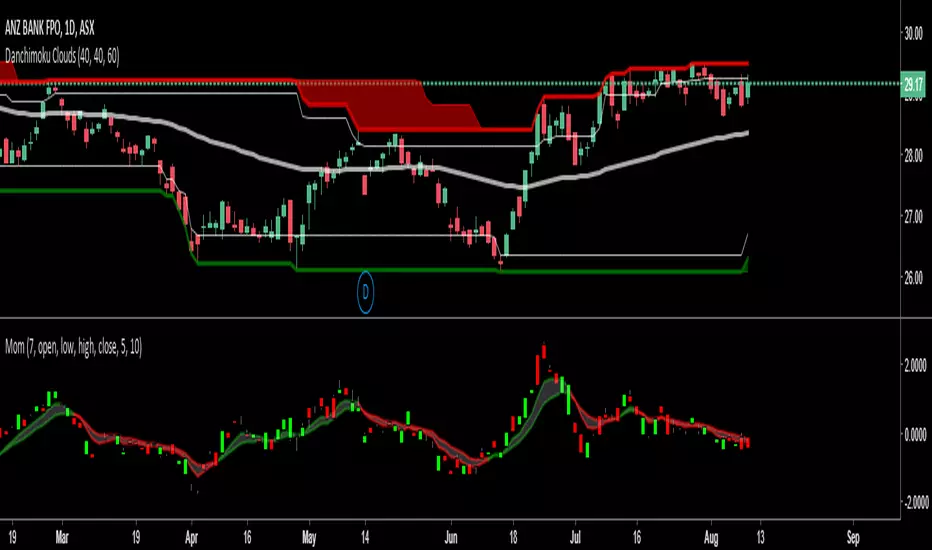
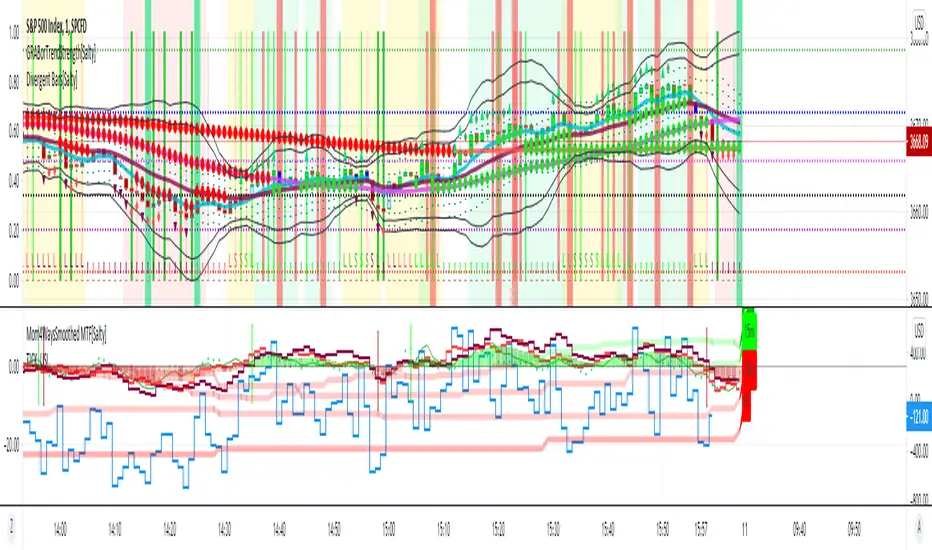
Momentum 4 Ways Smoothed MTF [Salty]This script improves on the existing Momentum 4 Ways Smoothed indicator by showing the smoothed values for Week (labeled W), Day (labeled D), and Hour (labeled H) along with the detailed values for the currently selected time frame. This allows the user to compare the momentum in the current time with other time frames easily. For example, one can see the detailed momentum lines on the 15 minute time frame while also seeing the smoothed value for the Week, Day, and Hour lines to know when the lower value time frame is in sync with the higher time frames.
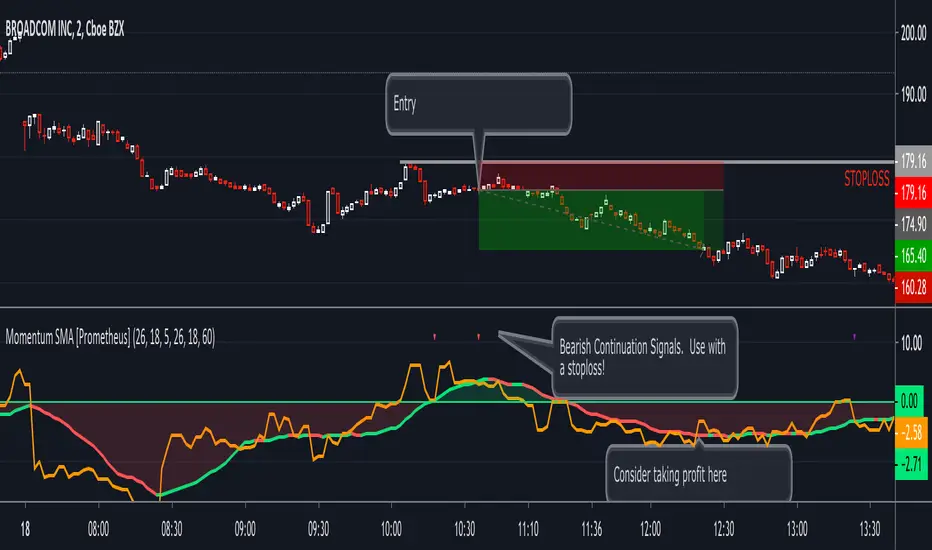
Momentum SMA [Prometheus]This is a price momentum indicator that calculates the change in price momentum over time with a simple moving average to use as a potential profit taking mechanism.
The lookback period is for calculating the momentum plot on the chart. It measures the closing price between the current candle and the candle X periods ago. (orange line)
The indicator also has a simple moving average of the momentum plotted on the chart. (red/green line with background fill)
This script improves upon its predecessor with an additional higher timeframe momentum indicator and the ability to make both plots represent a fixed timeframe so that you can switch between chart timeframes and continue to see the same momentum profile.
Future versions will include alertconditions.
Momentum 4 Ways [Salty]This script provides the ability to see 4 momentum values at once and a combined average of all 4 values. The user can see how fast momentum values are affecting the slow momentum values when all values are combined. Also, if the combined average value is greater than zero then momentum is considered bullish. Otherwise, values below zero are considered bearish.

Momentum Oscillator - Column PlotThis script is based on the existing Momentum Indicator which shows whether the underlying percentage change in closing price is positive or negative.
This script however uses columns to plot the change and shows this as green for >0 change, and red for <0.

Momentum Scalping & Swing Signals With AlertsThis Momentum indicator shows a green or red ribbon when smoothed momentum is bullish or bearish. It also includes a long moving average for overall trend confirmation. Wait until the ribbon holds above or below the long moving average and take positions in that direction.
To get an easier to read momentum indicator, I smoothed the momentum out and paired it next to a short term RMA. These two together form the ribbon that will show you early reversals and trend direction. The long moving average is used as an overall trend detector and confirmation for longer term trends.
***HOW TO USE***
Scalping: Enter longs when the ribbon turns green and enter shorts when the ribbon turns red. Exit positions when the ribbon turns the opposite color or crosses the long moving average.
Swing Trading: When the ribbon holds above the long moving average or breaks out and retests it, look for long positions and exit when the ribbon turns red or crosses the long moving average. When the ribbon holds below the long moving average or breaks down and retests it, look for short positions and exit when the ribbon turns green or crosses the long moving average.
***DETAILS***
This indicator gives early reversal signals very well and waiting for the momentum ribbon to cross the long moving average helps to get you into positions when the market is ready to really move while filtering out some of the noise.
The ribbon and background will change to green or red depending on whether it is currently bullish or bearish.
There is also a label that changes colors and tells you if momentum is bullish or bearish and also whether the momentum ribbon is above or below the long moving average.
Green or red circles will appear on the indicator when there is a bullish or bearish cross of the momentum ribbon and the long moving average.
It includes alerts that trigger when momentum is turning bullish/bearish or when the momentum ribbon is crossing the long moving average.
***CUSTOMIZATION***
Each piece of this indicator can be customized to suit your preferences including the momentum source, length, smoothing length, short moving average length and long moving average length. You can also turn off the labels, signals and long moving average. All of these settings can be managed within the indicator settings input tab.
***MARKETS***
This indicator can be used as a signal on all markets, including stocks, crypto, futures and forex.
***TIMEFRAMES***
This Momentum Scalping & Swing Signals indicator can be used on all timeframes.
***TIPS***
Try using numerous indicators of ours on your chart so you can instantly see the bullish or bearish trend of multiple indicators in real time without having to analyze the data. Some of our favorites are Trend Friend Scalp & Swing Trade Signals, Volume Spike Scanner, Buy & Sell Pressure Volume Profile, and RSI Scalper in combination with this momentum indicator. They all have real time Bullish and Bearish labels as well so you can immediately understand each indicator's trend.

Momentum Shift Oscillator (MSO) [SharpStrat]Momentum Shift Oscillator (MSO)
The Momentum Shift Oscillator (MSO) is a custom-built oscillator that combines the best parts of RSI, ROC, and MACD into one clean, powerful indicator. Its goal is to identify when momentum shifts are happening in the market, filtering out noise that a single momentum tool might miss.
Why MSO?
Most traders rely on just one momentum indicator like RSI, MACD, or ROC. Each has strengths, but also weaknesses:
RSI → great for overbought/oversold, but often lags in strong trends.
ROC (Rate of Change) → captures price velocity, but can be too noisy.
MACD Histogram → shows trend strength shifts, but reacts slowly at times.
By blending all three (with adjustable weights), MSO gives a balanced view of momentum. It captures trend strength, velocity, and exhaustion in one oscillator.
How MSO Works
Inputs:
RSI, ROC, and MACD Histogram are calculated with user-defined lengths.
Each is normalized (so they share the same scale of -100 to +100).
You can set weights for RSI, ROC, and MACD to emphasize different components.
The components are blended into a single oscillator value.
Smoothing (SMA, EMA, or WMA) is applied.
MSO plots as a smooth line, color-coded by slope (green rising, red falling).
Overbought and oversold levels are plotted (default: +60 / -60).
A zero line helps identify bullish vs bearish momentum shifts.
How to trade with MSO
Zero line crossovers → crossing above zero suggests bullish momentum; crossing below zero suggests bearish momentum.
Overbought and oversold zones → values above +60 may indicate exhaustion in bullish moves; values below -60 may signal exhaustion in bearish moves.
Slope of the line → a rising line shows strengthening momentum, while a falling line signals fading momentum.
Divergences → if price makes new highs or lows but MSO does not, it can point to a possible reversal.
Why MSO is Unique
Combines trend + momentum + velocity into one view.
Filters noise better than standalone RSI/MACD.
Adapts to both trend-following and mean-reversion styles.
Can be used across any timeframe for confirmation.

Momentum Oscillator, Divergences & Signals [TrendAlpha]The "Momentum, Real Time Divergences & Signals " indicator is designed to provide traders with insights into market momentum, identify potential divergences, and generate buy and sell signals. It offers a comprehensive set of features to assist traders in making informed trading decisions.
The indicator starts by calculating the momentum oscillator based on user-defined parameters.
- Traders can adjust the "Length" parameter to customize the sensitivity of the oscillator. The default value is set to 7, but it can be modified according to individual preferences.
- The "Source" parameter allows traders to select the input source for the oscillator calculation, with the default being the closing price of the asset.
- Traders have the option to display divergence lines by switching on the "Show Lines" parameter. This feature helps identify potential divergences between the oscillator and the price.
The oscillator is calculated using a two-step process. First, a smoothing function is applied to the source data using the "sma" (simple moving average) function. Then, the rate of change is computed over the specified length using the "mom" (momentum) function. Positive oscillator values indicate upward momentum, while negative values indicate downward momentum.
The indicator also generates buy and sell signals by identifying bullish and bearish divergences. A bullish divergence occurs when the oscillator is negative and crosses above zero, while a bearish divergence occurs when the oscillator is positive and crosses below zero. The indicator checks for specific conditions to confirm the divergences, such as comparing the current oscillator value with the previous value and validating the corresponding price action.
When a bullish or bearish divergence is detected, the indicator plots circles to highlight these signals on the chart. A green circle indicates a bullish signal, suggesting a potential buying opportunity, while a red circle indicates a bearish signal, suggesting a potential selling opportunity. In addition to circles, the indicator also displays labels to provide further clarity on the signals. A "Buy" label is shown for bullish signals, and a "Sell" label is shown for bearish signals.
To visually represent the divergences, the indicator plots lines connecting the corresponding points on the oscillator. A green line is drawn for bullish divergences, while a red line is drawn for bearish divergences. Traders can easily observe the divergence patterns and their relationships with the price action, aiding them in making trading decisions.
- The indicator also includes alert conditions for both bullish and bearish divergences. Traders can set up alerts to receive notifications when potential divergences occur, allowing them to take timely action.

Momentum Oscillator [Dynamic & Flow] (Expo)Momentum Oscillator -Dynamic & Flow (Expo) is a fast-moving, sensitive oscillator that makes use of momentum in various ways. The indicator has two additional layers (Buy & Sell moves) and (Extremes) which makes it reacts quickly to price changes.
The indicator displays overbought and oversold areas as well as extreme areas and how aggressive buyers and sellers are. It does also displays potential reversal points or potential pullbacks.
The following momentum modes are displayed:
1. Where momentum begins
2. Where momentum is strong
3. Where momentum begins to stall
Where momentum begins to stall is displayed as a red and green color on the momentum line .
Where momentum begins (light green and light red color) and where it's strong (dark green and dark red color) is displayed as upper and lower lines. The darker these lines are the stronger is the momentum.
Potential reversal or pullback is displayed as a blue color on the signal line.
♢ The indicator has inbuilt suggested buy & sell- and stop-loss signals. These signals have flexible settings, so a fast, slow, and sensitive mode can be enabled.
DIVERGENCES
All types of momentum oscillators produce divergences and so does Momentum Oscillator Dynamic & Flow (Expo) . Divergences occur when the oscillator deviates from the trending price action. Bullish divergence is then when the trending price makes a lower low but the oscillator makes a higher low. Bearish divergence is then when the trending price makes a higher high but the oscillator makes a lower high.
HOW TO USE
1. Use the indicator to identify overbought/oversold areas, as well as extreme modes.
2. Use the indicator to display momentum in various ways.
3. Use the indicator to confirm the existence, or a continuation, of a trend.
4. Use the indicator to identify potential reversal points or potential pullbacks.
INDICATOR IN ACTION
4-hour chart
I hope you find this indicator useful , and please comment or contact me if you like the script or have any questions/suggestions for future improvements. Thanks!
I will continually work on this indicator, so please share your experience and feedback as it will enable me to make even better improvements. Thanks to everyone that has already contacted me regarding my scripts. Your feedback is valuable for future developments!
ACCESS THE INDICATOR
• Contact me on TradingView or use the links below
-----------------
Disclaimer
Copyright by Zeiierman.
The information contained in my scripts/indicators/ideas does not constitute financial advice or a solicitation to buy or sell any securities of any type. I will not accept liability for any loss or damage, including without limitation any loss of profit, which may arise directly or indirectly from the use of or reliance on such information.
All investments involve risk, and the past performance of a security, industry, sector, market, financial product, trading strategy, or individual’s trading does not guarantee future results or returns. Investors are fully responsible for any investment decisions they make. Such decisions should be based solely on an evaluation of their financial circumstances, investment objectives, risk tolerance, and liquidity needs.
My scripts/indicators/ideas are only for educational purposes!

Momentum TrackerDescription
To screen for momentum movers, one can filter for stocks that have made a noticeable move over a set period. This initial move defines the momentum or swing move. From this list of candidates, we can create a watchlist by selecting those showing a momentum pause, such as a pullback or consolidation, which later could set up for a continuation.
Momentum = Magnitude × Time
This Momentum Tracker indicator serves as a study tool to visualize when stocks historically met these momentum conditions. It marks on the chart where a stock would have appeared on the screener, allowing us to review past momentum patterns and screener requirements. The indicator measures momentum in three different ways:
Normalized Momentum
Identifies when the current price reaches a new high or low compared to a historical window. This is the most standardized measurement and adapts well across markets.
Normalized = Current Price ≥ Maximum Price in Lookback
Normalized = Current Price ≤ Minimum Price in Lookback
Relative Momentum
Measures the percentage difference between a fast and a slow moving average. This method helps capture acceleration, the rate at which momentum is building over time.
Relative = |Fast MA − Slow MA| ÷ Slow MA × 100
Absolute Momentum
Measures how far price has moved from the highest or lowest point within a defined lookback period.
Absolute = (Current Price − Lowest Price) ÷ Lowest Price × 100
Absolute = (Highest Price − Current Price) ÷ Highest Price × 100
Customization
The tool is customizable in terms of lookback period and thresholds to accommodate different trading styles and timeframes, allowing users to set criteria that align with specific hold times and momentum requirements. While the various calculations can be enabled, the tool is best used in isolation of each to visualize different momentum conditions.

Momentum Deviation Bands [Loxx]Momentum Deviation Bands uses a variation of standard deviation. Instead of using price to calculate standard deviation, this uses momentum. This is another type of volatility that will be used in future indicators. This indicator serves more as an educational tool, but can also be used in trading.
You can read about the included moving averages here:
Included
Bar coloring
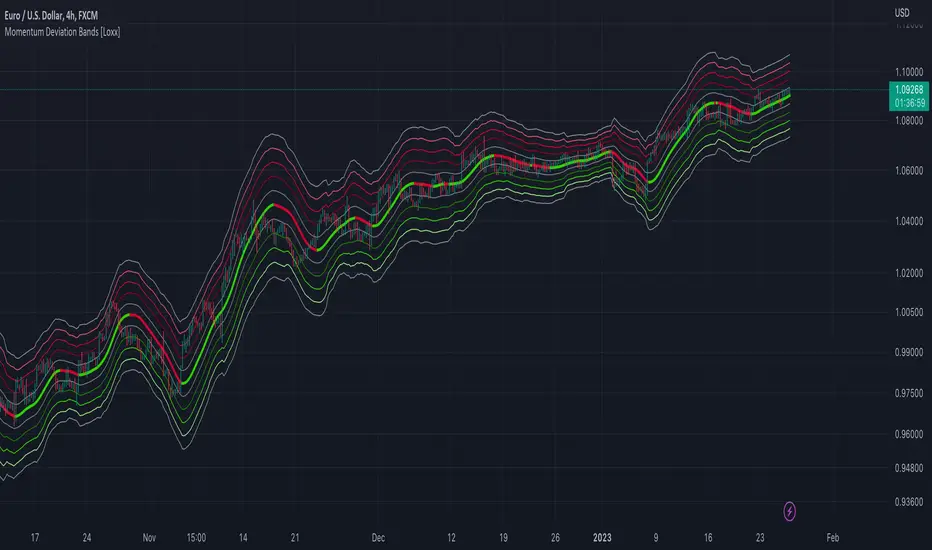
Momentum & Squeeze Oscillator [UAlgo]The Momentum & Squeeze Oscillator is a technical analysis tool designed to help traders identify shifts in market momentum and potential squeeze conditions. This oscillator combines multiple timeframes and periods to provide a detailed view of market dynamics. It enhances the decision-making process for both short-term and long-term traders by visualizing momentum with customizable colors and alerts.
🔶 Key Features
Custom Timeframe Selection: Allows users to select a custom timeframe for oscillator calculations, providing flexibility in analyzing different market periods.
Recalculation Option: Enables or disables the recalculation of the indicator, offering more control over real-time data processing.
Squeeze Background Visualization: Highlights potential squeeze conditions with a background color, helping traders quickly spot consolidation periods.
Adjustable Squeeze Sensitivity: Users can modify the sensitivity of the squeeze detection, tailoring the indicator to their specific trading style and market conditions.
Bar Coloring Condition: Option to color the price bars based on momentum conditions, enhancing the visual representation of market trends.
Threshold Bands: Option to fill threshold bands for a clearer visualization of overbought and oversold levels.
Reference Lines: Display reference lines for overbought, oversold, and mid-levels, aiding in quick assessment of momentum extremes.
Multiple Output Modes: Offers different output visualization modes, including:
ALL: Displays all calculated momentum values (fast, medium, slow).
AVG: Shows the average momentum, providing a consolidated view.
STD: Displays the standard deviation of momentum, useful for understanding volatility.
Alerts: Configurable alerts for key momentum events such as crossovers and squeeze conditions, keeping traders informed of important market changes.
🔶 Usage
The Momentum & Squeeze Oscillator can be used for various trading purposes:
Trend Identification: Use the oscillator to determine the direction and strength of market trends. By analyzing the average, fast, medium, and slow momentum lines, traders can gain insights into short-term and long-term market movements.
Squeeze Detection: The indicator highlights periods of low volatility (squeeze conditions) which often precede significant price movements. Traders can use this information to anticipate and prepare for potential breakouts.
Overbought/Oversold Conditions: The oscillator helps identify overbought and oversold conditions, indicating potential reversal points. This is particularly useful for timing entry and exit points in the market.
Momentum Shifts: By monitoring the crossover of momentum lines with key levels (e.g., the 50 level), traders can spot shifts in market momentum, allowing them to adjust their positions accordingly.
🔶 Disclaimer:
Use with Caution: This indicator is provided for educational and informational purposes only and should not be considered as financial advice. Users should exercise caution and perform their own analysis before making trading decisions based on the indicator's signals.
Not Financial Advice: The information provided by this indicator does not constitute financial advice, and the creator (UAlgo) shall not be held responsible for any trading losses incurred as a result of using this indicator.
Backtesting Recommended: Traders are encouraged to backtest the indicator thoroughly on historical data before using it in live trading to assess its performance and suitability for their trading strategies.
Risk Management: Trading involves inherent risks, and users should implement proper risk management strategies, including but not limited to stop-loss orders and position sizing, to mitigate potential losses.
No Guarantees: The accuracy and reliability of the indicator's signals cannot be guaranteed, as they are based on historical price data and past performance may not be indicative of future results.

Momentum Velocity [BackQuant]Momentum Velocity
Main Features:
- Momentum Based Oscillator
- Divergences
- Overbought and Oversold Conditions based off a VZO
- Alert Conditions
- Ability to make Adaptive
- Big User input menu for customisation
The Momentum Velocity indicator is based on the principle of momentum , which is a measure of the rate of change or the speed at which prices move over a specified time period. The underlying assumption of momentum trading is that assets that have performed well in the recent past will continue to perform well in the near future, and conversely, assets that have performed poorly will continue to perform poorly. This concept is widely accepted and empirically supported in financial literature, making the Momentum Velocity indicator empirically sound for several reasons:
Empirical Evidence on Momentum
Academic Research: A foundational piece of research that supports the momentum strategy is Jegadeesh and Titman's study, "Returns to Buying Winners and Selling Losers: Implications for Stock Market Efficiency," published in the Journal of Finance in 1993. The authors find that strategies which buy stocks that have performed well in the past and sell stocks that have performed poorly generate significantly higher than expected returns over 3- to 12-month holding periods. This study is one of many that empirically validate the momentum effect in stock returns.
Behavioural Finance Theories:
Behavioural finance provides explanations for the momentum effect that go beyond the efficient market hypothesis. Theories such as investor herding, overreaction and under reaction to news, and the disposition effect can cause price trends to continue. The momentum strategy exploits these behavioural biases by assuming that prices will continue to move in their current direction for some time.
Global Evidence:
The momentum effect is not limited to specific markets or asset classes. Studies have documented momentum profits across various countries, markets, and asset types (stocks, bonds, commodities, and currencies). For instance, Asness, Moskowitz, and Pedersen in their paper, "Value and Momentum Everywhere," published in the Journal of Finance in 2013, show that momentum strategies can yield positive returns in different international markets.
Risk Factors:
Some researchers argue that the returns to momentum strategies are compensation for bearing certain risks. However, the empirical evidence suggests that momentum returns are difficult to explain by traditional risk factors alone, adding to the strategy’s attractiveness. The factor model of Carhart (1997), which adds a momentum factor to the Fama and French three-factor model, highlights the importance of momentum as a distinct source of returns.
Empirical Evidence Application
The Momentum Velocity indicator applies these empirical insights by quantitatively measuring the speed and direction of price movements over a given period, adjusting for recent market conditions through adaptive filtering, and normalizing the results to identify potential trading signals. By doing so, it provides traders with a tool that not only captures the essence of the momentum anomaly but also enhances it with modern technical analysis techniques for real-time market application.
Trading Application
Due to the robustness of momentum, traders are able to use this as a confluence metric into their system on any timeframe. Providing robust signals, that by extention are adaptive to the market. This is also further enabled by using adaptive filtering.
Conclusion
In summary, the empirical soundness of the Momentum Velocity indicator is grounded in the well-documented momentum effect observed in financial markets. By leveraging historical price data to predict future price movements, it aligns with both academic research and observed market behavior, making it a potentially valuable tool for traders seeking to exploit momentum-based trading opportunities.
User Inputs:
Calculation Source: Choose the price component (e.g., close) to base calculations on.
Lookback Period: Define the period over which momentum and normalization are calculated.
Use Adaptive Filtering?: Toggle the use of DEMA for more responsive momentum calculation.
Adaptive Lookback Period: Set the period for the adaptive filter when enabled.
Show Momentum Moving Average?: Option to display a moving average of the plotosc for trend smoothing.
MA Period: Specify the period for the momentum moving average.
Show Static High and Low Levels: Display predefined levels indicating extreme momentum thresholds.
Color Bars According to Trend?: Color price bars based on the momentum direction for quick visual reference.
Show Overbought and Oversold Signals: Highlight extreme volume conditions as potential buy/sell signals.
Signal Calculation Period: Set the period for calculating volume-based signals.
Show Detected Divergences?: Enable or disable the visualization of bullish and bearish divergences.
How it can be used in the context of a Trading System
Momentum and momentum divergences are pivotal concepts in trading systems, offering traders insights into the strength and potential reversal points of market trends. Momentum, a measure of the rate of price changes, helps traders identify the velocity of market movements, allowing them to ride the wave of prevailing trends for profits. When momentum divergences occur—where price movement and momentum indicators move in opposite directions—they signal a weakening of the current trend and potential for reversal. Traders can use these signals to adjust their positions, entering or exiting trades based on the anticipation of trend changes. Incorporating momentum and its divergences into a trading system provides a dynamic strategy that leverages the market's natural cycles of trend strength and exhaustion, aiming to capitalize on both continuation and reversal opportunities for enhanced trading outcomes.
We have also added a volume based component for traders to use as a point of confluence. It is shown on the chart giving background hues for overbought and oversold signals.
Thus following all of the key points here are some sample backtests on the 1D Chart
Disclaimer: Backtests are based off past results, and are not indicative of the future.
INDEX:BTCUSD
INDEX:ETHUSD
BINANCE:SOLUSD
Momentum candle w/ AlertMomentum Candle Indicator with Alerts
The Momentum Candle Indicator is designed to assist traders in identifying candles that exhibit strong momentum based on customizable criteria. This indicator visually highlights momentum candles and provides alerting functionality to ensure timely notifications about significant price movements. It is flexible and suited for various trading styles, offering easy configuration.
Key Features:
Momentum Candle Detection: Identifies candles with a body size and wick characteristics indicative of momentum. The detection criteria are fully customizable to fit individual trading strategies.
Customizable Parameters:
- Minimum Body Size (Pips): The minimum size of the candle body, in pips, for it to be considered a momentum candle.
- Minimum Wick-to-Body Ratio (%): Specifies the minimum percentage of wick relative to the body size to qualify as momentum.
- Maximum Wick-to-Body Ratio (%): Sets the upper limit for the wick-to-body ratio to filter out candles with excessive wicks.
- Timeframe: Select the timeframe for momentum candle analysis (e.g., 15 minutes, 1 hour, etc.).
- Alert Trigger Option: Choose between alerts that trigger at candle close or in real-time when criteria are met. Real-time alerts are sent as soon as the criteria are met, but there is no guarantee that the candle will remain a valid momentum candle at its close.
- Show Detail: Enable or disable additional labels on the chart that display metrics for valid momentum candles.
- Enable Candle Debug: Activate debug mode to show detailed metrics for every candle, assisting in fine-tuning settings.
Visual Feedback: Highlights valid momentum candles on the chart for easy identification. Optional labels display metrics like body size, wick size, and ratios.
Alerts: Configurable alerts notify you whenever a momentum candle is detected, based on your defined criteria.
How to Use:
Add the Indicator to Your Chart: Add this script to your TradingView chart as an indicator.
Configure the Settings: Open the settings panel and adjust the parameters: Define the Minimum Body Size in pips. Set the Wick-to-Body Ratio thresholds. Choose the timeframe for analysis. Select the alert trigger option ( real-time or candle close ). Enable or disable labels and debug information.
Set Up Alerts: Open the TradingView alert panel. Select the condition for this script (e.g., " Momentum Candle Detected "). Customize the alert message and preferences. Click Create to activate the alert.
Analyze Results: Review highlighted momentum candles on the chart. Use optional debug labels for a detailed breakdown of candle metrics.
Why Use This Indicator?
Momentum candles often indicate significant market movements, providing valuable insights for trend-following or breakout strategies. This indicator automates the detection and alert process, helping traders focus on strategy execution while ensuring they don’t miss key opportunities.
With customizable parameters and real-time feedback, this tool is practical, adaptable, and designed to simplify momentum analysis.
