Renko Momentum Wave (RMW)Renko Momentum Wave
The Renko Momentum Wave (RMW) is a custom momentum oscillator specifically designed for Renko-based price action analysis. Unlike traditional oscillators that rely on time-based data, the RMW focuses on the directional consistency of Renko bricks, measuring the strength of trend momentum purely based on price movement.
Cari dalam skrip untuk "momentum"
Institutional MACD (Z-Score Edition) [VolumeVigilante]📈 Institutional MACD (Z-Score Edition) — Professional-Grade Momentum Signal
This is not your average MACD .
The Institutional MACD (Z-Score Edition) is a statistically enhanced momentum tool, purpose-built for serious traders and breakout hunters . By applying Z-Score normalization to the classic MACD structure, this indicator uncovers statistically significant momentum shifts , enabling cleaner reads on price extremes, trend continuation, and potential reversals.
💡 Why It Matters
The classic MACD is powerful — but raw momentum values can be noisy and relative , especially on volatile assets like BTC/USD . By transforming the MACD line, signal line, and histogram into Z-scores , we anchor these signals in statistical context . This makes the Institutional MACD:
✔️ Timeframe-agnostic and asset-normalized
✔️ Ideal for spotting true breakouts , not false flags
✔️ A reliable tool for detecting momentum divergence and exhaustion
🧪 Key Features
✅ Full Z-Score normalization (MACD, Signal, Histogram)
✅ Highlighted ±Z threshold bands for overbought/oversold zones
✅ Customizable histogram coloring for visual momentum shifts
✅ Built-in alerts for zero-crosses and Z-threshold breaks
✅ Clean overlay with optional display toggles
🔁 Strategy Tip: Mean Reversion Signals with Statistical Confidence
This indicator isn't just for spotting breakouts — it also shines as a mean reversion tool , thanks to its Z-Score normalization .
When the Z-Score histogram crosses beyond ±2, it marks a statistically significant deviation from the mean — often signaling that momentum is overstretched and the asset may be due for a pullback or reversal .
📌 How to use it:
Z > +2 → Price action is in overbought territory. Watch for exhaustion or short setups.
Z < -2 → Momentum is deeply oversold. Look for reversal confirmation or long opportunities.
These zones often precede snap-back moves , especially in range-bound or corrective markets .
🎯 Combine Z-Score extremes with:
Candlestick confirmation
Support/resistance zones
Volume or price divergence
Other mean reversion tools (e.g., RSI, Bollinger Bands)
Unlike the raw MACD, this version delivers statistical thresholds , not guesswork — helping traders make decisions rooted in probability, not emotion.
📢 Trade Smart. Trade Vigilantly.
Published by VolumeVigilante

Ehlers Reverse EMAOverview
The Ehlers Reverse EMA is an advanced momentum indicator designed by John Ehlers and implemented here with additional features for improved trading decision-making. This indicator helps identify trend direction, potential reversals, and generates precise buy/sell signals based on multiple confirmation methods.
What Makes It Unique
Unlike conventional EMAs, the Ehlers Reverse EMA uses a sophisticated reverse-engineering approach to provide smoother, more responsive signals with reduced lag. The indicator combines a proprietary EMA calculation with optional moving average confirmation to filter out market noise and highlight meaningful price movements.
Features
Dynamic Color Coding: Green when momentum is positive, red when negative
Moving Average Overlay: Optional MA with selectable types (SMA, EMA, WMA, VWMA)
Multiple Signal Generation Methods:
Zero-Line Crossovers: Signals when momentum shifts from positive to negative or vice versa
MA Crossovers: Signals when the Ehlers EMA crosses its own moving average
Combined Confirmation: Requires both zero-line and MA crossovers for highest probability signals
On-Chart Signal Visualization: Clear buy/sell arrows directly on the price chart
Customizable Parameters: Adjust alpha value, MA type, and signal generation to suit your trading style
How To Use
Add the main "Ehlers Reverse EMA" indicator to your chart
Add the companion "EREMA Signals" indicator to display buy/sell signals on the price chart
Ensure both indicators have matching settings for consistency
Signal Interpretation
Buy Signals (Green Triangles): Appear below price bars when conditions are met
Sell Signals (Red Triangles): Appear above price bars when conditions are met
Recommended Timeframes
Works well on all timeframes from 5-minute to daily charts. For swing trading, 4H or daily timeframes often provide the most reliable signals.
Strategy Applications
Trend Following: Use zero-line crossovers to enter with the trend
Momentum Trading: Use MA crossovers for entry and exit points
Confirmation Tool: Combine with price action or other indicators for higher-probability trades
Divergence Analysis: Compare indicator movement with price action to spot potential reversals
Parameter Settings
Alpha (Default: 0.1): Lower values create smoother lines but more lag; higher values increase responsiveness but may increase false signals
MA Length (Default: 14): Adjust based on your trading timeframe and style
This versatile indicator helps identify high-probability trading opportunities while filtering out market noise, making it valuable for both novice and experienced traders alike.

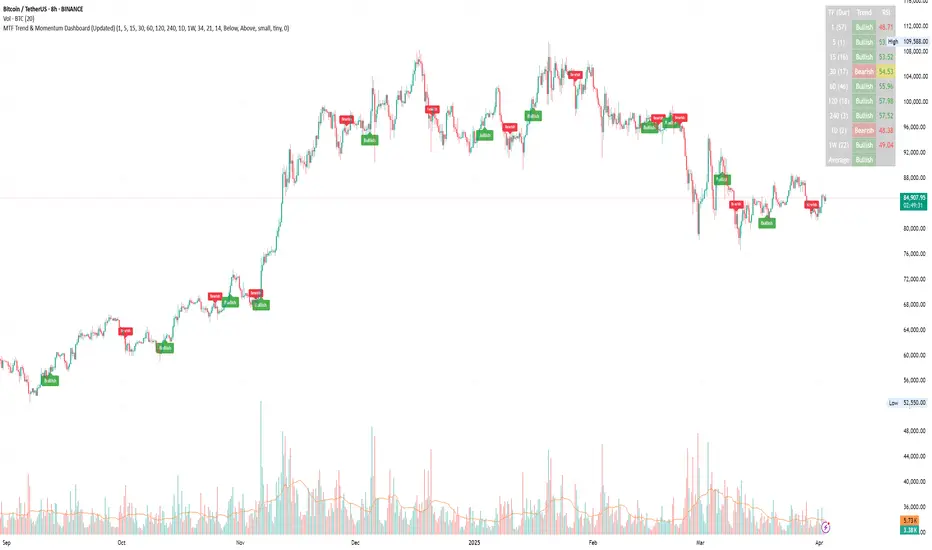
Multi-timeframe Trend & Momentum DashboardMulti-Timeframe Trend & Momentum Dashboard
This indicator is a comprehensive multi-timeframe analysis tool designed for traders who want to quickly assess market trends and momentum across several timeframes. It combines trend detection with duration tracking and displays key information in an easy-to-read on-chart table. Key features include:
Multi-Timeframe Analysis:
Analyzes nine different timeframes (from 1-minute up to 1-week) simultaneously, helping you gauge the overall market trend at a glance.
Trend Detection & Duration:
Uses a combination of a short-term EMA and a long-term SMA to determine whether the market is bullish, bearish, or neutral. It also tracks how long the current trend has persisted in terms of consecutive bars and displays this duration next to each timeframe.
RSI Display & Visual Alerts:
Calculates the RSI for each timeframe. RSI values are color-coded—green when above 50 (indicating bullish momentum) and red when below 50 (indicating bearish conditions). Additionally, if the market is bearish on a particular timeframe while the RSI is above 50, the RSI cell flashes yellow to alert you of a potential trend reversal or divergence.
On-Chart Trend Start Markers:
When a new trend is detected on your current chart’s timeframe, the indicator automatically marks the bar with a label showing the new trend direction, providing a clear visual cue for trend changes.
This powerful tool is perfect for traders looking to combine multi-timeframe trend analysis with momentum indicators, enabling a more informed and dynamic trading strategy. Whether you’re a day trader or swing trader, the Multi-Timeframe Trend & Momentum Dashboard brings clarity to market conditions across multiple time horizons.
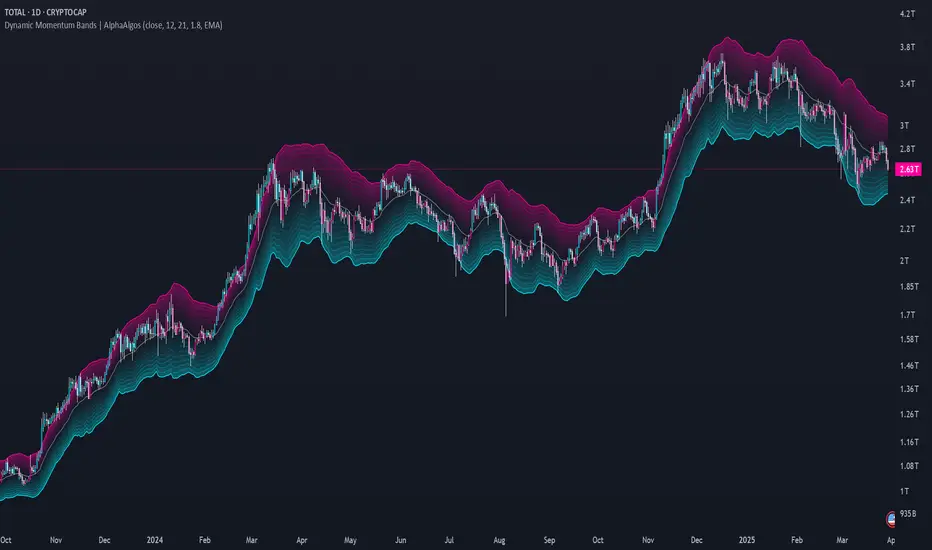
Dynamic Momentum Bands | AlphaAlgosDynamic Momentum Bands | AlphaAlgos
Overview
The Dynamic Momentum Bands indicator is an advanced technical analysis tool that combines multiple analytical techniques to provide a comprehensive view of market momentum and trend dynamics. By integrating RSI (Relative Strength Index), volatility analysis, and adaptive moving averages, this indicator offers traders a nuanced perspective on market conditions.
Key Features
Adaptive band calculation based on price momentum
Integrated RSI-driven volatility scaling
Multiple moving average type options (EMA, SMA, VWMA)
Smooth, gradient-based band visualization
Optional price bar coloring for trend identification
Technical Methodology
The indicator employs a sophisticated approach to market analysis:
1. Momentum Calculation
Calculates RSI using a customizable length
Uses RSI to dynamically adjust band volatility
Scales band width based on distance from the 50 RSI level
2. Band Construction
Applies a selected moving average type to the price source
Calculates deviation using ATR (Average True Range)
Smooths band edges for improved visual clarity
Configuration Options
Core Settings:
Price Source: Choose the price data used for calculations
RSI Length: Customize the RSI calculation period (1-50)
Band Length: Adjust the moving average period (5-100)
Volatility Multiplier: Fine-tune band width
Band Type: Select between EMA, SMA, and VWMA
Visual Settings:
Bar Coloring: Toggle color-coded price bars
Gradient-based band visualization
Smooth color transitions for trend representation
Trend Identification
The indicator provides trend insights through:
Color-coded bands (blue for bullish, pink for bearish)
Smooth gradient visualization
Optional price bar coloring
Trading Applications
Trend Following:
- Use band position relative to price as trend indicator
- Identify momentum shifts through color changes
- Utilize gradient zones for trend strength assessment
Volatility Analysis:
Observe band width changes
Detect potential breakout or consolidation periods
Use RSI-driven volatility scaling for market context
Best Practices
Adjust RSI length to match trading timeframe
Experiment with different moving average types
Use in conjunction with other technical indicators
Consider volatility multiplier for different market conditions
This indicator is provided for informational purposes only. Always use proper risk management when trading. Past performance is not indicative of future results. Not financial Advise
Aggregated Spot vs Perp Volume (% Change)Aggregated Spot vs Perp Volume (% Change)
Description
The "Aggregated Spot vs Perp Volume (% Change)" indicator helps crypto traders compare the momentum of spot and perpetual futures (perp) trading volumes across 12 major exchanges. It calculates the percentage change in volume from one bar to the next, highlighting divergences and showing which market—spot or perp—is leading a move. By focusing on relative changes, it eliminates the issue of absolute volume differences, making trends clear.
The indicator aggregates data from Binance, Bybit, OKX, Coinbase, Bitget, MEXC, Phemex, BingX, WhiteBIT, BitMEX, Kraken, and HTX. Users can toggle exchanges and choose to measure volume in coin units (e.g., BTC) or USD.
How It Works
Volume Aggregation:
Fetches spot and perp volume data for the selected crypto (e.g., BTC) from up to 12 exchanges.
Spot volume is included only if perp volume is available for the same pair, ensuring consistency.
Volume can be measured in coin units or USD (volume × spot price).
Percentage Change:
Calculates the percentage change in spot and perp volumes from the previous bar:
Percentage Change = ((Current Volume − Previous Volume) / Previous Volume) ×100
This focuses on relative momentum, making spot and perp volumes directly comparable.
Visualization:
Spot volume % change is plotted as a blue line, and perp volume % change as a red line, both with a linewidth of 1.
Who Should Use It
Crypto Traders: To understand spot vs. perp market dynamics across exchanges.
Momentum Traders: To spot which market is driving price moves via volume divergences.
Scalpers/Day Traders: For identifying short-term shifts in market activity.
Analysts: To study liquidity and sentiment in crypto markets.
How to Use It
Blue line: Spot volume % change.
Red line: Perp volume % change.
Look for divergences (e.g., a sharp rise in the red line but not the blue line suggests perp markets are leading).
Combine with Price:
Use alongside price charts to confirm trends or spot potential reversals.
Context
Spot markets reflect actual asset trading, while perp markets, with leverage, attract speculative activity and often show higher volumes. This indicator uses percentage change to compare their momentum, helping traders identify market leadership and divergences. For example, a 50% increase in both spot and perp volumes plots at the same level, making it easy to see relative shifts across exchanges.

Multi-Timeframe Stochastic RSI ArrowsMulti-Timeframe Stochastic RSI Arrows Indicator by The Venetian
Dear Moderators before you torch me alive theres nothing groundbreaking just very handy indicator for some users.
This indicator provides traders with a jet fighter-style heads-up display for market momentum across multiple timeframes. By displaying Stochastic RSI directional arrows for 12 different timeframes simultaneously, it offers a comprehensive view of market conditions without requiring multiple chart windows.
How It Works
The indicator calculates the Stochastic RSI for each of 12 common timeframes (1m to 3M) and represents directional movements with intuitive arrows:
- ▲ Green up arrow = Rising momentum
- ▼ Red down arrow = Falling momentum
- ◄► Yellow horizontal arrows = Flat/sideways momentum
- ► Gray right arrow = Just peaked (crossed above overbought)
- ◄ Gray left arrow = Just bottomed (crossed below oversold)
Each timeframe's status appears with its label (e.g., "1m ▲") in a clean, vertically-stacked display using ATR-based spacing to maintain consistent visual appearance regardless of price scale.
Key Features
- ATR-Based Spacing : Uses Average True Range to maintain consistent distances between labels even as chart scale changes
- Multi-Timeframe Analysis: Easily spot divergences and confluences across timeframes (1m, 3m, 5m, 15m, 30m, 1h, 2h, 4h, 1D, 1W, 1M, 3M)
- Sensitivity Control: Adjust flat detection sensitivity to filter out noise
- Customisable Appearance: Modify arrow size, vertical spacing, and show/hide timeframe labels
- Overbought/Oversold Detection: Highlights when momentum has peaked or bottomed at extreme levels
- Trading Applications
- Trend Alignment: Quickly identify when multiple timeframes align in the same direction
- Divergence Detection: Spot when shorter timeframes begin to shift against longer ones
- Entry/Exit Timing: Use crossovers of significant timeframes as potential signals
- Market Context: Maintain awareness of the bigger picture while trading shorter timeframes
This indicator doesn't break new ground technically but excels in presenting complex multi-timeframe information in a clean, actionable format — much like a pilot's heads-up display provides critical information at a glance. The ATR-based positioning ensures consistent visibility across different instruments and market conditions.
Great effort has been made for this script to adhere to TradingView's Pine Script house rules and focuses on trader usability rather than introducing novel technical concepts.

Chaikin Money Flow with EnhancementsThis enhanced version of the Chaikin Money Flow (CMF) indicator is designed to help traders better understand market sentiment by visualizing momentum shifts and trends based on volume-weighted accumulation and distribution.
CMF Calculation: The CMF line is calculated using the typical CMF formula, which compares the close price to the high/low range, weighted by volume.
Fading Color Zones: Green and red fading zones are added between the CMF line and the zero line. Green represents bullish momentum (CMF above zero), and red represents bearish momentum (CMF below zero). These zones highlight key shifts in market sentiment.
Cross Detection: The indicator detects when the CMF crosses above or below the zero line, signaling potential trend changes. The price and CMF values at the time of the cross are stored and can be used for further analysis.
Average Line: A configurable moving average of the CMF is plotted to provide a smoothed trendline, helping traders identify the overall direction of market sentiment.
This indicator is ideal for traders who want to enhance their technical analysis by incorporating volume-weighted momentum indicators and identifying trend reversals more clearly.

Quantum Momentum FusionPurpose of the Indicator
"Quantum Momentum Fusion" aims to combine the strengths of RSI (Relative Strength Index) and Williams %R to create a hybrid momentum indicator tailored for volatile markets like crypto:
RSI: Measures the strength of price changes, great for understanding trend stability but can sometimes lag.
Williams %R: Assesses the position of the price relative to the highest and lowest levels over a period, offering faster responses but sensitive to noise.
Combination: By blending these two indicators with a weighted average (default 50%-50%), we achieve both speed and reliability.
Additionally, we use the indicator’s own SMA (Simple Moving Average) crossovers to filter out noise and generate more meaningful signals. The goal is to craft a simple yet effective tool, especially for short-term trading like scalping.
How Signals Are Generated
The indicator produces signals as follows:
Calculations:
RSI: Standard 14-period RSI based on closing prices.
Williams %R: Calculated over 14 periods using the highest high and lowest low, then normalized to a 0-100 scale.
Quantum Fusion: A weighted average of RSI and Williams %R (e.g., 50% RSI + 50% Williams %R).
Fusion SMA: 5-period Simple Moving Average of Quantum Fusion.
Signal Conditions:
Overbought Signal (Red Background):
Quantum Fusion crosses below Fusion SMA (indicating weakening momentum).
And Quantum Fusion is above 70 (in the overbought zone).
This is a sell signal.
Oversold Signal (Green Background):
Quantum Fusion crosses above Fusion SMA (indicating strengthening momentum).
And Quantum Fusion is below 30 (in the oversold zone).
This is a buy signal.
Filtering:
The background only changes color during crossovers, reducing “fake” signals.
The 70 and 30 thresholds ensure signals trigger only in extreme conditions.
On the chart:
Purple line: Quantum Fusion.
Yellow line: Fusion SMA.
Red background: Sell signal (overbought confirmation).
Green background: Buy signal (oversold confirmation).
Overall Assessment
This indicator can be a fast-reacting tool for scalping. However:
Volatility Warning: Sudden crypto pumps/dumps can disrupt signals.
Confirmation: Pair it with price action (candlestick patterns) or another indicator (e.g., volume) for validation.
Timeframe: Works best on 1-5 minute charts.
Suggested Settings for Long Timeframes
Here’s a practical configuration for, say, a 4-hour chart:
RSI Period: 20
Williams %R Period: 20
RSI Weight: 60%
Williams %R Weight: 40% (automatically calculated as 100 - RSI Weight)
SMA Period: 15
Overbought Level: 75
Oversold Level: 25

Multi Asset & TF Stochastic
Multi Asset & TF Stochastic
This indicator allows you to compare the stochastic oscillator values of two different assets across multiple timeframes in a single pane. It’s designed for traders who want to analyse the momentum of one asset (by default, the chart’s asset) alongside a second asset of your choice (e.g., comparing EURUSD to the USD Index).
How It Works:
Main Asset:
The indicator automatically uses the chart’s asset for the primary stochastic calculation. You have the option to adjust the timeframe for this asset using a dropdown that includes TradingView’s standard timeframes, a "Chart" option (which automatically uses your chart’s timeframe), or a "Custom" option where you can type in any timeframe.
Second Asset:
You can enable the display of a second asset by toggling the “Display Second Asset” option. Choose the asset symbol (default is “DXY”) and select its timeframe from an identical dropdown. When enabled, the script calculates the stochastic oscillator for the second asset, allowing you to compare its momentum (%K and %D lines) with that of the main asset.
Stochastic Oscillator Settings:
Customize the %K length, the smoothing period for %K, and the smoothing period for %D. Both assets’ stochastic values are calculated using these parameters.
Visual Display:
The indicator plots the %K and %D lines for the main asset in prominent colours. If the second asset is enabled, its %K and %D lines are also plotted in different colours. Additionally, overbought (80) and oversold (20) levels are marked, with a midline at 50, making it easier to gauge market conditions at a glance.
%D line can be toggled off for a cleaner view if required:
Asset Information Table:
A table at the top-centre of the pane displays the active asset symbols—ensuring you always know which assets are being analysed.
How to Use:
Apply the Indicator:
Add the script to your chart. By default, it will use the chart’s current asset and timeframe for the primary stochastic oscillator.
Adjust the Main Asset Settings:
Use the “Main Asset Timeframe” dropdown to select a specific timeframe for the main asset or stick with the “Chart” option for automatic syncing with your current chart.
Enable and Configure the Second Asset (Optional):
Toggle on “Display Second Asset” if you wish to compare another asset. Select the desired symbol and adjust its timeframe using the provided dropdown. Choose “Custom” if you need a timeframe not listed by default.
Review the Plots and Table:
Observe the stochastic %K and %D lines for each asset. The overbought/oversold levels help indicate potential market turning points. Check the table at the top-centre to confirm the asset symbols being displayed.
This versatile tool is ideal for traders who rely on momentum analysis and need to quickly compare the stochastic signals of different markets or instruments. Enjoy seamless multi-asset analysis with complete control over your timeframe settings!

Cryptolabs Global Liquidity Cycle Momentum IndicatorCryptolabs Global Liquidity Cycle Momentum Indicator (LMI-BTC)
This open-source indicator combines global central bank liquidity data with Bitcoin price movements to identify medium- to long-term market cycles and momentum phases. It is designed for traders who want to incorporate macroeconomic factors into their Bitcoin analysis.
How It Works
The script calculates a Liquidity Index using balance sheet data from four central banks (USA: ECONOMICS:USCBBS, Japan: FRED:JPNASSETS, China: ECONOMICS:CNCBBS, EU: FRED:ECBASSETSW), augmented by the Dollar Index (TVC:DXY) and Chinese 10-year bond yields (TVC:CN10Y). This index is:
- Logarithmically scaled (math.log) to better represent large values like central bank balances and Bitcoin prices.
- Normalized over a 50-period range to balance fluctuations between minimum and maximum values.
- Compared to prior-year values, with the number of bars dynamically adjusted based on the timeframe (e.g., 252 for 1D, 52 for 1W), to compute percentage changes.
The liquidity change is analyzed using a Chande Momentum Oscillator (CMO) (period: 24) to measure momentum trends. A Weighted Moving Average (WMA) (period: 10) acts as a signal line. The Bitcoin price is also plotted logarithmically to highlight parallels with liquidity cycles.
Usage
Traders can use the indicator to:
- Identify global liquidity cycles influencing Bitcoin price trends, such as expansive or restrictive monetary policies.
- Detect momentum phases: Values above 50 suggest overbought conditions, below -50 indicate oversold conditions.
- Anticipate trend reversals by observing CMO crossovers with the signal line.
It performs best on higher timeframes like daily (1D) or weekly (1W) charts. The visualization includes:
- CMO line (green > 50, red < -50, blue neutral), signal line (white), Bitcoin price (gray).
- Horizontal lines at 50, 0, and -50 for improved readability.
Originality
This indicator stands out from other momentum tools like RSI or basic price analysis due to:
- Unique Data Integration: Combines four central bank datasets, DXY, and CN10Y as macroeconomic proxies for Bitcoin.
- Dynamic Prior-Year Analysis: Calculates liquidity changes relative to historical values, adjustable by timeframe.
- Logarithmic Normalization: Enhances visibility of extreme values, critical for cryptocurrencies and macro data.
This combination offers a rare perspective on the interplay between global liquidity and Bitcoin, unavailable in other open-source scripts.
Settings
- CMO Period: Default 24, adjustable for faster/slower signals.
- Signal WMA: Default 10, for smoothing the CMO line.
- Normalization Window: Default 50 periods, customizable.
Users can modify these parameters in the Pine Editor to tailor the indicator to their strategy.
Note
This script is designed for medium- to long-term analysis, not scalping. For optimal results, combine it with additional analyses (e.g., on-chain data, support/resistance levels). It does not guarantee profits but supports informed decisions based on macroeconomic trends.
Data Sources
- Bitcoin: INDEX:BTCUSD
- Liquidity: ECONOMICS:USCBBS, FRED:JPNASSETS, ECONOMICS:CNCBBS, FRED:ECBASSETSW
- Additional: TVC:DXY, TVC:CN10Y

Candle Momentum ExhaustionCandle Momentum Exhaustion
The Candle Momentum Exhaustion indicator is designed to help traders spot potential turning points in a trend by identifying when the prevailing momentum may be “running on empty.” The indicator works by comparing the size of each candle’s body (the absolute difference between the open and close) to the average body size over a recent period. When a candle’s body exceeds a user‐defined multiple of this average, it is flagged as an “exhaustion” candle.
• A bullish exhaustion (shown with a red down–facing triangle above the bar) occurs when a very large bullish candle (close > open) is detected, suggesting that buyers may have pushed the price too far and the rally could be near its end.
• A bearish exhaustion (shown with a green up–facing triangle below the bar) occurs when a very large bearish candle (close < open) is detected, implying that selling pressure might be overdone.
These signals can alert you to a potential reversal or consolidation point. The script also includes alert conditions so that you can set up notifications whenever an exhaustion signal is generated.
How It Works
1. Average Candle Body:
The script computes a simple moving average (SMA) of the absolute candle bodies over a user-defined period (default is 14 bars).
2. Exhaustion Candidate:
A candle is flagged as an exhaustion candidate if its body size exceeds the average by more than the set multiplier (default is 2.0).
3. Signal Identification:
• If the exhaustion candle is bullish (close > open), it is marked with a red down–facing triangle above the bar.
• If it is bearish (close < open), it is marked with a green up–facing triangle below the bar.
4. Alerts:
The built-in alertcondition() calls allow you to set alerts (via TradingView’s alert system) so that you can be notified when an exhaustion event occurs.
Risk Disclaimer:
This indicator is provided for educational and informational purposes only and does not constitute financial, investment, or trading advice. Trading and investing involve significant risk, and you should not rely solely on this indicator when making any trading decisions. Past performance is not indicative of future results. Always perform your own due diligence and consult with a qualified financial advisor before making any financial decisions. The creator of this indicator shall not be held responsible for any losses incurred through its use.

SatoshiSteps Swing StrategyCore Components:
The indicator combines three popular technical analysis tools:
Ichimoku Cloud: This helps identify the trend, support, and resistance levels.
RSI (Relative Strength Index): This momentum oscillator identifies overbought and oversold conditions.
MACD (Moving Average Convergence Divergence): This trend-following momentum indicator shows the relationship between two moving averages1 of prices.
Logic:
The strategy aims to identify potential swing trading opportunities by combining signals from these three components. It essentially looks for:
Trend Confirmation (Ichimoku):
Price should be above the Ichimoku cloud for buy signals.
Price should be below the Ichimoku cloud for sell signals.
The Tenkan-sen (conversion line) should cross above the Kijun-sen (base line) for buy signals.
The Tenkan-sen should cross below the Kijun-sen for sell signals.
Overbought/Oversold Conditions (RSI):
RSI should be below the overbought level for buy signals (avoiding buying when the market is potentially overextended).
RSI should be above the oversold level for sell signals (avoiding selling when the market is potentially oversold).
Momentum Confirmation (MACD):
The MACD line should be above the signal line for buy signals (indicating upward momentum).
The MACD line should be below the signal line for sell signals (indicating downward momentum).
Buy Signal:
A buy signal is generated when all the following conditions are met:
The Tenkan-sen crosses above the Kijun-sen.
The price is above both the Senkou Span A and Senkou Span B (the cloud).
The RSI is below the overbought level.
The MACD line is above the signal line.
Sell Signal:
A sell signal is generated when all the following conditions are met:
The Tenkan-sen crosses below the Kijun-sen.
The price is below both the Senkou Span A and Senkou Span B (the cloud).
The RSI is above the oversold level.
The MACD line is below the signal line.
Key Considerations:
Time Frame: The indicator has built-in adjustments for 1-hour and 4-hour timeframes, optimizing the parameters for each.
Customization: You can customize the overbought/oversold RSI levels and the styles of the buy/sell signals (triangle, label, arrow, circle) through the indicator's settings.
Accuracy: While the strategy combines multiple indicators to improve accuracy, remember that no trading indicator is perfect. Market conditions can change rapidly, and false signals can occur.
Risk Management: Always use proper risk management techniques, such as stop-loss orders, and never risk more than you can afford to lose.

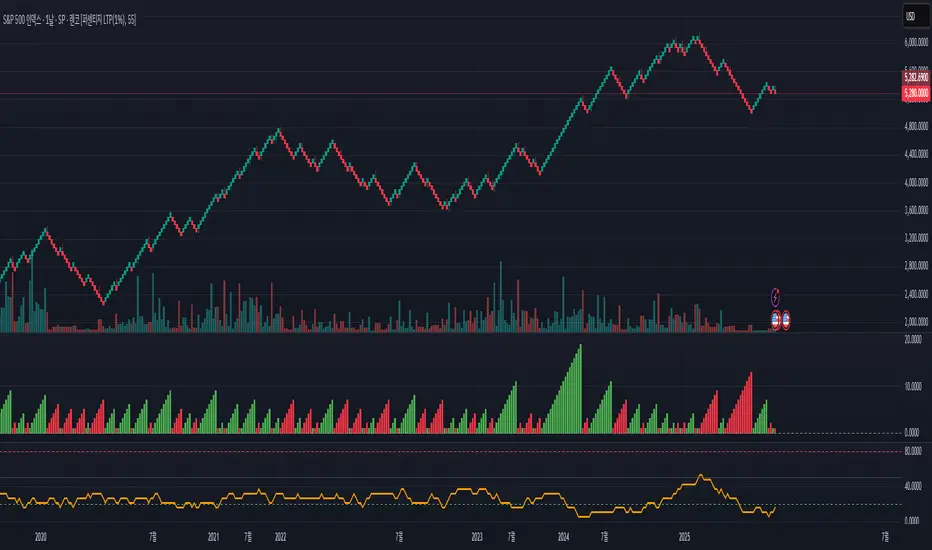
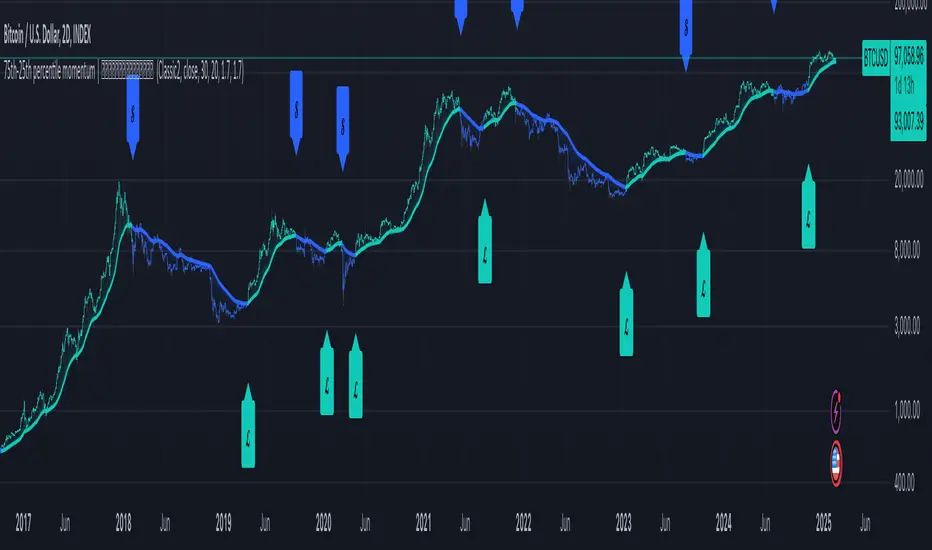
75th-25th Percentile Momentum | QuantumResearchIntroducing QuantumResearch’s 75th-25th Percentile Momentum Indicator
The 75th-25th Percentile Momentum indicator is a cutting-edge tool that combines percentile rank analysis with ATR-based deviation to detect significant bullish and bearish momentum in the market. By analyzing price movements relative to the 75th and 25th percentiles of recent data, the indicator provides traders with clear and dynamic signals for long and short opportunities.
How It Works
Percentile Analysis:
The 75th and 25th percentiles are calculated over a user-defined lookback period, representing the upper and lower thresholds for price action.
ATR-Based Adjustment:
ATR (Average True Range) is used to account for market volatility, dynamically adjusting the thresholds with user-defined multipliers.
Signal Generation:
Long Signal: Triggered when the price exceeds the 75th percentile plus the ATR-based adjustment (default multiplier: 1.3).
Short Signal: Triggered when the price falls below the 25th percentile minus the ATR-based adjustment (default multiplier: 1.3).
Visual Representation
The indicator offers a clear and customizable visual interface:
Green Bars: Indicate a bullish trend, signaling a potential long opportunity when the price surpasses the adjusted 75th percentile.
Red Bars: Indicate a bearish trend, signaling a potential short opportunity when the price drops below the adjusted 25th percentile.
Additional visuals include:
A dynamically colored 54-period EMA line, representing trend direction:
Green Line: Indicates a bullish trend.
Red Line: Indicates a bearish trend.
A filled area between the EMA line and the midpoint (HL2), offering enhanced trend visibility.
Customization & Parameters
The 75th-25th Percentile Momentum indicator includes several adjustable parameters to suit different trading styles:
Source: Defines the input price (default: close).
Percentile Length: Default set to 25, determines the lookback period for percentile calculations.
ATR Length: Default set to 14, adjusts the sensitivity of volatility measurement.
Multiplier for 75th Percentile: Default set to 1.3, adjusts the threshold for long signals.
Multiplier for 25th Percentile: Default set to 1.3, adjusts the threshold for short signals.
Color Modes: Choose from eight visual themes to personalize the appearance of trend signals.
Trading Applications
This indicator is versatile and can be applied across various markets and strategies:
Momentum Trading: Highlights when price action demonstrates strong upward or downward momentum relative to recent percentiles.
Volatility-Adaptive Strategies: By incorporating ATR-based thresholds, the indicator adjusts dynamically to market conditions.
Reversal Detection: Identifies potential turning points when the price moves significantly beyond the 75th or 25th percentiles.
Final Note
QuantumResearch’s 75th-25th Percentile Momentum indicator is a powerful tool for traders looking to capture momentum and trend opportunities in the market.
Its combination of percentile analysis, volatility adjustment, and visual clarity offers a robust framework for making informed trading decisions. As with all indicators, it is recommended to backtest thoroughly and integrate this tool into a comprehensive trading strategy.
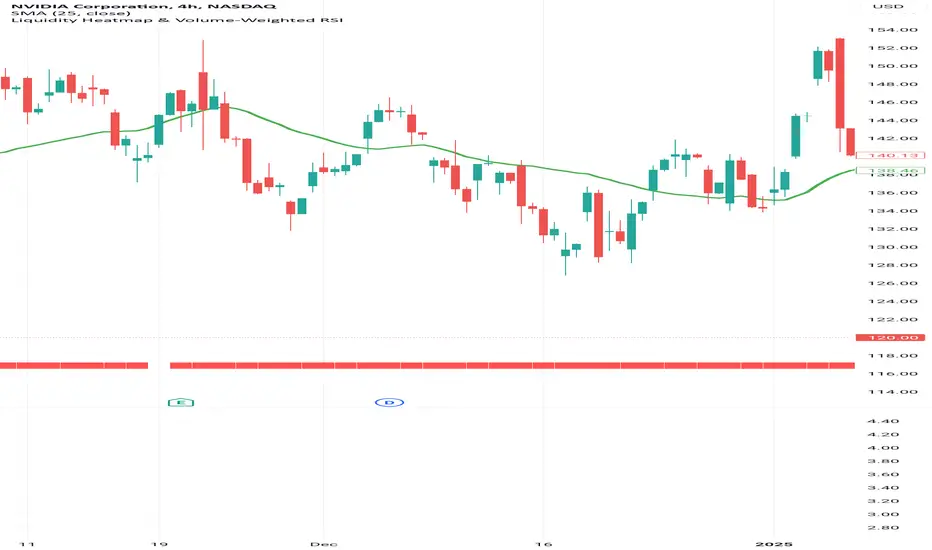
Liquidity Heatmap & Volume-Weighted RSILiquidity Heatmap Indicator with Volume-Weighted RSI
Description:
The Liquidity Heatmap Indicator with Volume-Weighted RSI (VW-RSI) is a powerful tool designed for traders to visualize market liquidity zones while integrating a volume-adjusted momentum oscillator. This indicator provides a dynamic heatmap of liquidity levels across various price points and enhances traditional RSI by incorporating volume weight, making it more responsive to market activity.
Key Features:
Liquidity Heatmap Visualization: Identifies high-liquidity price zones, allowing traders to spot potential areas of support, resistance, and accumulation.
Volume-Weighted RSI (VW-RSI): Enhances the RSI by factoring in trading volume, reducing false signals and improving trend confirmation.
Customizable Sensitivity: Users can adjust parameters to fine-tune heatmap intensity and RSI smoothing.
Dynamic Market Insights: Helps identify potential price reversals and trend strength by combining liquidity depth with momentum analysis.
How to Use:
1. Identify Liquidity Zones: The heatmap colors indicate areas of high and low liquidity, helping traders pinpoint key price action areas.
2. Use VW-RSI for Confirmation: When VW-RSI diverges from price near a liquidity cluster, it signals a potential reversal or continuation.
3. Adjust Parameters: Fine-tune the RSI period, volume weighting, and heatmap sensitivity to align with different trading strategies.
This indicator is ideal for traders who rely on order flow analysis, volume-based momentum strategies, and liquidity-driven trading techniques.
OBV TSI IndicatorThe OBV TSI Indicator combines two powerful technical analysis tools: the On-Balance Volume (OBV) and the True Strength Index (TSI). This hybrid approach provides insights into both volume dynamics and momentum, helping traders identify potential trend reversals, breakouts, or continuations with greater accuracy.
The OBV TSI Indicator tracks cumulative volume shifts via OBV and integrates the TSI for momentum analysis. It offers customizable moving average options for further smoothing. Visual trendlines, pivot points, and signal markers enhance clarity.
The OBV tracks volume flow by summing volumes based on price changes. Positive volume is added when prices rise, and negative volume is subtracted when prices fall. The result is smoothed to detect meaningful trends in volume. A volume spread is derived from the difference between the smoothed OBV and cumulative volume. This is then adjusted by the price deviation to generate the shadow spread, which highlights critical volume-driven price levels.
The shadow spread is added to either the high or low price, depending on its sign, producing a refined OBV output. This serves as the main source for the subsequent TSI calculation. The TSI is a momentum oscillator calculated using double-smoothed price changes. It provides an accurate measure of trend strength and direction.
Various moving average options, such as EMA, DEMA, or TEMA, are applied to the smoothed OBV for additional trend filtering. Users can select their preferred type and length to suit their trading strategy. Trendlines are plotted to visualize the overall direction. When a significant change in trend is detected, up or down arrows indicate potential buy or sell signals. The script identifies key pivot points based on the highest and lowest levels within a defined period. These pivots help pinpoint reversal zones.
The indicator offers customization options, allowing users to adjust the OBV length for smoothing, choose from various moving average types, and fine-tune the short, long, and signal periods for TSI. Additionally, users can toggle visibility for trendlines, signals, and pivots to suit their preferences.
This indicator is ideal for practical use cases such as spotting potential trend reversals by observing TSI crossovers and pivot levels, anticipating breakouts from key price levels using the shadow spread, and validating trends by aligning TSI signals with OBV and moving averages.
The OBV TSI Indicator is a versatile tool designed to enhance decision-making in trading by combining volume and momentum analysis. Its flexibility and visual aids make it suitable for traders of all experience levels. By leveraging its insights, you can confidently navigate market trends and improve your trading outcomes.

Custom RSI & MACD Momentum Entry SignalsIndicator Explanation: Custom RSI & MACD Momentum Entry Signals
Introduction
The "Custom RSI & MACD Momentum Entry Signals" indicator combines the Relative Strength Index (RSI) and the Moving Average Convergence Divergence (MACD) to generate precise long and short entry signals. This indicator offers a powerful combination of overbought/oversold zones, momentum analysis, and RSI-EMA crossovers to assist traders in making better decisions.
How the Indicator Works
1. RSI Calculation and EMA
The RSI is calculated based on the closing price with an adjustable period (default: 14).
An Exponential Moving Average (EMA) of the RSI (default: 9) is plotted to identify RSI trend changes.
When the RSI crosses its EMA upwards, it signals a bullish impulse. Conversely, a downward cross indicates a bearish impulse.
2. MACD Calculation and Momentum Shifts
The MACD line is derived from the difference between a fast EMA (default: 12) and a slow EMA (default: 26).
The Signal line is the EMA of the MACD line (default: 9).
The MACD histogram represents the difference between the MACD line and the Signal line.
Momentum shifts are detected as follows:
Weakening Bearish: Histogram is negative but increasing (less bearish pressure).
Strengthening Bullish: Histogram is positive and rising.
Weakening Bullish: Histogram is positive but decreasing.
Strengthening Bearish: Histogram is negative and falling.
Signal Generation
Long Signals
A Long signal is triggered when all of the following conditions are met:
The RSI was previously below 30 (oversold condition).
MACD momentum shifts from "strengthening bearish" to "weakening bearish" or turns bullish.
The RSI crosses its EMA upwards.
A green upward arrow is displayed below the bar, and the background is lightly shaded green for additional visualization.
Short Signals
A Short signal is triggered when all of the following conditions are met:
The RSI was previously above 70 (overbought condition).
MACD momentum shifts from "strengthening bullish" to "weakening bullish" or turns bearish.
The RSI crosses its EMA downwards.
A red downward arrow is displayed above the bar, and the background is lightly shaded red for additional visualization.
Visual Elements
RSI and EMA:
The RSI is shown in purple.
The RSI EMA is shown in blue.
Horizontal lines at 30 (oversold) and 70 (overbought) provide additional context.
MACD:
The MACD line is displayed in blue.
The Signal line is displayed in orange.
The zero line is added for easier interpretation.
Signals:
Green arrows: Long signals.
Red arrows: Short signals.
Background color: Light green for long conditions, light red for short conditions.
Use Cases
This indicator is ideal for:
Trend Followers: Combining RSI and MACD allows traders to identify entry points during impulsive trend shifts.
Swing Traders: Long and short signals can be used at reversal points to capture short-term price movements.
Momentum Traders: By considering MACD momentum, the indicator provides additional confidence in signal generation.
Customizable Settings
The indicator provides flexible input options:
RSI Period (default: 14)
RSI EMA Period (default: 9)
MACD Parameters: Fast, slow, and signal EMAs can be adjusted.
Conclusion
The Custom RSI & MACD Momentum Entry Signals indicator is a powerful tool for traders looking to combine RSI and MACD to identify high-probability entry signals. With clear visualization and precise signal generation, traders can make decisions more efficiently and capitalize on market movements.

Simplified Momentum ScoreIndicator Name: Simplified Momentum Score
Description:
The Simplified Momentum Score indicator calculates the normalized price momentum of an asset over a user-defined period (e.g., 30 days). It provides a single actionable score between 0 and 1, making it easy to compare the relative strength of different tokens or assets:
1: Strongest momentum (best performer).
0: Weakest momentum (worst performer).
How to Use:
Apply this indicator to any chart in TradingView.
Use the normalized score to rank tokens or assets:
Closer to 1: Indicates strong recent price performance.
Closer to 0: Indicates weak recent price performance.
Customize the momentum period to match your trading strategy.
This tool is ideal for quick comparative analysis of multiple tokens to identify top-performing assets. Keep it simple, actionable, and effective! 🚀

Relative Momentum StrengthThe Relative Momentum Strength (RMS) indicator is designed to help traders and investors identify tokens with the strongest momentum over two customizable timeframes. It calculates and plots the percentage price change over 30-day and 90-day periods (or user-defined periods) to evaluate a token's relative performance.
30-Day Momentum (Green Line): Short-term price momentum, highlighting recent trends and movements.
90-Day Momentum (Blue Line): Medium-term price momentum, providing insights into broader trends.
This tool is ideal for comparing multiple tokens or assets to identify those showing consistent strength or weakness. Use it to spot outperformers and potential reversals in a competitive universe of assets.
How to Use:
Apply this indicator to your TradingView chart for any token or asset.
Look for tokens with consistently high positive momentum for potential strength.
Use the plotted values to compare relative performance across your watchlist.
Customization:
Adjust the momentum periods to suit your trading strategy.
Overlay it with other indicators like RSI or volume for deeper analysis.

Dual Timeframe Stochastic Momentum Index w/buy sell signalsThis indicator combines momentum analysis across two timeframes to identify high-probability trading opportunities. It plots the Stochastic Momentum Index (SMI) for both the chart timeframe and a higher timeframe (default 10 minutes) to help traders align with the broader market trend.
Key Features
Displays SMI and its EMA for both timeframes
Background shading indicates favorable trading conditions
Signal dots mark potential entry points
Customizable parameters for fine-tuning
Signals Explained
Bullish Signals (Green Dots)
Appear when the chart timeframe SMI crosses above its EMA
Only trigger during periods when the higher timeframe shows:
SMI is above its EMA (increasing momentum)
SMI is between -40 and +40 (not overbought/oversold)
Bearish Signals (Red Dots)
Appear when the chart timeframe SMI crosses below its EMA
Only trigger during periods when the higher timeframe shows:
SMI is below its EMA (decreasing momentum)
SMI is between -40 and +40 (not overbought/oversold)
Settings
%K Length: Lookback period for SMI calculation (default: 10)
%D Length: Smoothing period for primary calculation (default: 3)
EMA Length: Smoothing period for signal line (default: 3)
Alternative Timeframe: Higher timeframe for trend analysis (default: 10 minutes)
Best Practices
Use higher timeframe signals to determine market bias
Wait for signal dots in the chart timeframe for entry timing
Avoid trades when higher timeframe SMI is in extreme zones (above 40 or below -40)
Consider additional confirmation from price action or other indicators
Note: This indicator combines trend and momentum analysis but should be used as part of a complete trading strategy that includes proper risk management.
Inner Bar Strength (IBS)Inner Bar Strength (IBS) Indicator
The Inner Bar Strength (IBS) indicator is a technical analysis tool designed to measure the position of the closing price relative to the day's price range. It provides insights into market sentiment by indicating where the close occurs within the high and low of a specific timeframe. The IBS value ranges from 0 to 1, where values near 1 suggest bullish momentum (close near the high), and values near 0 indicate bearish momentum (close near the low).
How It Works
The IBS is calculated using the following formula:
IBS = (Close−Low) / (High−Low)
IBS = (High−Low) / (Close−Low)
Close: Closing price of the selected timeframe.
Low: Lowest price of the selected timeframe.
High: Highest price of the selected timeframe.
The indicator allows you to select the timeframe for calculation (default is daily), providing flexibility to analyze different periods based on your trading strategy.
Key Features
Inner Bar Strength (IBS) Indicator
The Inner Bar Strength (IBS) indicator is a technical analysis tool designed to measure the position of the closing price relative to the day's price range. It provides insights into market sentiment by indicating where the close occurs within the high and low of a specific timeframe. The IBS value ranges from 0 to 1, where values near 1 suggest bullish momentum (close near the high), and values near 0 indicate bearish momentum (close near the low).
How It Works
The IBS is calculated using the following formula:
IBS=Close−LowHigh−Low
IBS=High−LowClose−Low
Close: Closing price of the selected timeframe.
Low: Lowest price of the selected timeframe.
High: Highest price of the selected timeframe.
The indicator allows you to select the timeframe for calculation (default is daily), providing flexibility to analyze different periods based on your trading strategy.
Key Features
Timeframe Selection: Customize the timeframe to daily, weekly, monthly, or any other period that suits your analysis.
Adjustable Thresholds: Input fields for upper and lower thresholds (defaulted at 0.9 and 0.1) help identify overbought and oversold conditions.
Visual Aids: Dashed horizontal lines at the threshold levels make it easy to visualize critical levels on the chart.
How to Use the IBS Indicator
When the IBS value exceeds the upper threshold (e.g., 0.9), it suggests the asset is closing near its high and may be overbought.
When the IBS value falls below the lower threshold (e.g., 0.1), it indicates the asset is closing near its low and may be oversold.
Use RSI to confirm overbought or oversold conditions identified by the IBS.
Incorporate moving averages to identify the overall trend and filter signals.
High trading volume can strengthen signals provided by the IBS.
If the price is making lower lows while the IBS is making higher lows, it may signal a potential upward reversal.
If the price is making higher highs and the IBS is making lower highs, a downward reversal might be imminent.
Conclusion
The Inner Bar Strength (IBS) indicator is a valuable tool for traders seeking to understand intraday momentum and potential reversal points. By measuring where the closing price lies within the day's range, it provides immediate insights into market sentiment. When used alongside other technical analysis tools, the IBS can enhance your trading strategy by identifying overbought or oversold conditions, confirming breakouts, and highlighting potential divergence signals.

Six PillarsGeneral Overview
The "Six Pillars" indicator is a comprehensive trading tool that combines six different technical analysis methods to provide a holistic view of market conditions.
These six pillars are:
Trend
Momentum
Directional Movement (DM)
Stochastic
Fractal
On-Balance Volume (OBV)
The indicator calculates the state of each pillar and presents them in an easy-to-read table format. It also compares the current timeframe with a user-defined comparison timeframe to offer a multi-timeframe analysis.
A key feature of this indicator is the Confluence Strength meter. This unique metric quantifies the overall agreement between the six pillars across both timeframes, providing a score out of 100. A higher score indicates stronger agreement among the pillars, suggesting a more reliable trading signal.
I also included a visual cue in the form of candle coloring. When all six pillars agree on a bullish or bearish direction, the candle is colored green or red, respectively. This feature allows traders to quickly identify potential high-probability trade setups.
The Six Pillars indicator is designed to work across multiple timeframes, offering a comparison between the current timeframe and a user-defined comparison timeframe. This multi-timeframe analysis provides traders with a more comprehensive understanding of market dynamics.
Origin and Inspiration
The Six Pillars indicator was inspired by the work of Dr. Barry Burns, author of "Trend Trading for Dummies" and his concept of "5 energies." (Trend, Momentum, Cycle, Support/Resistance, Scale) I was intrigued by Dr. Burns' approach to analyzing market dynamics and decided to put my own twist upon his ideas.
Comparing the Six Pillars to Dr. Burns' 5 energies, you'll notice I kept Trend and Momentum, but I swapped out Cycle, Support/Resistance, and Scale for Directional Movement, Stochastic, Fractal, and On-Balance Volume. These changes give you a more dynamic view of market strength, potential reversals, and volume confirmation all in one package.
What Makes This Indicator Unique
The standout feature of the Six Pillars indicator is its Confluence Strength meter. This feature calculates the overall agreement between the six pillars, providing traders with a clear, numerical representation of signal strength.
The strength is calculated by considering the state of each pillar in both the current and comparison timeframes, resulting in a score out of 100.
Here's how it calculates the strength:
It considers the state of each pillar in both the current timeframe and the comparison timeframe.
For each pillar, the absolute value of its state is taken. This means that both strongly bullish (2) and strongly bearish (-2) states contribute equally to the strength.
The absolute values for all six pillars are summed up for both timeframes, resulting in two sums: current_sum and alternate_sum.
These sums are then added together to get a total_sum.
The total_sum is divided by 24 (the maximum possible sum if all pillars were at their strongest states in both timeframes) and multiplied by 100 to get a percentage.
The result is rounded to the nearest integer and capped at a minimum of 1.
This calculation method ensures that the Confluence Strength meter takes into account not only the current timeframe but also the comparison timeframe, providing a more robust measure of overall market sentiment. The resulting score, ranging from 1 to 100, gives traders a clear and intuitive measure of how strongly the pillars agree, with higher scores indicating stronger potential signals.
This approach to measuring signal strength is unique in that it doesn't just rely on a single aspect of price action or volume. Instead, it takes into account multiple factors, providing a more robust and reliable indication of potential market moves. The higher the Confluence Strength score, the more confident traders can be in the signal.
The Confluence Strength meter helps traders in several ways:
It provides a quick and easy way to gauge the overall market sentiment.
It helps prioritize potential trades by identifying the strongest signals.
It can be used as a filter to avoid weaker setups and focus on high-probability trades.
It offers an additional layer of confirmation for other trading strategies or indicators.
By combining the Six Pillars analysis with the Confluence Strength meter, I've created a powerful tool that not only identifies potential trading opportunities but also quantifies their strength, giving traders a significant edge in their decision-making process.
How the Pillars Work (What Determines Bullish or Bearish)
While developing this indicator, I selected and configured six key components that work together to provide a comprehensive view of market conditions. Each pillar is set up to complement the others, creating a synergistic effect that offers traders a more nuanced understanding of price action and volume.
Trend Pillar: Based on two Exponential Moving Averages (EMAs) - a fast EMA (8 period) and a slow EMA (21 period). It determines the trend by comparing these EMAs, with stronger trends indicated when the fast EMA is significantly above or below the slow EMA.
Directional Movement (DM) Pillar: Utilizes the Average Directional Index (ADX) with a default period of 14. It measures trend strength, with values above 25 indicating a strong trend. It also considers the Positive and Negative Directional Indicators (DI+ and DI-) to determine trend direction.
Momentum Pillar: Uses the Moving Average Convergence Divergence (MACD) with customizable fast (12), slow (26), and signal (9) lengths. It compares the MACD line to the signal line to determine momentum strength and direction.
Stochastic Pillar: Employs the Stochastic oscillator with a default period of 13. It identifies overbought conditions (above 80) and oversold conditions (below 20), with intermediate zones between 60-80 and 20-40.
Fractal Pillar: Uses Williams' Fractal indicator with a default period of 3. It identifies potential reversal points by looking for specific high and low patterns over the given period.
On-Balance Volume (OBV) Pillar: Incorporates On-Balance Volume with three EMAs - short (3), medium (13), and long (21) periods. It assesses volume trends by comparing these EMAs.
Each pillar outputs a state ranging from -2 (strongly bearish) to 2 (strongly bullish), with 0 indicating a neutral state. This standardized output allows for easy comparison and aggregation of signals across all pillars.
Users can customize various parameters for each pillar, allowing them to fine-tune the indicator to their specific trading style and market conditions. The multi-timeframe comparison feature also allows users to compare pillar states between the current timeframe and a user-defined comparison timeframe, providing additional context for decision-making.
Design
From a design standpoint, I've put considerable effort into making the Six Pillars indicator visually appealing and user-friendly. The clean and minimalistic design is a key feature that sets this indicator apart.
I've implemented a sleek table layout that displays all the essential information in a compact and organized manner. The use of a dark background (#030712) for the table creates a sleek look that's easy on the eyes, especially during extended trading sessions.
The overall design philosophy focuses on presenting complex information in a simple, intuitive format, allowing traders to make informed decisions quickly and efficiently.
The color scheme is carefully chosen to provide clear visual cues:
White text for headers ensures readability
Green (#22C55E) for bullish signals
Blue (#3B82F6) for neutral states
Red (#EF4444) for bearish signals
This color coding extends to the candle coloring, making it easy to spot when all pillars agree on a bullish or bearish outlook.
I've also incorporated intuitive symbols (↑↑, ↑, →, ↓, ↓↓) to represent the different states of each pillar, allowing for quick interpretation at a glance.
The table layout is thoughtfully organized, with clear sections for the current and comparison timeframes. The Confluence Strength meter is prominently displayed, providing traders with an immediate sense of signal strength.
To enhance usability, I've added tooltips to various elements, offering additional information and explanations when users hover over different parts of the indicator.
How to Use This Indicator
The Six Pillars indicator is a versatile tool that can be used for various trading strategies. Here are some general usage guidelines and specific scenarios:
General Usage Guidelines:
Pay attention to the Confluence Strength meter. Higher values indicate stronger agreement among the pillars and potentially more reliable signals.
Use the multi-timeframe comparison to confirm signals across different time horizons.
Look for alignment between the current timeframe and comparison timeframe pillars for stronger signals.
One of the strengths of this indicator is it can let you know when markets are sideways – so in general you can know to avoid entering when the Confluence Strength is low, indicating disagreement among the pillars.
Customization Options
The Six Pillars indicator offers a wide range of customization options, allowing traders to tailor the tool to their specific needs and trading style. Here are the key customizable elements:
Comparison Timeframe:
Users can select any timeframe for comparison with the current timeframe, providing flexibility in multi-timeframe analysis.
Trend Pillar:
Fast EMA Period: Adjustable for quicker or slower trend identification
Slow EMA Period: Can be modified to capture longer-term trends
Momentum Pillar:
MACD Fast Length
MACD Slow Length
MACD Signal Length These can be adjusted to fine-tune momentum sensitivity
DM Pillar:
ADX Period: Customizable to change the lookback period for trend strength measurement
ADX Threshold: Adjustable to define what constitutes a strong trend
Stochastic Pillar:
Stochastic Period: Can be modified to change the sensitivity of overbought/oversold readings
Fractal Pillar:
Fractal Period: Adjustable to identify potential reversal points over different timeframes
OBV Pillar:
Short OBV EMA
Medium OBV EMA
Long OBV EMA These periods can be customized to analyze volume trends over different timeframes
These customization options allow traders to experiment with different settings to find the optimal configuration for their trading strategy and market conditions. The flexibility of the Six Pillars indicator makes it adaptable to various trading styles and market environments.

Dynamic Bollinger Bands with Momentum and Volume (DBBMV)Overview
The Dynamic Bollinger Bands with Momentum and Volume (DBBMV) indicator enhances the traditional Bollinger Bands by dynamically adjusting their width and position based on momentum and volume. This provides a more responsive and context-aware indication of price volatility and potential reversals.
Key Features
Momentum Adjusted Bands: Adjusts the bands' width based on the momentum indicator, reflecting the rate of change in price.
Volume Weighted Bands: Further adjusts the bands based on trading volume to reflect market activity and price volatility.
Signal Alerts: Provides buy and sell signals based on price action relative to the dynamic bands, helping traders identify entry and exit points.
Customizable Parameters: Allows users to adjust the lookback period, momentum sensitivity, and volume weighting for personalized analysis.
How It Works
The DBBMV indicator starts with the traditional Bollinger Bands, which are calculated using a moving average and standard deviation of the selected price source. The width of these bands is then adjusted based on the momentum of the price, making them more sensitive to price changes. Further adjustments are made based on trading volume, which ensures that the bands accurately reflect current market conditions. This results in a set of dynamic Bollinger Bands that provide more nuanced insights into price volatility and potential reversals.
Usage Instructions
Identify Volatile Periods: Use the dynamically adjusted bands to identify periods of high and low volatility in the market.
Spot Reversals: Look for buy signals when the price crosses above the lower band and sell signals when the price crosses below the upper band.
Adjust Sensitivity: Customize the lookback period, momentum sensitivity, and volume weighting to fine-tune the indicator to your specific trading strategy and market conditions.
Enhance Analysis: Combine the DBBMV indicator with other technical analysis tools for a more comprehensive market analysis.
Volume Confirmation: Use the volume-weighted adjustments to confirm the strength of price movements and potential breakouts.
The Dynamic Bollinger Bands with Momentum and Volume (DBBMV) indicator provides traders with a powerful tool to understand market dynamics better and make informed trading decisions based on adjusted volatility and market activity.
