TradFi Fundamentals: Momentum Trading with Macroeconomic DataIntroduction
This indicator combines traditional price momentum with key macroeconomic data. By retrieving GDP, inflation, unemployment, and interest rates using security calls, the script automatically adapts to the latest economic data. The goal is to blend technical analysis with fundamental insights to generate a more robust momentum signal.
Original Research Paper by Mohit Apte, B. Tech Scholar, Department of Computer Science and Engineering, COEP Technological University, Pune, India
Link to paper
Explanation
Price Momentum Calculation:
The indicator computes price momentum as the percentage change in price over a configurable lookback period (default is 50 days). This raw momentum is then normalized using a rolling simple moving average and standard deviation over a defined period (default 200 days) to ensure comparability with the economic indicators.
Fetching and Normalizing Economic Data:
Instead of manually inputting economic values, the script uses TradingView’s security function to retrieve:
GDP from ticker "GDP"
Inflation (CPI) from ticker "USCCPI"
Unemployment rate from ticker "UNRATE"
Interest rates from ticker "USINTR"
Each series is normalized over a configurable normalization period (default 200 days) by subtracting its moving average and dividing by its standard deviation. This standardization converts each economic indicator into a z-score for direct integration into the momentum score.
Combined Momentum Score:
The normalized price momentum and economic indicators are each multiplied by user-defined weights (default: 50% price momentum, 20% GDP, and 10% each for inflation, unemployment, and interest rates). The weighted components are then summed to form a comprehensive momentum score. A horizontal zero line is plotted for reference.
Trading Signals:
Buy signals are generated when the combined momentum score crosses above zero, and sell signals occur when it crosses below zero. Visual markers are added to the chart to assist with trade timing, and alert conditions are provided for automated notifications.
Settings
Price Momentum Lookback: Defines the period (in days) used to compute the raw price momentum.
Normalization Period for Price Momentum: Sets the window over which the price momentum is normalized.
Normalization Period for Economic Data: Sets the window over which each macroeconomic series is normalized.
Weights: Adjust the influence of each component (price momentum, GDP, inflation, unemployment, and interest rate) on the overall momentum score.
Conclusion
This implementation leverages TradingView’s economic data feeds to integrate real-time macroeconomic data into a momentum trading strategy. By normalizing and weighting both technical and economic inputs, the indicator offers traders a more holistic view of market conditions. The enhanced momentum signal provides additional context to traditional momentum analysis, potentially leading to more informed trading decisions and improved risk management.
The next script I release will be an improved version of this that I have added my own flavor to, improving the signals.
Cari dalam skrip untuk "momentum"

GKD-C Momentum Candles [Loxx]The Giga Kaleidoscope GKD-C Momentum Candles is a Confirmation module included in Loxx's "Giga Kaleidoscope Modularized Trading System."
█ GKD-C Momentum Candles
The Momentum Candles indicator uses the difference between the closing and opening prices divided by the Average True Range (ATR) over 50 periods to calculate momentum. It sets upper and lower thresholds based on an ATR multiplier: the upper threshold (Tresh1) is 1 divided by the ATR multiplier, and the lower threshold (Tresh2) is the negative inverse of this value. These thresholds help identify significant momentum shifts, generating long/short signals.
█ Giga Kaleidoscope Modularized Trading System
Core components of an NNFX algorithmic trading strategy
The NNFX algorithm is built on the principles of trend, momentum, and volatility. There are six core components in the NNFX trading algorithm:
1. Volatility - price volatility; e.g., Average True Range, True Range Double, Close-to-Close, etc.
2. Baseline - a moving average to identify price trend
3. Confirmation 1 - a technical indicator used to identify trends
4. Confirmation 2 - a technical indicator used to identify trends
5. Continuation - a technical indicator used to identify trends
6. Volatility/Volume - a technical indicator used to identify volatility/volume breakouts/breakdown
7. Exit - a technical indicator used to determine when a trend is exhausted
8. Metamorphosis - a technical indicator that produces a compound signal from the combination of other GKD indicators*
*(not part of the NNFX algorithm)
What is Volatility in the NNFX trading system?
In the NNFX (No Nonsense Forex) trading system, ATR (Average True Range) is typically used to measure the volatility of an asset. It is used as a part of the system to help determine the appropriate stop loss and take profit levels for a trade. ATR is calculated by taking the average of the true range values over a specified period.
True range is calculated as the maximum of the following values:
-Current high minus the current low
-Absolute value of the current high minus the previous close
-Absolute value of the current low minus the previous close
ATR is a dynamic indicator that changes with changes in volatility. As volatility increases, the value of ATR increases, and as volatility decreases, the value of ATR decreases. By using ATR in NNFX system, traders can adjust their stop loss and take profit levels according to the volatility of the asset being traded. This helps to ensure that the trade is given enough room to move, while also minimizing potential losses.
Other types of volatility include True Range Double (TRD), Close-to-Close, and Garman-Klass
What is a Baseline indicator?
The baseline is essentially a moving average, and is used to determine the overall direction of the market.
The baseline in the NNFX system is used to filter out trades that are not in line with the long-term trend of the market. The baseline is plotted on the chart along with other indicators, such as the Moving Average (MA), the Relative Strength Index (RSI), and the Average True Range (ATR).
Trades are only taken when the price is in the same direction as the baseline. For example, if the baseline is sloping upwards, only long trades are taken, and if the baseline is sloping downwards, only short trades are taken. This approach helps to ensure that trades are in line with the overall trend of the market, and reduces the risk of entering trades that are likely to fail.
By using a baseline in the NNFX system, traders can have a clear reference point for determining the overall trend of the market, and can make more informed trading decisions. The baseline helps to filter out noise and false signals, and ensures that trades are taken in the direction of the long-term trend.
What is a Confirmation indicator?
Confirmation indicators are technical indicators that are used to confirm the signals generated by primary indicators. Primary indicators are the core indicators used in the NNFX system, such as the Average True Range (ATR), the Moving Average (MA), and the Relative Strength Index (RSI).
The purpose of the confirmation indicators is to reduce false signals and improve the accuracy of the trading system. They are designed to confirm the signals generated by the primary indicators by providing additional information about the strength and direction of the trend.
Some examples of confirmation indicators that may be used in the NNFX system include the Bollinger Bands, the MACD (Moving Average Convergence Divergence), and the MACD Oscillator. These indicators can provide information about the volatility, momentum, and trend strength of the market, and can be used to confirm the signals generated by the primary indicators.
In the NNFX system, confirmation indicators are used in combination with primary indicators and other filters to create a trading system that is robust and reliable. By using multiple indicators to confirm trading signals, the system aims to reduce the risk of false signals and improve the overall profitability of the trades.
What is a Continuation indicator?
In the NNFX (No Nonsense Forex) trading system, a continuation indicator is a technical indicator that is used to confirm a current trend and predict that the trend is likely to continue in the same direction. A continuation indicator is typically used in conjunction with other indicators in the system, such as a baseline indicator, to provide a comprehensive trading strategy.
What is a Volatility/Volume indicator?
Volume indicators, such as the On Balance Volume (OBV), the Chaikin Money Flow (CMF), or the Volume Price Trend (VPT), are used to measure the amount of buying and selling activity in a market. They are based on the trading volume of the market, and can provide information about the strength of the trend. In the NNFX system, volume indicators are used to confirm trading signals generated by the Moving Average and the Relative Strength Index. Volatility indicators include Average Direction Index, Waddah Attar, and Volatility Ratio. In the NNFX trading system, volatility is a proxy for volume and vice versa.
By using volume indicators as confirmation tools, the NNFX trading system aims to reduce the risk of false signals and improve the overall profitability of trades. These indicators can provide additional information about the market that is not captured by the primary indicators, and can help traders to make more informed trading decisions. In addition, volume indicators can be used to identify potential changes in market trends and to confirm the strength of price movements.
What is an Exit indicator?
The exit indicator is used in conjunction with other indicators in the system, such as the Moving Average (MA), the Relative Strength Index (RSI), and the Average True Range (ATR), to provide a comprehensive trading strategy.
The exit indicator in the NNFX system can be any technical indicator that is deemed effective at identifying optimal exit points. Examples of exit indicators that are commonly used include the Parabolic SAR, and the Average Directional Index (ADX).
The purpose of the exit indicator is to identify when a trend is likely to reverse or when the market conditions have changed, signaling the need to exit a trade. By using an exit indicator, traders can manage their risk and prevent significant losses.
In the NNFX system, the exit indicator is used in conjunction with a stop loss and a take profit order to maximize profits and minimize losses. The stop loss order is used to limit the amount of loss that can be incurred if the trade goes against the trader, while the take profit order is used to lock in profits when the trade is moving in the trader's favor.
Overall, the use of an exit indicator in the NNFX trading system is an important component of a comprehensive trading strategy. It allows traders to manage their risk effectively and improve the profitability of their trades by exiting at the right time.
What is an Metamorphosis indicator?
The concept of a metamorphosis indicator involves the integration of two or more GKD indicators to generate a compound signal. This is achieved by evaluating the accuracy of each indicator and selecting the signal from the indicator with the highest accuracy. As an illustration, let's consider a scenario where we calculate the accuracy of 10 indicators and choose the signal from the indicator that demonstrates the highest accuracy.
The resulting output from the metamorphosis indicator can then be utilized in a GKD-BT backtest by occupying a slot that aligns with the purpose of the metamorphosis indicator. The slot can be a GKD-B, GKD-C, or GKD-E slot, depending on the specific requirements and objectives of the indicator. This allows for seamless integration and utilization of the compound signal within the GKD-BT framework.
How does Loxx's GKD (Giga Kaleidoscope Modularized Trading System) implement the NNFX algorithm outlined above?
Loxx's GKD v2.0 system has five types of modules (indicators/strategies). These modules are:
1. GKD-BT - Backtesting module (Volatility, Number 1 in the NNFX algorithm)
2. GKD-B - Baseline module (Baseline and Volatility/Volume, Numbers 1 and 2 in the NNFX algorithm)
3. GKD-C - Confirmation 1/2 and Continuation module (Confirmation 1/2 and Continuation, Numbers 3, 4, and 5 in the NNFX algorithm)
4. GKD-V - Volatility/Volume module (Confirmation 1/2, Number 6 in the NNFX algorithm)
5. GKD-E - Exit module (Exit, Number 7 in the NNFX algorithm)
6. GKD-M - Metamorphosis module (Metamorphosis, Number 8 in the NNFX algorithm, but not part of the NNFX algorithm)
(additional module types will added in future releases)
Each module interacts with every module by passing data to A backtest module wherein the various components of the GKD system are combined to create a trading signal.
That is, the Baseline indicator passes its data to Volatility/Volume. The Volatility/Volume indicator passes its values to the Confirmation 1 indicator. The Confirmation 1 indicator passes its values to the Confirmation 2 indicator. The Confirmation 2 indicator passes its values to the Continuation indicator. The Continuation indicator passes its values to the Exit indicator, and finally, the Exit indicator passes its values to the Backtest strategy.
This chaining of indicators requires that each module conform to Loxx's GKD protocol, therefore allowing for the testing of every possible combination of technical indicators that make up the six components of the NNFX algorithm.
What does the application of the GKD trading system look like?
Example trading system:
Backtest: Multi-Ticker CC Backtest
Baseline: Hull Moving Average
Volatility/Volume: Hurst Exponent
Confirmation 1: Advance Trend Pressure as shown on the chart above
Confirmation 2: uf2018
Continuation: Coppock Curve
Exit: Rex Oscillator
Metamorphosis: Baseline Optimizer
Each GKD indicator is denoted with a module identifier of either: GKD-BT, GKD-B, GKD-C, GKD-V, GKD-M, or GKD-E. This allows traders to understand to which module each indicator belongs and where each indicator fits into the GKD system.
█ Giga Kaleidoscope Modularized Trading System Signals
Standard Entry
1. GKD-C Confirmation gives signal
2. Baseline agrees
3. Price inside Goldie Locks Zone Minimum
4. Price inside Goldie Locks Zone Maximum
5. Confirmation 2 agrees
6. Volatility/Volume agrees
1-Candle Standard Entry
1a. GKD-C Confirmation gives signal
2a. Baseline agrees
3a. Price inside Goldie Locks Zone Minimum
4a. Price inside Goldie Locks Zone Maximum
Next Candle
1b. Price retraced
2b. Baseline agrees
3b. Confirmation 1 agrees
4b. Confirmation 2 agrees
5b. Volatility/Volume agrees
Baseline Entry
1. GKD-B Baseline gives signal
2. Confirmation 1 agrees
3. Price inside Goldie Locks Zone Minimum
4. Price inside Goldie Locks Zone Maximum
5. Confirmation 2 agrees
6. Volatility/Volume agrees
7. Confirmation 1 signal was less than 'Maximum Allowable PSBC Bars Back' prior
1-Candle Baseline Entry
1a. GKD-B Baseline gives signal
2a. Confirmation 1 agrees
3a. Price inside Goldie Locks Zone Minimum
4a. Price inside Goldie Locks Zone Maximum
5a. Confirmation 1 signal was less than 'Maximum Allowable PSBC Bars Back' prior
Next Candle
1b. Price retraced
2b. Baseline agrees
3b. Confirmation 1 agrees
4b. Confirmation 2 agrees
5b. Volatility/Volume agrees
Volatility/Volume Entry
1. GKD-V Volatility/Volume gives signal
2. Confirmation 1 agrees
3. Price inside Goldie Locks Zone Minimum
4. Price inside Goldie Locks Zone Maximum
5. Confirmation 2 agrees
6. Baseline agrees
7. Confirmation 1 signal was less than 7 candles prior
1-Candle Volatility/Volume Entry
1a. GKD-V Volatility/Volume gives signal
2a. Confirmation 1 agrees
3a. Price inside Goldie Locks Zone Minimum
4a. Price inside Goldie Locks Zone Maximum
5a. Confirmation 1 signal was less than 'Maximum Allowable PSVVC Bars Back' prior
Next Candle
1b. Price retraced
2b. Volatility/Volume agrees
3b. Confirmation 1 agrees
4b. Confirmation 2 agrees
5b. Baseline agrees
Confirmation 2 Entry
1. GKD-C Confirmation 2 gives signal
2. Confirmation 1 agrees
3. Price inside Goldie Locks Zone Minimum
4. Price inside Goldie Locks Zone Maximum
5. Volatility/Volume agrees
6. Baseline agrees
7. Confirmation 1 signal was less than 7 candles prior
1-Candle Confirmation 2 Entry
1a. GKD-C Confirmation 2 gives signal
2a. Confirmation 1 agrees
3a. Price inside Goldie Locks Zone Minimum
4a. Price inside Goldie Locks Zone Maximum
5a. Confirmation 1 signal was less than 'Maximum Allowable PSC2C Bars Back' prior
Next Candle
1b. Price retraced
2b. Confirmation 2 agrees
3b. Confirmation 1 agrees
4b. Volatility/Volume agrees
5b. Baseline agrees
PullBack Entry
1a. GKD-B Baseline gives signal
2a. Confirmation 1 agrees
3a. Price is beyond 1.0x Volatility of Baseline
Next Candle
1b. Price inside Goldie Locks Zone Minimum
2b. Price inside Goldie Locks Zone Maximum
3b. Confirmation 1 agrees
4b. Confirmation 2 agrees
5b. Volatility/Volume agrees
Continuation Entry
1. Standard Entry, 1-Candle Standard Entry, Baseline Entry, 1-Candle Baseline Entry, Volatility/Volume Entry, 1-Candle Volatility/Volume Entry, Confirmation 2 Entry, 1-Candle Confirmation 2 Entry, or Pullback entry triggered previously
2. Baseline hasn't crossed since entry signal trigger
4. Confirmation 1 agrees
5. Baseline agrees
6. Confirmation 2 agrees

SMI Momentum Bollinger Squeeze Signals - TradeUIMomentum Bollinger Squeeze Signals - TradeUI
The Squeeze Momentum Indicator (SMI) uses the principles of the Squeeze Indicator, which is a volatility indicator, and combines them with a momentum calculation to provide a more comprehensive view of the market.
The original Squeeze Indicator uses the relationship between the Bollinger Bands and Keltner Channels to identify periods of low volatility, known as "Squeezes", and potential breakout points. The SMI takes this one step further by adding a momentum calculation, making it a more dynamic tool for trading.
The momentum calculation is based on the rate of change of the asset's price. When the price increases rapidly, it signifies positive momentum, and when the price decreases rapidly, it signifies negative momentum.

Chiko-Span Momentum_PineScript_Version5This is Momentum indicator based on "Chiko-span" of Ichimoku Kinko-Hyo.
Differ from normal momentum indicator, this indicator is using "close" and "open" as default parameter which is based on 9 week-candle chart Invented by Ichimoku-Sanjin. And, It is located 26 period before to match chiko-span.
(Parameters can change as you like)
The usage is same as normal momentum indicator so please check momentum indicator usage. However, due to use this indicator, it may support to compare momentum of chiko-span movement and to predict effect 5 lines of ichimoku.
For example, when price break out tenkan-sen, you can measure slope or period of chiko-span momentum and compare previously chiko-span momentum. If momentum is stronger than previously price, we can think that price try to out kijun- sen, touch cloud or break out cloud.
I wish, this indicator helps ichimoku users.
Adaptive Trend & Momentum [ATM] - All-in-One Confirmation Tired of Cluttered Charts and Conflicting Signals? This All-in-One Indicator is Your Solution.
The Adaptive Trend & Momentum (ATM) indicator is a powerful, next-generation trading tool designed to eliminate chart clutter and provide clear, high-conviction signals. Instead of using multiple conflicting indicators, the ATM system combines trend, momentum, and volatility into a single, cohesive, and adaptive framework. It automatically adjusts to changing market conditions, giving you a reliable edge in any environment.
This is not just another moving average crossover. It is a complete trading system that helps you identify the trend, confirm its strength, and time your entries with precision.
Key Features
•
Adaptive Moving Average (AMA): The core of the system. The AMA automatically adjusts its length based on market volatility (using the Average True Range). It becomes faster and more responsive in volatile markets to catch moves early, and smoother in calm markets to avoid noise and false signals.
•
Dynamic Volatility Bands: These bands expand and contract based on market volatility, providing a dynamic map of support and resistance. They are crucial for identifying pullback opportunities and setting effective stop-loss levels.
•
Integrated Momentum Oscillator: A smoothed RSI-based oscillator that runs in a separate pane. It is designed to confirm the signals from the main chart. The oscillator and its histogram are color-coded to show whether bullish or bearish momentum is in control, giving you an instant read on market strength.
•
Clear Consensus Signals: The ATM indicator provides four distinct, easy-to-read signals directly on your chart:
•
STRONG BUY: The highest-conviction signal, appearing when the trend is bullish, momentum is bullish, and the price has pulled back to a strategic entry zone near the AMA.
•
BUY: A standard confirmation signal when both trend and momentum are aligned to the upside.
•
STRONG SELL: The highest-conviction short signal, appearing when the trend is bearish, momentum is bearish, and the price has rallied to a strategic entry zone.
•
SELL: A standard confirmation signal when both trend and momentum are aligned to the downside.
•
Real-Time Dashboard: A convenient on-chart table that provides a complete overview of the market at a glance. It shows the current adaptive length, trend direction, momentum status, consensus signal, and volatility percentage, so you always know what the indicator is thinking.
How It Works: The Adaptive Engine
The magic of the ATM indicator lies in its adaptive engine. Traditional moving averages use a fixed length (e.g., 50-period MA), which can be too slow in a fast market or too sensitive in a choppy one. The ATM’s Adaptive Moving Average solves this by dynamically adjusting its calculation period in real-time:
When volatility increases, the AMA shortens its length to react more quickly to price changes. When volatility decreases, it lengthens its period to smooth out noise and prevent false signals.
This adaptive nature ensures that the indicator remains relevant and effective across different assets and timeframes, from scalping to swing trading.
How to Use This Indicator: A Simple Trading Strategy
The ATM indicator is designed for clarity and ease of use. Here is a basic framework for trading with it:
For Long (Buy) Positions:
1.
Identify the Trend: Wait for the Adaptive Moving Average (AMA) line to turn green, indicating a confirmed uptrend.
2.
Confirm with Momentum: Check that the momentum oscillator is above 50 and preferably rising, confirming bullish strength.
3.
Find Your Entry: The best entry is a "STRONG BUY" signal. This tells you that the price has pulled back to a value area within the uptrend, offering a high-probability entry. A standard "BUY" signal can also be used, but the conviction is higher on "STRONG" signals.
4.
Set Your Stop-Loss: A logical place for a stop-loss is just below the lower volatility band.
5.
Take Profit: Consider taking profits when an opposing "SELL" or "STRONG SELL" signal appears, or when the price reaches a key resistance level.
For Short (Sell) Positions:
1.
Identify the Trend: Wait for the Adaptive Moving Average (AMA) line to turn red, indicating a confirmed downtrend.
2.
Confirm with Momentum: Check that the momentum oscillator is below 50 and preferably falling, confirming bearish strength.
3.
Find Your Entry: The best entry is a "STRONG SELL" signal. This indicates the price has rallied to a resistance area within the downtrend, offering a prime shorting opportunity. A standard "SELL" signal can also be used.
4.
Set Your Stop-Loss: A logical place for a stop-loss is just above the upper volatility band.
5.
Take Profit: Consider taking profits when an opposing "BUY" or "STRONG BUY" signal appears, or when the price reaches a key support level.
Customization and Settings
The indicator is fully customizable to fit your trading style and the asset you are trading. You can adjust:
•
AMA Settings: Control the base length and the volatility multiplier to make the indicator more or less sensitive.
•
Momentum Settings: Adjust the RSI length and smoothing for the oscillator.
•
Volatility Bands: Change the multiplier to widen or narrow the bands.
•
Visuals: Toggle signals, labels, and the dashboard on or off, and customize all colors to your preference.
Summary
The Adaptive Trend & Momentum (ATM) indicator is more than just a tool; it is a complete system for making more confident trading decisions. By adapting to the market and combining trend, momentum, and volatility, it provides a clear, uncluttered, and powerful view of price action.
Add it to your chart today and experience the clarity of adaptive trading!
Disclaimer: This indicator is a tool for technical analysis and should not be considered financial advice. Trading involves risk, and you should always use proper risk management. Past performance is not indicative of future results. Practice on a demo account before trading with real capital.
Keywords: Adaptive, Moving Average, Trend, Momentum, Volatility, RSI, Bands, Signal, Confirmation, All-in-One, System, Strategy, ATR, Volatility, Dashboard, Alert

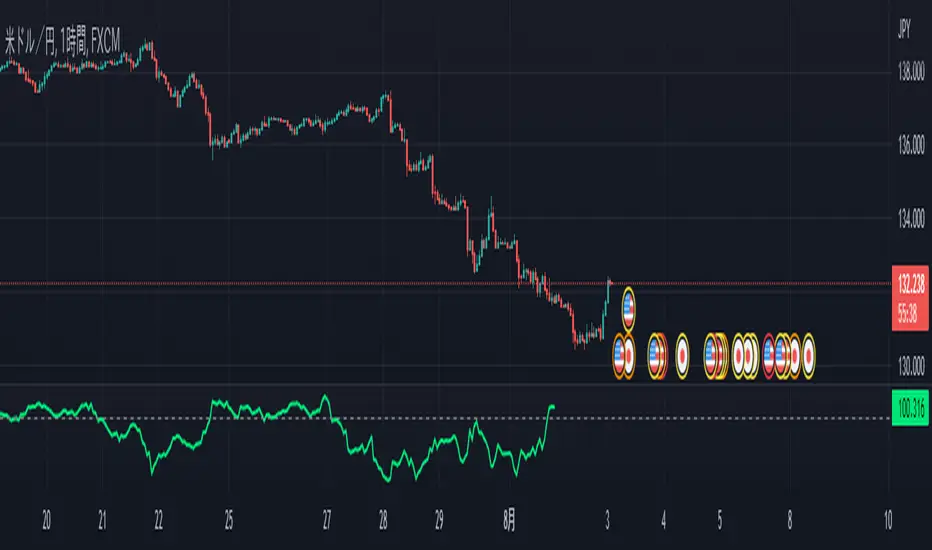
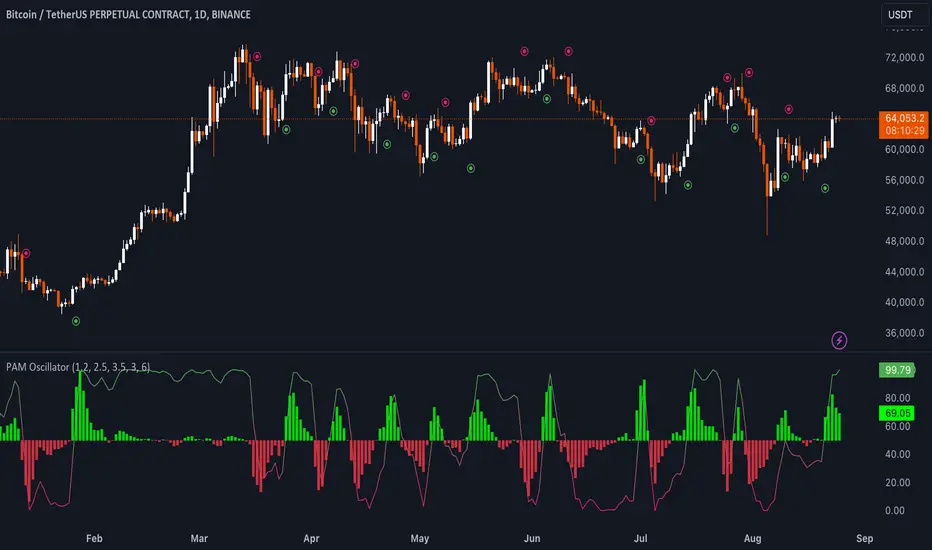
Uptrick: Price Action Momentum Oscillator### Detailed Description of the Indicator: "Uptrick: Price Action Momentum Oscillator (PAM Oscillator)"
The "Uptrick: Price Action Momentum Oscillator" (PAM Oscillator) is a highly customized and sophisticated trading indicator designed to provide traders with a multi-dimensional analysis of market momentum across varying timeframes. It stands out due to its comprehensive approach, combining price action analysis with cycle detection to deliver insights into potential trend reversals, continuations, and market strength or weakness. The PAM Oscillator is not just another momentum oscillator; its design incorporates both the granular details of price swings and broader cyclical trends, offering a unique blend of short-term agility and long-term reliability.
#### 1. **Input Settings**
- **PAM Oscillator Settings:**
- **Enable PAM Oscillator:** This feature allows traders to toggle the main oscillator on or off, making it versatile for different trading setups or when combining with other indicators.
- **Short-Term Influence (Default: 1.2):** This parameter controls how much weight short-term price movements have on the overall oscillator. The ability to adjust this weight provides traders with the flexibility to fine-tune the sensitivity of the indicator to short-term fluctuations.
- **Mid-Term Influence (Default: 2.5):** The mid-term weight balances the oscillator by adding a medium-term perspective, essential for capturing sustained price movements without getting swayed by short-term noise.
- **Long-Term Influence (Default: 3.5):** The long-term weight adds stability to the oscillator, ensuring that the indicator reflects broader market trends, which is crucial for long-term traders or when trading in higher timeframes.
- **Oscillator Smoothing (Default: 3):** This parameter allows traders to smooth the oscillator output, reducing the effect of market noise and making the indicator more reliable by filtering out minor price fluctuations.
- **Bullish Trend Color (Default: Green - #4caf50):** The color customization for bullish trends enables traders to visually distinguish market conditions quickly.
- **Bearish Trend Color (Default: Red - #e91e63):** Similarly, the bearish trend color customization aids in quickly identifying market downturns.
- **Enable Oscillator Signals:** This setting allows for the plotting of explicit buy and sell signals, helping traders who prefer clear, actionable insights rather than interpreting raw oscillator values.
- **Bullish Signal Color (Default: Green - #4caf50):** The ability to customize signal colors enhances the clarity of the signals, allowing them to stand out on the chart.
- **Bearish Signal Color (Default: Red - #e91e63):** Like the bullish signal color, this ensures that bearish signals are easily distinguishable.
- **Cycle Analysis Settings:**
- **Enable Cycle Analysis Histogram:** This feature introduces an additional layer of analysis by displaying a histogram that represents cyclical market behavior. It's particularly useful for traders looking to understand the underlying cyclical trends in momentum.
- **Cycle Length (Default: 6):** Adjusting the cycle length allows traders to tailor the cycle detection to different market conditions or asset classes, making the PAM Oscillator adaptable across different markets.
- **Cycle Bullish Color (Default: Light Green - #8bc34a):** The histogram's color customization for bullish cycles aids in quickly identifying periods of positive market momentum.
- **Cycle Bearish Color (Default: Orange - #ff5722):** The bearish cycle color helps in visualizing negative momentum phases.
- **Enable Cycle Signals:** This option allows traders to generate additional buy and sell signals based on the cycle histogram, offering further opportunities to enter or exit trades based on cyclic trends.
- **Cycle Bullish Signal Color (Default: Light Green - #8bc34a):** Customizable signal colors for cycle-based bullish signals improve the indicator's usability by making important signals more visible.
- **Cycle Bearish Signal Color (Default: Orange - #ff5722):** Similarly, bearish signal colors ensure that traders can quickly identify when the market is potentially entering a downtrend.
#### 2. **Custom Types and Functions**
- **PriceData Structure:** The `PriceData` structure encapsulates essential price information (open, high, low, close) along with the bar index. This structure is fundamental for the accurate calculation of swings and trends, ensuring that the oscillator is grounded in precise and up-to-date market data.
- **SwingData Structure:** This structure manages the market's swing points (highs and lows) and their respective indices. It is crucial for detecting and updating the oscillator with significant price levels, helping to identify key turning points in the market.
- **detectSwing Method:** The `detectSwing` method is a core component that determines whether a significant swing (high or low) has occurred. This detection is pivotal for the oscillator, as it triggers the update of the swing data, marking crucial levels where momentum may shift.
- **updateSwing Method:** This method updates the `SwingData` structure when new swing points are detected. It resets the structure's state, ensuring that the most recent price action is accurately reflected in the oscillator.
- **normalizeOsc Function:** The `normalizeOsc` function standardizes the oscillator values between 0 and 100, ensuring consistency across different timeframes and smoothing the data to emphasize genuine momentum changes. This normalization makes the oscillator easier to interpret and more reliable, especially when comparing across different assets or timeframes.
#### 3. **Core Calculations for the Oscillator**
- **Short-Term Oscillator Calculation:**
- This calculation focuses on recent price action to detect short-term trends or reversals. It updates the swing structures based on new highs and lows, determining whether the market is currently bullish or bearish on a short-term basis.
- This feature is particularly useful for traders who need to react quickly to market changes, such as scalpers or day traders.
- **Multi-Term Oscillator Calculation:**
- This function handles the mid-term and long-term oscillators, combining data from these timeframes to produce a comprehensive view of market momentum. It detects and updates swing points across these periods, offering a more robust trend analysis.
- By focusing on multiple timeframes, this calculation helps in filtering out noise and identifying more sustained market trends.
- **Oscillator Data Collection:**
- The `collectOscData` function aggregates oscillator values from short-term, mid-term, and long-term analyses. This comprehensive approach ensures that the final oscillator value reflects a balanced view of the market, taking into account different time horizons and their respective weights.
- The weighted average calculation of the oscillator values allows traders to customize the importance of each timeframe, tailoring the indicator to their specific trading style or strategy.
#### 4. **Plotting the Oscillator and Cycle Histogram**
- **Oscillator Plot:**
- The main oscillator is plotted on the chart, providing a color-coded visualization of market momentum. The gradient from bearish to bullish colors helps traders quickly assess the current market condition.
- Buy and sell signals are plotted based on the oscillator's crossing of the 50 line, offering clear entry and exit points for traders. This feature is particularly beneficial for those who prefer straightforward signals over interpreting complex data.
- **Cycle Histogram Plot:**
- The cycle histogram adds another layer of analysis, highlighting the cyclical nature of market momentum. By displaying the difference between the oscillator value and its smoothed cycle, traders can visualize the strength and direction of cyclical trends.
- The histogram is color-coded to differentiate between bullish and bearish cycles, making it easier to identify periods of rising or falling momentum.
- **Cycle Signal Plot:**
- If cycle signals are enabled, the indicator plots additional buy and sell signals based on the cycle histogram. This feature provides further opportunities for traders to act on cyclical trends, potentially capturing profits from both major and minor market cycles.
### Uniqueness of the PAM Oscillator
The PAM Oscillator is unique in its approach to blending multiple timeframes and cyclical analysis into a single, cohesive indicator. Unlike traditional oscillators that focus on a single aspect of price action, the PAM Oscillator integrates short-term, mid-term, and long-term price data, giving traders a more holistic view of market momentum. Its ability to adjust the influence of different timeframes and the inclusion of cycle analysis makes it exceptionally versatile, catering to a wide range of trading strategies.
- **Comprehensive Multi-Term Analysis:** The PAM Oscillator doesn't just focus on a single timeframe; it aggregates data across short, mid, and long-term horizons, providing a nuanced and adaptable view of market conditions.
- **Integrated Cycle Analysis:** By incorporating a cycle histogram, the PAM Oscillator allows traders to understand and act on the cyclical nature of markets, something that is often overlooked in standard momentum indicators.
- **Customizable Weighting System:** The ability to adjust the weighting of different timeframes and customize colors and signals makes the PAM Oscillator adaptable to different trading environments and preferences, offering a level of customization that is rare among other indicators.
- **Signal Clarity:** The indicator not only visualizes market momentum but also provides clear buy and sell signals based on oscillator and cycle data, making it user-friendly and effective for traders at all levels.
### How Different Traders May Use the PAM Oscillator
1. **Scalpers:**
- **Short-Term Focus:** Scalpers will primarily use the short-term oscillator to identify quick momentum changes for intraday trades. The oscillator’s responsiveness to recent price swings allows them to catch rapid price movements and capitalize on brief market opportunities.
- **Cycle Avoidance:** The cycle histogram can help scalpers avoid periods of low momentum, ensuring they only trade when the market is actively trending, thereby enhancing their profitability.
2. **Day Traders:**
- **Multi-Term Strategy:** Day traders can leverage both the short-term and mid-term oscillators to confirm trend directions before entering trades. This dual-layered approach minimizes the chances of getting
caught in false breakouts, improving trade accuracy.
- **Signal-Based Entries:** The buy/sell signals generated by the oscillator crossing the 50 line offer clear entry and exit points, making it easier for day traders to make quick decisions.
3. **Swing Traders:**
- **Long-Term Influence:** Swing traders might emphasize the long-term oscillator to identify major trend reversals. By smoothing out noise and focusing on longer-term price action, they can hold positions through minor corrections and capitalize on larger market movements.
- **Cycle Confirmation:** The cycle histogram can serve as a confirmation tool, helping swing traders stay in trades during strong cycles and exit when momentum starts to weaken.
4. **Position Traders:**
- **Cycle Dominance:** Position traders can use the cycle histogram to identify macro trends, holding positions for extended periods based on long-term cyclical analysis. This approach is particularly useful in markets with clear cyclical patterns.
- **Multi-Term Validation:** These traders can use the multi-term oscillator to ensure that all timeframes are aligned with their long-term trading strategy, providing greater confidence in maintaining positions through periods of short-term volatility.
### In Summary
The PAM Oscillator is not just an indicator; it’s a comprehensive toolkit for understanding and trading market momentum across different timeframes and cycles. Its unique combination of customizable weighting, multi-term analysis, and integrated cycle detection makes it a powerful tool for traders of all styles, from scalpers to long-term investors. Whether you're looking to capitalize on short-term price movements or identify long-term trends, the PAM Oscillator provides the insights and flexibility needed to navigate the complexities of modern trading.
---------------------------------------------------------------------------------
This indicator's code will soon be available on: discord.gg
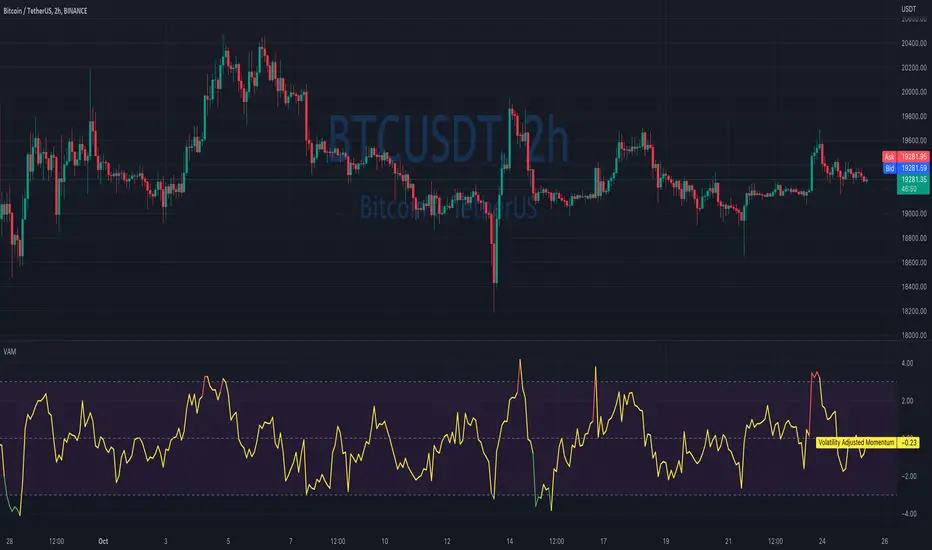
Volatility Adjusted MomentumIt's a script that computes volatility-adjusted momentum indicators.
The problem with the momentum indicator is that it's absolute and it's hard to interpret its value. For example, if you'll change the timeframe or instrument value of Momentum will be very different.
We tried to solve that by expressing momentum in volatility. This way you can easier spot overbought/oversold values.
You can choose to use Standard Deviation or ATR for adjustments.
Thanks to @MUQWISHI for helping me code it.
Disclaimer
Please remember that past performance may not be indicative of future results.
Due to various factors, including changing market conditions, the strategy may no longer perform as well as in historical backtesting.
This post and the script don’t provide any financial advice.
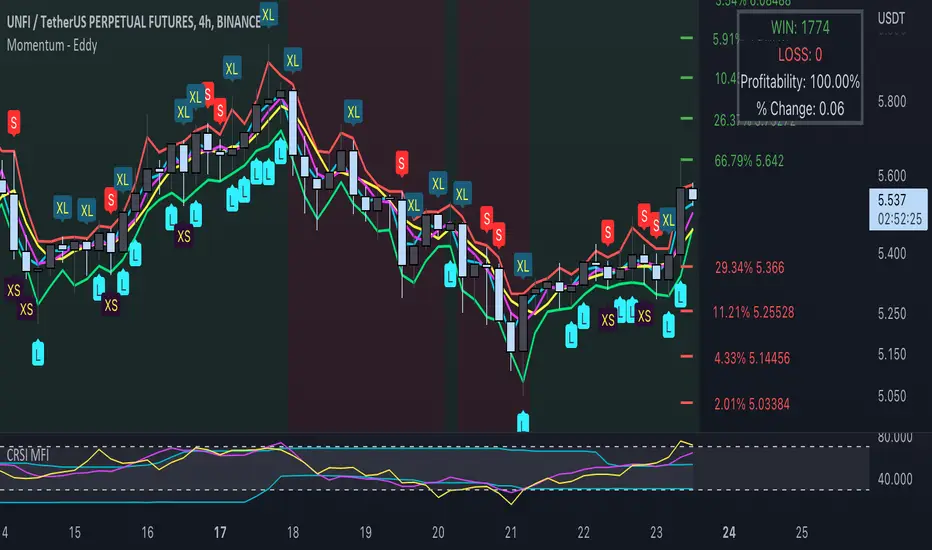
Momentum - EddyThis indicator uses momentum, emas, macd trend, probability to find the best entry for both long and short positions.
L = Long
When the low goes below the green line (ema fast low), close is above open and momentum is up
S = Short
When the high goes above the red line (ema fast high), close is below open and momentum is down
XS = Exit short at potential bullish pivot
When the low is below a red step (probability) and below ema fast low and both ema fast high and low are 0.5 % (can be changed in the settings) spread, and high is below ema fast low and open is at least 0.2 % spread (can be change in the settings).
XL = Exit long
When the high is above ema fast high and above a green step (probability) with at least 0.2 % spread (customizable in the settings)
The win rate changes based on the % change parameter. The lower the % change the higher the win rate will be.
Green and Red background shows you a bull trend or bear trend. It uses the Mac signal (periods are customizable in the settings).
You can add alerts for Long / Short / Exit Long / Exit short.
You can adjust parameters in the settings.
Use your own judgement to place trades. This algorithm helps you remove the stress of trading.
To avoid false signals trade from 4h timeframe +.
Trend Surfers - Momentum + ADX + EMAThis script mixes the Lazybear Momentum indicator, ADX indicator, and EMA.
Histogram meaning:
Green = The momentum is growing and the ADX is growing or above your set value
Red = The momentum is growing on the downside and the ADX is growing or above your set value
Orange = The market doesn't have enough momentum or the ADX is not growing or above your value (no trend)
Background meaning:
Blue = The price is above the EMA
Purple = The price is under the EMA
Cross color on 0 line:
Dark = The market might be sideway still
Light = The market is in a bigger move

Momentum Drift Oscillator™TradeChartist Momentum Drift Oscillator is a elegantly designed Oscillator that uses both trend following and mean reversion models, that helps visualize the price momentum, based on user defined lookback period and standard deviation.
===================================================================================================================
Momentum Drift Oscillator ( MDO ) Features:
MDO shows how far away the price is, from the mean, based on Lookback Length (21, 34, 55, 89, 144, 233) and Standard Deviation input (Min - 0.236, Max - 2.0) , and helps understand potential price reversal points based on mean reversion principles.
Drift Visualizer helps visualise the velocity with which Price moves and helps the trader spot various momentum drift zones like Fuel zones, Overbought/Oversold areas and Bull/Bear Exhaustion limits. Drift Visualizer above 150 is usually Overbought and value above 200 is Super Overbought. Similarly, value below -150 is usually Oversold and value below -200 is Super Oversold.
Option to enable and disable coloured bars based on Momentum Drift. (Colour intensity on Price bars helps visualise the price momentum - 2 Colour Schemes available from the settings - Chilli and Flame).
Long and Short Trade Alerts can be created using Once Per Bar Close .
The indicator does not repaint. Alerts may display potential repaint warning, but this is because the code uses bar index for Drift Visualizer labels. For confidence in the indicator, it can be tested using bar replay to make sure the real-time and bar replay trade entries and plots stay on the same bar/timestamp.
MDO can be connected to ™TradeChartist Plug and Trade to generate Trade Entries, Targets, Sop Loss plots etc and to create all types of alerts.
===================================================================================================================
Why is Momentum Drift Oscillator ( MDO ) different from traditional Momentum based indicators?
This Momentum Drift model truly combines mean reversion and trend following principles, but with a unique original idea.
It needs 2 user defined inputs - Lookback length and Standard Deviation. If for example, say the trend is Bullish and MDO is above 0, the Oscillator doesn't go below 0, even if there is extreme bull exhaustion, if the trend based on lookback and standard deviation is not favorable to reverse trades.
Only Fibonacci lookback periods (21, 34, 55, 89, 144, 233) are used as they have been found more effective than other periods. The default Lookback period is 55 and Standard Deviation is 1, but this can be changed from the settings. Lower values of Lookback period go well with higher Standard Deviation and higher values of Lookback period go well with lower Standard Deviation (0.5, 0.618, 0.786, 0.886, 1 etc.), based on trading style and personal risk strategy.
The indicator includes a Drift Visualizer that helps spot important trade zones based on Price Velocity, calculated dynamically for every bar based on user defined parameters. The first move above or below 0 always opens at Bull Fuel or Bear Fuel zone and the exhaustion zones are reached only at the time of price returning to the mean. But it doesn't change direction if the trend is still up, so the trader can make an informed decision as to when to reverse trades, based on another confirmator.
Similarly, when the Visualizer reaches Fuel or Support/Resistance zones, it normally needs a bit of a push to reach the Overbought - Super Overbought/Oversold - Super Oversold levels where the price normally starts reversing back to the mean and this whole process can be visualized through Visualizer labels on MDO. This process eliminates a lot of noise that normally comes with traditional Momentum indicators.
===================================================================================================================
Example Charts:
1. XAU-USD 1hr chart - Lookback - 55, Std Dev - 2
2. ADA-USDT 4hr chart - Lookback - 89, Std Dev - 1
3. WTI - USOIL Daily chart - Lookback - 34, Std Dev - 1.618
4. SPX Daily chart - Lookback - 144, Std Dev - 0.236
5. GBP-USD 15m chart - Lookback - 144, Std Dev - 0.618
6. BTC-USD 1hr connected to Plug and Trade - Lookback - 55, Std Dev - 1
===================================================================================================================
Best Practice: Test with different settings first using Paper Trades before trading with real money
===================================================================================================================
This is not a free to use indicator. Get in touch with me (PM me directly if you would like trial access to test the indicator)
Premium Scripts - Trial access and Information
Trial access offered on all Premium scripts.
PM me directly to request trial access to the scripts or for more information.
===================================================================================================================

NAMI Lite │ Zero-Repaint Momentum Wave + Reg Divergences (FREE)
NAMI Lite │ 100% Zero-Repaint Momentum Wave + Divergences (FREE)
The only zero-repaint, zero-lag momentum indicator that calls reversals hours early — even the free version beats all paid indicators.
No repainting on closed bars • Instant wave flips • Clean regular divergences • Money Flow confluence
Zero-Repaint Momentum Wave – CCI-based oscillator with real-time color flips (no lag, no lies)
Regular Bull/Bear Divergences – Faded lines on confirmed pivots only
Money Flow Oscillator – Volume-weighted filled areas for extra confirmation
This Lite version is intentionally limited — powerful enough to replace monthly subscriptions, but missing the pro features that make trading effortless.
Upgrade to Full NAMI Suite (One-Time Payment – Cancel Recurring Fees Forever):
Hidden Divergences with Divergence LABELS (catch 70% more massive moves)
200-Color Stochastic Heat Ribbon (gorgeous visual heatmaps)
True VWAP Oscillator + multi-source options
Buy/Sell Dots + Full Alerts (divergence, money flow, wave flips)
Full and Complete Customization (themes, lengths, colors)
Plus our other toolkits: TRAVIS, SMC Pro, and all future tools free
SEE IMAGE FOR COMPLETE NAMI VIEW
Over 800 traders already switched and saved thousands.

Momentum Trail Oscillator [AlgoAlpha]🟠 OVERVIEW
This script builds a Momentum Trail Oscillator designed to measure directional momentum strength and dynamically track shifts in trend bias using a combination of smoothed price change calculations and adaptive trailing bands. The oscillator aims to help traders visualize when momentum is expanding or contracting and to identify transitions between bullish and bearish conditions.
🟠 CONCEPTS
The core idea combines two methods. First, the script calculates a normalized momentum measure by smoothing price changes relative to their absolute values, which creates a bounded oscillator that highlights whether moves are directional or choppy. Second, it uses a trailing band mechanism inspired by volatility stops, where bands adapt to the oscillator’s volatility, adjusting the thresholds that define a shift in directional bias. This dual approach seeks to address both the magnitude and persistence of momentum, reducing false signals in ranging markets.
🟠 FEATURES
The momentum calculation applies Hull Moving Averages and double EMA smoothing to price changes, producing a smooth, responsive oscillator.
The trailing bands are derived by offsetting a weighted moving average of the oscillator by a multiple of recent momentum volatility. A directional state variable tracks whether the oscillator is above or below the bands, updating when the momentum crosses these dynamic thresholds.
Overbought and oversold zones are visually marked between fixed levels (+30/+40 and -30/-40), with color fills to highlight when momentum is in extreme areas. The script plots signals on both the oscillator pane and optionally overlays markers on the main price chart for clarity.
🟠 USAGE
To use the indicator, apply it to any symbol and timeframe. The “Oscillator Length” controls how sensitive the momentum line is to recent price changes—lower values react faster, higher values smooth out noise. The “Trail Multiplier” sets how far the adaptive bands sit from the oscillator mid-line, which affects how often trend state changes occur. When the momentum line rises into the upper filled area and then crosses back below +40, it signals potential overbought exhaustion. The opposite applies for the oversold zone below -40. The plotted trailing bands switch visibility depending on the current directional state: when momentum is trending up, the lower band acts as the active trailing stop, and when trending down, the upper band becomes active. Trend changes are marked with circular symbols when the direction variable flips, and optional overlay arrows appear on the price chart to highlight overbought or oversold reversals. Traders can combine these signals with their own price action or volume analysis to confirm entries or exits.

YinYang MomentumOverview:
YinYang Momentum is a Price, Volume and Momentum Oscillator. Its job is to help you see swings in momentum and the strength of it. It also creates signals (Blood Diamond (Bear) and Support Cross (Bull)) where these momentum swings may occur. YinYang Momentum features 3 Price and 3 Volume 'Mountains with Ice'. There are Predictive, Regular and Confirming Mountains. You have the ability to overlay them on top of each other which helps to decipher momentum swings. The Volume Mountains are very important for showing the strength behind the Price Mountains and their Signals. If you look, you'll notice, as the 'Ice' starts to curve into the 'Mountains' it signals a potential shift in Momentum. The green Mountain is the Predictive, the Blue is the Regular and the Purple is the Confirming. You'll also notice that the Predictive Mountains movements happen first and move much more drastically. When you notice the regular starts to follow suit, there is a potential for a momentum shift. Shortly after, a signal will occur if this shift is actually happening. You can also check the Confirming Mountain for more confirmation (however, leaving the Confirming Mountain active can be a little confusing and make it harder to read signals). YinYang Momentum also features Information Tables. These tables display how the Blood Diamonds and Support Cross' are fairing on different Timeframes. This way, you'll be able to see if it's in a Bullish or Bearish state on critical Time Frames no matter what Timeframe you're trading on.
Before we move onto the tutorial, let's discuss what each of these Mountains and Ice are and how they work. All of our Mountains and Ice are calculated using the same algorithm but with varying sources, lengths and multipliers. We are essentially calculating differences in movement and then sending those differences into an EMA for the Mountain Base and SMA for the mountain Ice. The values we use for the Predictive are much lower and therefore occur much quicker as they aren’t averaged out on longer lengths/time frames; this helps to make it more of a leading Indicator which may predict momentum changes. Our Regular is over a medium length and multipliers that result in a smooth but generally also gradual movement that helps reliability; this helps it act as more of an ‘in the now’ Indication of momentum changes. Our Confirming uses lengths and multipliers that are of a higher value and longer span; this makes it more difficult to use for determining entry / exit locations as it's more of a lagging indicator, but it helps to add confirmation as to whether the momentum change has occurred and wasn't a false signal.
Tutorial:
YinYang Momentum may look like a lot is going on.. And well that’s cause there is.. But that doesn’t mean it's confusing or hard to read once you know what you’re looking for!
To make this tutorial a little easier to understand, let's turn off a few settings and dissect this indicator one thing at a time. YinYang Momentum features Price and Volume mountains. Currently in the photo above we have 2 Price Mountains and 1 Volume Mountain turned on (this is how it's set by default and how we recommend using it), however there are 3 Mountains available for both Price and Volume:
Predictive
Regular
Confirming
We are going to deactivate everything so it's the Regular Price Mountain + Ice enabled.
Now that it is just the Regular Price Mountain and Ice it is much easier to teach and understand. As you can see there are two different colors on the mountain. The dark blue is the Mountain and the light blue is the Ice.
The Ice moves before the mountain does and when the momentum happens it is larger than it (below or above). When the momentum starts to change however, the Ice curves inside of the mountain. As you can see here, where the BUY signal (red cross) is, the Ice curves into the mountain; also where the SELL signal (red circle) is, the Ice curves into the mountain. The Ice curving into the mountain is a very important leading indication that momentum is changing and the Signals (crosses and diamonds) help solidify this momentum change.
The Index levels for YinYang Momentum is a little different than most oscillators that range from 0-100. Instead YinYang Momentum’s neutral level is 0 and it ranges from -100 to 100. For these reasons, the Viable Range for Buying is -40 to -70 and the Optimal Range for Buying is -70 to -100. For Selling, the Viable Range is 40 to 70 and the Optimal Range is 70 to 100.
If you look at the example above, you can see whenever it has been in the optimal range and the signal occurred, it may potentially be an amazing time to buy or sell. However, when it is within the Viable Range it can be hit or miss. The reason for this is because we are only looking at the Regular Price Mountain and Ice. Once we turn on the Predictive Price and Regular Volume we will have a much clearer idea as to what is noise and what is a true purchase signal. Why don’t we turn on Predictive Price Mountains and Ice so you can see what we’re talking about:
So there are 2 big things that changed when we added the predictive price mountains + ice.
We can see that where the orange circle is, is just noise, it isn’t a viable buy signal.
We can see that where the red circle is, is actually a better spot to sell than the previous marked white circle slightly to the right of it.
We will explain why both above are true, but first let's explain how we were able to deduce this information.
There are 5 rules when deciphering if the signal is a true signal or just noise.
You want the predictive mountain to be decently spaced out from the regular mountain. Refer to the example above how that should look. Remember it's predictive so with parabolic movements it will get quite spaced out. If the price went up but slowly, it generally won’t be as spaced and isn’t as strong of a signal predictor.
You want the Ice to be of a decent size and to curve in on both the Predictive and Regular Mountains. Both arrows (red and white circle arrows) are pointing to Ice that does just that. The Predictive mountain is of decent size and spaced out and the Ice curves in sharply on the Predictive, before curving in sharply on the Regular and then we get both Predictive and Regular Support Cross on the Same Bar.
When you get the Signals (Predictive and Regular) the amount of bars between them matters a lot! On the same Bar is ideal, however 1-2, max 3 bars between them is acceptable. Any more than 3 bars spacing and it's too risky of a signal because that means momentum change was happening but then stopped before picking back up. This doesn’t mean it can’t be a good signal, it just means it is much more risky and we don’t recommend it.
You don’t want Signal Clustering. You can see an example of this from the picture above. Signal Clustering is where signals are back to back over and over. During this time the momentum is in a consolidation phase and easily swaps back and forth between signals. These signals are not reliable and should not be traded on. We only want to act on clear momentum based signals.
Last but certainly not least, actually, the most important! Ensure that the Mountain + Ice for both the Predictive and Regular is at the bare minimum touching (preferably inside) the Viable Range. The Optimal range is best, but most mountains don’t make it that far. Viable Range is where you will make most of your trades from. Sometimes a great signal happens with all 5 of these rules but it is only touching the Viable Range right at 40 or -40. This CAN be okay, but is also much more risky than if it was at 50 to 60 or -50 to -60.
Based on the 5 rules mentioned, take a second and look back at the photo where we initially added the Predictive Price mountains and Ice, can you decipher why the orange circle is just noise, and can you see why the red circle is a better sell location than the white circle slightly to the right of it?
Let’s bring that photo back up now and let’s discuss this:
Let's start with the orange circle:
This orange circle, without the predictive, was hard to tell if it was a good location to buy or not, but the second we turned it on we could clearly see it was just noise.
The spacing between the Predictive mountains and the Regular is almost non-existent.
There was signal clustering shortly before this signal.
Remember, there doesn’t have to be many rules broken for a signal to be either too risky or not valid at all. The safest trades are ones where it meets the requirements of all 5 rules (6 once we talk about volume, but 5 price rules).
Now, let's discuss the red circle:
This red circle, although it could have been chosen with just the regular, was much more noticeable with the predictive added on top.
It has a perfect spacing between the Predictive and the Regular all the way to the peak.
The Ice is large and both curve in very nicely towards the mountains.
The signals are within 2 bars apart from each other.
There is no signal clustering.
The Predictive is within the Viable Range and the Regular is just touching it.
For these reasons, the red circle actually would have been where you sold and not the white circle beside it.
This pretty much covers the Price Mountains, but wait! The most important Cherry on Top to your decision making process is coming next!
We have just enabled our Regular Volume Mountains and Ice (which are the black mountains + ice). As you can see, we have circled what we call the ‘Perfect Combo’. This Perfect combo is when you have all 5 Price rules met COMBINED with a high volume mountain. The Volume Mountain and Ice act as strength. They aren’t biased towards bulls or bears, they simply show strength to whatever signal is present with it.
For example, if all 5 rules are met with Price on a Blood Diamond (Bear) Signal and there is a High Volume Mountain then this is also a ‘Perfect Combo’. That Blood Diamond signal will potentially have great strength behind it. The Viable and Optimal Ranges don’t apply to volume mountains. Any volume mountain, even close to the Viable Range, is considered to be a very high mountain. High volume is when the mountain is above 0 and low volume is when it's below 0. Any signal with low volume has less of a chance of being correct, regardless of whether it abides by all 5 price rules.
You can see here that the 5 Price rules are achieved but the volume mountain is low. It is at -25. Since the 5 Price rules are right, there is still a decent amount of accuracy to this signal and the price did plummet after, but not nearly as much as it would have if the volume mountain was high with it.
We have turned our Confirming Price Mountain on here so you can get an idea of what it looks like and how it’s used. If you refer to the Support Crosses and Blood Diamonds circled in white, you’ll see that although they both received their signals on the Predictive and Regular, neither of them received it on the Confirming. This shows that these signals lost momentum shortly after. However if you look at both the red and green circles, you’ll see that they both received their confirming signals and that it helped give those signals momentum. The Confirming Price Mountain is meant to help confirm if the momentum change is still on track and the max 3 bars from the regular signal rule still applies to it. However its height within the viable and optimal range is important, just not as relevant
Before we move on to our Information Tables we want to take a second just to discuss our Volume Mountains and Ice. We haven’t had a chance yet to discuss the Predictive or Confirming Volume. When it comes to our Volume Mountains + Ice, we don’t recommend having more than 1 on at a time. The reason we have included the Predictive and Confirming is in case you find they suit your Trading Style best, not necessarily to be used the same way the Price Mountains and Ice are. The main reason for this is due to the fact that the Volume Mountains are much smaller and when overlaid on top of each other can make a confusing blur that is hard to decipher.
In this example above we have enabled both Predictive and Regular Volume just so you can understand what we are talking about. The two together can be rather confusing and actually interfere with your decision making process. For this reason, we highly recommend finding the Volume Mountain that suits your trading style best and solely sticking to that.
Our Predictive Volume Mountains and Ice may help sense volume changes before they’ve even happened. This can be very useful if your Trading Style revolves around heavy volume changes.
Our Confirming Volume Mountains and Ice are much slower and smaller, but they help show the movement of volume that has occurred already. This can be used to help see the movement of volume without fearing it may or may not happen.
Our Information Tables are there to show you valuable information on whether it is in a state of Support Cross or Blood Diamond on 6 different Time Frames at the same time. The % it shows you displays how much of a price change has occurred since that signal has happened. It is important to note, if for instance you see it is in a state of Support Cross but the % is negative, this generally means it is going to switch to Blood Diamond soon and vice versa. Therefore if you are in a trade, especially on a lower Time Frame and you are watching the 1 Day or a higher Time Frame and notice that the % is getting less and less, it may be a good time to get out.
We will conclude our Tutorial here. If you have any Questions, Concerns, Suggestions or Comments please don’t hesitate to contact us.
Settings:
1. Show Predictive to Confirmed Trendline:
The Predictive to Confirmed Trendline is very useful for seeing when the predictive (Support Cross or Blood Diamond) has hit the confirmed (It’s a strong confirmation that the trend may be shifting). This trendline also features a Moving Average which helps give you a solid marker for when the Regular / Predictive mountains cross under or over it that a momentum swing may occur. Somewhat like when the RSI crosses above/below its Moving Average it dictates momentum change, that is likewise how to interpret when it happens with the mountains and this trendline.
2. Show Price Ice and Mountains based on:
The Price Ice and Mountains are very important when it comes to deciphering signal strength. For example, When the mountains are very low (regular and predictive) and are between the 2 red line (undervalued) or even possibly below the bottom red line, and the Ice on the mountains starts to curve into the mountains and then the Predictive and Regular Support Cross occur; this is a very strong Bullish Signal. But wait, that's not all, the cherry on top is when the volume mountain (black) is ALSO high while this occurs; the Volume Mountain adds Strength to the signal. When the volume mountain is high too during this ‘Perfect Combo’ this may potentially lead to very bullish price movement occurring soon. Here is an overview of each mountain:
2.1. Predictive: Are the least reliable, but they move first and nothing will move without the predictive moving first, and getting you ready.
2.2. Regular: Are the most accurate, they don't signify strength on its own, but they sure show some momentum.
2.3. Confirming: Are slightly behind when it comes to displaying data, and therefore shouldn't be used for entry / exit, but rather to show if the trend movement has truly been confirmed or not.
When the Ice starts to curve into the Mountain, (either upward or below) it signifies possible momentum change. There are Crosses (Bull), and Diamonds (Bear) to show when they've crossed. Cross' and Diamonds balance each other out and therefore there can never be more than 1 in a row (of the same type). When the Ice and Mountain size is very large (between 40 and 70), and the predictive Ice starts to curve into its mountain, and then the predictive curves into the Regular, and the Regular Ice is curving into its Mountain, then it may have some strong weight behind that signal.\nIMPORTANT: refer to Volume tooltip below for how to increase the signal strength even more.
3. Show Volume Ice and Mountains based on:
The Volume Ice and Mountains are for giving strength to the Price's signals and Size. When there is the perfect combo (described above) AND the Volume Ice + Mountain is high, then there may be a lot of strength to that Price signals (whether it is Cross (Bull), or Diamond (Bear)).
IMPORTANT: High volume mountains, unlike Price, don't mean good or bad. Volume shows strength to the Price, and therefore if there are high Volume mountains during a Diamond (Bearish), then there may be a lot of strength to that signal and vice versa.
4. Show Information Tables:
Information tables are used to display 6 different Time Frames and whether or not each time frame is in a state of Blood Diamond (red) or Support Cross (green). They also show how much % in price has changed since the current signal happened. These are very useful for seeing how the price is fairing on different Time Frames without having to constantly change your timeframe. For instance, maybe you base your entry off the 1 day time frame but then you swing trade on the 15 minute. Well, after you’ve confirmed your entry position and are sitting on the 15 minute, you can stay on the 15 minute and see how it is fairing on the 1 day, 5 minute or whatever time frame you choose. This way you aren’t distracted from the trade at hand. All of these Time Frames can be adjusted in the Settings (GUI) to whatever resolution you wish.
5. Res1 / Res2/ Res3 / Res4 / Res5 / Res6:
These represent the different resolutions (Time Frames) being used in your information tables and can be modified to display whatever resolution works best for your trading style. By default they are:
Res1: Current Timeframe
Res2: 15 Minute
Res3: 1 Hour
Res4: 4 Hour
Res5: 1 Day
Res6: 1 Week
Backup Res (not changeable): 5 Minute (this is only used if your Current Timeframe in Res1 is a duplicate of one of the other resolutions)
HAPPY TRADING!

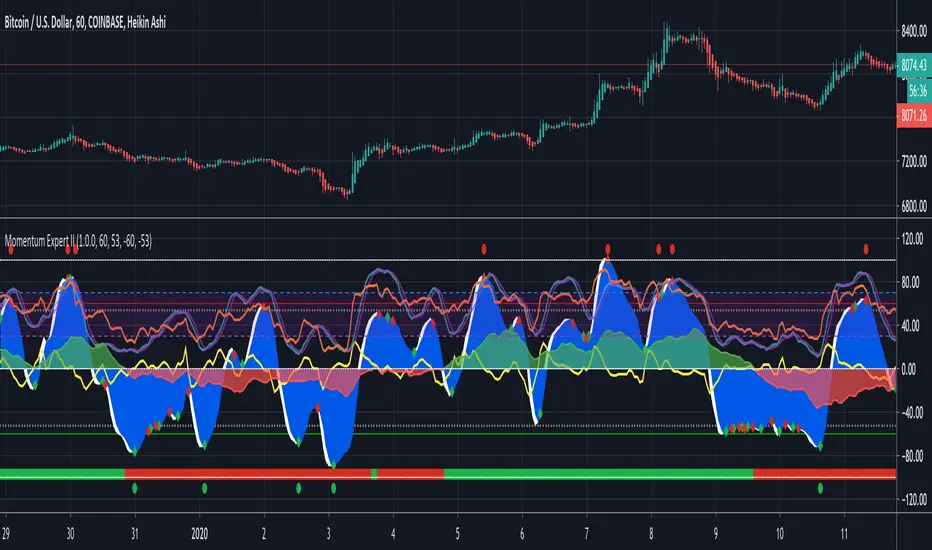
Momentum Expert IIThe momentum's expert provides you the clear analysis on how the momentum of the candles is working on the chart. It tells you if the momentum of the market is shifting down or the market is moving in the upwards directions. It has an added feature of the customised stochastic, which tells you if the market is moving into the bullish position or in the bearish position. It also plots the Relative strength index range to understand if the market is overbought or its oversold. It provides the momentum signals in order to make a better understanding if the momentum is coming to an end in the bullish or a bearish posture. It's perfect for all the markets (Equity, Forex, Cryptocurrency) and it works on all the time frames. Anyone can use this indicator with very minimum technical analysis knowledge. It's perfect for the new comers in the trading world. As it helps to understand in which way market is moving with its customised momentum signals and stochastic. Thank you.
Momentum Commitment Delta (MCD)What it is
M C D fuses five micro-structure clues into one 0-to-1 score that says, “how hard are traders actually leaning on this move?”
1. Body-Delta Momentum – average net candle body direction.
2. Volume Commitment – up-volume ÷ down-volume over the same window.
3. Wick Compression – shrinking upper/lower wicks = clean conviction.
4. Candle Sequencing – rewards orderly, staircase-style body growth.
5. Pin Ratio – where the close pins inside each candle’s range.
The five factors are multiplied, then auto-normalized so extremes always land near 0 / 1 on any symbol or timeframe.
I recommend tweaking the settings to fit your edge, the pre-loaded settings may not be suitable for most traders. The MCD works on all timeframes as well :)
⸻
How to read basic signals
• Fresh cross above 0.70 → often the birth of a real breakout.
• Cluster of > 0.70 bars → “commitment lock,” pull-backs usually shallow.
• Price makes new high while M C D doesn’t → beware...
• Cross back below 0.30 after a run → momentum is out of fuel.
⸻
Because M C D is multiplicative, it’s hard to hit the extremes—so when the bars light lime green, the print is usually telling the truth.
I personally use the MCD to identify the peak of a high-conviction range, NOT a breakout. If a bar prints over 0.70 (green) and then a range forms off of the bar which exceeded 0.70, the breakout has a high chance to be explosive, regardless of what MCD reads at the breakout inflection point.
Play around with it, im sure there are plenty of other patterns.
Disclaimer: The Momentum Commitment Delta (MCD) indicator is provided strictly for educational and informational purposes. It does not constitute financial or investment advice, nor is it a recommendation to buy or sell any security. Trading involves substantial risk, and you should always perform your own due diligence and consult a qualified financial professional before making any trading decisions. Past performance is not indicative of future results.
Volume-Price Momentum IndicatorVolume-Price Momentum Indicator (VPMI)
Overview
The Volume-Price Momentum Indicator (VPMI), developed by Kevin Svenson , is a powerful technical analysis tool designed to identify strong bullish and bearish momentum in price movements, driven by volume dynamics. By analyzing price changes and volume surges over a user-defined lookback period, VPMI highlights potential trend shifts and continuation patterns through a smoothed histogram, optional labels, and background highlights. Ideal for traders seeking to capture momentum-driven opportunities, VPMI is suitable for various markets, including stocks, forex, and cryptocurrencies.
How It Works
VPMI calculates the difference between volume-weighted buying and selling pressure based on price changes over a specified lookback period. It amplifies signals during high-volume periods, applies smoothing to reduce noise, and uses momentum checks to detect sustained trends.
Indicator display:
A histogram that oscillates above (bullish) or below (bearish) a zero line, with brighter colors indicating stronger momentum and faded colors for weaker signals.
Optional labels ("Bullish" or "Bearish") to mark significant momentum shifts.
Optional background highlights to visually emphasize strong trend conditions.
Alerts to notify users when strong bullish or bearish momentum is detected.
Key Features
Customizable Settings:
Adjust the lookback period, volume threshold, momentum length, and smoothing to suit your trading style.
Volume Sensitivity:
Emphasizes price movements during high-volume surges, enhancing signal reliability.
Momentum Detection: Uses linear regression and momentum change to confirm sustained trends, reducing false signals.
Visual Clarity:
Offers a clear histogram with color-coded signals, plus optional labels and backgrounds for enhanced chart readability.
Alerts:
Configurable alerts for strong momentum signals, enabling timely trade decisions.
Inputs and Customization
Lookback Period (Default: 9):
Sets the number of bars to analyze price changes. Higher values smooth signals but may lag.
Volume Threshold (Default: 1.4):
Defines the volume level (relative to a 20-period SMA) that qualifies as a surge, amplifying signals.
High Volume Multiplier (Default: 1.5):
Boosts histogram values during high-volume periods for stronger signals.
Histogram Smoothing Length (Default: 4):
Controls the EMA smoothing applied to the histogram, reducing noise.
Momentum Check Length (Default: 4):
Sets the period for momentum trend analysis (recommended to be less than Lookback Period).
Momentum Threshold (Default: 6):
Defines the minimum momentum change required for strong signals.
Show Labels (Default: Off):
Toggle to display "Bullish" or "Bearish" labels on significant momentum shifts.
Show Backgrounds (Default: Off):
Toggle to highlight chart backgrounds during strong momentum periods.
Bullish/Bearish Colors:
Customize colors for bullish (default: green) and bearish (default: red) signals.
Faded Transparency (Default: 40):
Adjusts the transparency of weaker signals for visual distinction.
How to Use
Interpret Signals:
Above Zero (Green):
Indicates bullish momentum. Bright green suggests strong, sustained buying pressure.
Below Zero (Red):
Indicates bearish momentum. Bright red suggests strong, sustained selling pressure.
Faded Colors:
Weaker momentum, potentially signaling consolidation or trend exhaustion.
Enable Visuals:
Turn on "Show Labels" and "Show Backgrounds" in the settings for additional context on strong momentum signals.
Set Alerts:
Use the built-in alert conditions ("Strong Bullish Momentum" or "Strong Bearish Momentum") to receive notifications when significant trends emerge.
Combine with Other Tools:
Pair VPMI with support/resistance levels, trendlines, or other indicators (e.g., RSI, MACD) for confirmation.
Best Practices
Timeframe:
VPMI works on all timeframes, but shorter timeframes (e.g., 5m, 15m) may produce more signals, while longer timeframes (e.g., 1h, 4h, 1D) offer higher reliability.
Market Conditions:
Most effective in trending markets. In choppy or sideways markets, consider increasing the smoothing length or momentum threshold to filter noise.
Risk Management:
Always use VPMI signals in conjunction with a robust trading plan, including stop-losses and position sizing.
Limitations
Lagging Nature:
As a momentum indicator, VPMI may lag in fast-moving markets due to smoothing and lookback calculations.
False Signals:
In low-volume or ranging markets, signals may be less reliable. Adjust the volume threshold or momentum settings to improve accuracy.
Customization Required:
Optimal settings vary by asset and timeframe. Experiment with inputs to align with your trading strategy.
Why Use VPMI?
VPMI offers a unique blend of volume and price momentum analysis, making it a versatile tool for traders seeking to identify high-probability trend opportunities. Its customizable inputs, clear visuals, and alert capabilities empower users to tailor the indicator to their needs, whether for day trading, swing trading, or long-term analysis.
Get Started
Apply VPMI to your chart, tweak the settings to match your trading style, and start exploring momentum-driven opportunities. For questions or feedback, consult TradingView’s community forums or documentation. Happy trading!

TTM Squeeze Momentum MTF [Cometreon]TTM Squeeze Momentum MTF combines the core logic of both the Squeeze Momentum by LazyBear and the TTM Squeeze by John Carter into a single, unified indicator. It offers a complete system to analyze the phase, direction, and strength of market movements.
Unlike the original versions, this indicator allows you to choose how to calculate the trend, select from 15 different types of moving averages, customize every parameter, and adapt the visual style to your trading preferences.
If you are looking for a powerful, flexible and highly configurable tool, this is the perfect choice for you.
🔷 New Features and Improvements
🟩 Unified System: Trend Detection + Visual Style
You can decide which logic to use for the trend via the "Show TTM Squeeze Trend" input:
✅ Enabled → Trend calculated using TTM Squeeze
❌ Disabled → Trend based on Squeeze Momentum
You can also customize the visual style of the indicator:
✅ Enable "Show Histogram" for a visual mode using Histogram, Area, or Column
❌ Disable it to display the classic LazyBear-style line
Everything updates automatically and dynamically based on your selection.
🟩 Full Customization
Every base parameter of the original indicator is now fully configurable: lengths, sources, moving average types, and more.
You can finally adapt the squeeze logic to your strategy — not the other way around.
🟩 Multi-MA Engine
Choose from 15 different Moving Averages for each part of the calculation:
SMA (Simple Moving Average)
EMA (Exponential Moving Average)
WMA (Weighted Moving Average)
RMA (Smoothed Moving Average)
HMA (Hull Moving Average)
JMA (Jurik Moving Average)
DEMA (Double Exponential Moving Average)
TEMA (Triple Exponential Moving Average)
LSMA (Least Squares Moving Average)
VWMA (Volume-Weighted Moving Average)
SMMA (Smoothed Moving Average)
KAMA (Kaufman’s Adaptive Moving Average)
ALMA (Arnaud Legoux Moving Average)
FRAMA (Fractal Adaptive Moving Average)
VIDYA (Variable Index Dynamic Average)
🟩 Dynamic Signal Line
Apply a moving average to the momentum for real-time cross signals, with full control over its length and type.
🟩 Multi-Timeframe & Multi-Ticker Support
You're no longer limited to the chart's current timeframe or ticker. Apply the squeeze to any symbol or timeframe without repainting.
🔷 Technical Details and Customizable Inputs
This indicator offers a fully modular structure with configurable parameters for every component:
1️⃣ Squeeze Momentum Settings – Choose the source, length, and type of moving average used to calculate the base momentum.
2️⃣ Trend Mode Selector – Toggle "Show TTM Squeeze Trend" to select the trend logic displayed on the chart:
✅ Enabled – Shows the trend based on TTM Squeeze (Bollinger Bands inside/outside Keltner Channel)
❌ Disabled – Displays the trend based on Squeeze Momentum logic
🔁 The moving average type for the Keltner Channel is handled automatically, so you don't need to select it manually, even if the custom input is disabled.
3️⃣ Signal Line – Toggle the Signal Line on the Squeeze Momentum. Select its length and MA type to generate visual cross signals.
4️⃣ Bollinger Bands – Configure the length, multiplier, source, and MA type used in the bands.
5️⃣ Keltner Channel – Adjust the length, multiplier, source, and MA type. You can also enable or disable the True Range option.
6️⃣ Advanced MA Parameters – Customize the parameters for advanced MAs (JMA, ALMA, FRAMA, VIDYA), including Phase, Power, Offset, Sigma, and Shift values.
7️⃣ Ticker & Input Source – Select the ticker and manage inputs for alternative chart types like Renko, Kagi, Line Break, and Point & Figure.
8️⃣ Style Settings – Choose how the squeeze is displayed:
Enable "Show Histogram" for Histogram, Area, or Column style
Disable it to show the classic LazyBear-style line
Use Reverse Color to invert line colors
Toggle Show Label to highlight Signal Line cross signals
Customize trend colors to suit your preferences
9️⃣ Multi-Timeframe Options - Timeframe – Use the squeeze on higher timeframes for stronger confirmation
🔟 Wait for Timeframe Closes -
✅ Enabled – Prevents multiple signals within the same candle
❌ Disabled – Displays the indicator smoothly without delay
🔧 Default Settings Reference
To replicate the default settings of the original indicators as they appear when first applied to the chart, use the following configurations:
🟩 TTM Squeeze (John Carter Style)
Squeeze
Length: 20
MA Type: SMA
Show TTM Squeeze Trend: Enabled
Bollinger Bands
Length: 20
Multiplier: 2.0
MA Type: SMA
Keltner Channel
Length: 20
Multiplier: 1.0
Use True Range: ON
MA Type: EMA
Style
Show Histogram: Enabled
Reverse Color: Enabled
🟩 Squeeze Momentum (LazyBear Style)
Squeeze
Length: 10
MA Type: SMA
Show TTM Squeeze Trend: Disabled
Bollinger Bands
Length: 20
Multiplier: 1.5
MA Type: SMA
Keltner Channel
Length: 10
Multiplier: 1.5
Use True Range: ON
MA Type: SMA
Style
Show Histogram: Disabled
Reverse Color: Disabled
⚠️ These values are intended as a starting point. The Cometreon indicator lets you fully customize every input to fit your trading style.
🔷 How to Use Squeeze Momentum Pro
🔍 Identifying Trends
Squeeze Momentum Pro supports two different methods for identifying the trend visually, each based on a distinct logic:
Squeeze Momentum Trend (LazyBear-style):
Displays 3 states based on the position of the Bollinger Bands relative to the Keltner Channel:
🔵 Blue = No Squeeze (BB outside KC and KC outside BB)
⚪️ White = Squeeze Active (BB fully inside KC)
⚫️ Gray = Neutral state (none of the above)
TTM Squeeze Trend (John Carter-style):
Calculates the difference in width between the Bollinger Bands and the Keltner Channel:
🟩 Green = BB width is greater than KC → potential expansion phase
🟥 Red = BB are tighter than KC → possible compression or pre-breakout
📈 Interpreting Signals
Depending on the active configuration, the indicator can provide various signals, including:
Trend color → Reflects the current compression/expansion state (based on selected mode)
Momentum value (above or below 0) → May indicate directional pressure
Signal Line cross → Can highlight momentum shifts
Color change in the momentum → May suggest a potential trend reversal
🛠 Integration with Other Tools
Squeeze Momentum Pro works well alongside other indicators to strengthen market context:
✅ Volume Profile / OBV – Helps confirm accumulation or distribution during squeezes
✅ RSI – Useful to detect divergence between momentum and price
✅ Moving Averages – Ideal for defining primary trend direction and filtering signals
☄️ If you find this indicator useful, leave a Boost to support its development!
Every piece of feedback helps improve the tool and deliver an even better trading experience.
🔥 Share your ideas or feature requests in the comments!

Momentum Candles by @PipsandProfitFXThe High Momentum Candles indicator highlights price bars with exceptional price movement and strong volume. It identifies candles with significantly long bodies relative to their shadows, indicating rapid price changes. Additionally, the indicator filters for candles with above-average volume to confirm the strength of the price movement.
Dark red: bearish momentum
Orange: bullish momentum
(You can easily change the momentum candles to whatever color you want in the indicator settings.)
By visually emphasizing these high momentum candles, traders can potentially identify potential trend reversals or continuations, as well as potential entry and exit points.
Key Features:
Identifies candles with large bodies relative to their shadows
Filters candles based on volume to confirm strength
Highlights high momentum candles with a distinct color
Let me know if you'd like to see any updates on this indicator.
Note: This indicator is a visual tool and should be used in conjunction with other technical analysis techniques for making informed trading decisions.
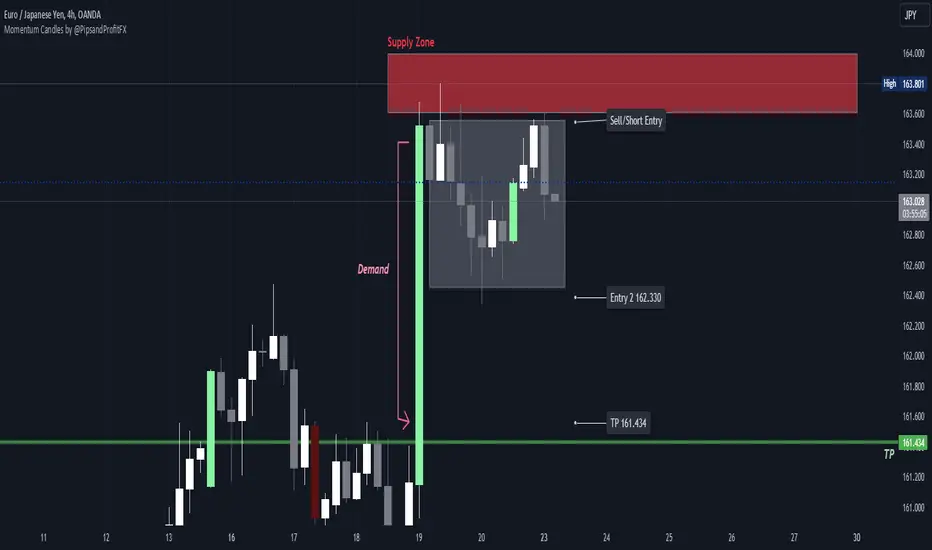
Momentum Channel - [Volume Filter]The indicator incorporates a volume filter to ensure that the RSI only moves when the volume is above the moving average of the volume.
The filtered RSI is then used to calculate the Bollinger Bands and moving averages, providing insights into the market dynamics.
It also gives you insight into the bigger timeframes so you can monitor momentum!
Volume Filter Length: Input parameter for the length of the volume filter moving average.
Overview of code:
rsiPeriod: Input parameter for the RSI period.
bandLength: Input parameter for the length of the Bollinger Bands.
lengthrsipl: Input parameter for the length of the fast moving average (MA) on the RSI.
volumeFilterLength: Input parameter for the length of the volume filter moving average.
volumeAvg: Calculates the moving average of the volume using the ta.sma() function with the specified volume filter length.
filteredRsi: Uses the ta.valuewhen() function to obtain the RSI value only when the volume is greater than or equal to the volume moving average. This creates a filtered RSI based on the volume filter.
offs: Calculates the offset value for the Bollinger Bands. It is derived by multiplying 1.6185 with the standard deviation of the filtered RSI using the ta.stdev() function.
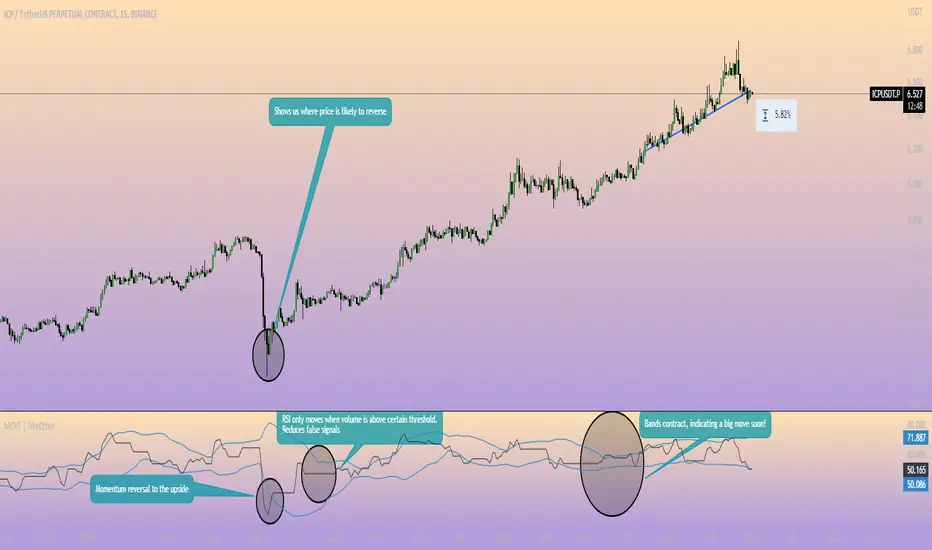
GKD-C Blau Stochastic Momentum Index [Loxx]Giga Kaleidoscope GKD-C Blau Stochastic Momentum Index is a Confirmation module included in Loxx's "Giga Kaleidoscope Modularized Trading System".
█ Giga Kaleidoscope Modularized Trading System
What is Loxx's "Giga Kaleidoscope Modularized Trading System"?
The Giga Kaleidoscope Modularized Trading System is a trading system built on the philosophy of the NNFX (No Nonsense Forex) algorithmic trading.
What is the NNFX algorithmic trading strategy?
The NNFX (No-Nonsense Forex) trading system is a comprehensive approach to Forex trading that is designed to simplify the process and remove the confusion and complexity that often surrounds trading. The system was developed by a Forex trader who goes by the pseudonym "VP" and has gained a significant following in the Forex community.
The NNFX trading system is based on a set of rules and guidelines that help traders make objective and informed decisions. These rules cover all aspects of trading, including market analysis, trade entry, stop loss placement, and trade management.
Here are the main components of the NNFX trading system:
1. Trading Philosophy: The NNFX trading system is based on the idea that successful trading requires a comprehensive understanding of the market, objective analysis, and strict risk management. The system aims to remove subjective elements from trading and focuses on objective rules and guidelines.
2. Technical Analysis: The NNFX trading system relies heavily on technical analysis and uses a range of indicators to identify high-probability trading opportunities. The system uses a combination of trend-following and mean-reverting strategies to identify trades.
3. Market Structure: The NNFX trading system emphasizes the importance of understanding the market structure, including price action, support and resistance levels, and market cycles. The system uses a range of tools to identify the market structure, including trend lines, channels, and moving averages.
4. Trade Entry: The NNFX trading system has strict rules for trade entry. The system uses a combination of technical indicators to identify high-probability trades, and traders must meet specific criteria to enter a trade.
5. Stop Loss Placement: The NNFX trading system places a significant emphasis on risk management and requires traders to place a stop loss order on every trade. The system uses a combination of technical analysis and market structure to determine the appropriate stop loss level.
6. Trade Management: The NNFX trading system has specific rules for managing open trades. The system aims to minimize risk and maximize profit by using a combination of trailing stops, take profit levels, and position sizing.
Overall, the NNFX trading system is designed to be a straightforward and easy-to-follow approach to Forex trading that can be applied by traders of all skill levels.
Core components of an NNFX algorithmic trading strategy
The NNFX algorithm is built on the principles of trend, momentum, and volatility. There are six core components in the NNFX trading algorithm:
1. Volatility - price volatility; e.g., Average True Range, True Range Double, Close-to-Close, etc.
2. Baseline - a moving average to identify price trend
3. Confirmation 1 - a technical indicator used to identify trends
4. Confirmation 2 - a technical indicator used to identify trends
5. Continuation - a technical indicator used to identify trends
6. Volatility/Volume - a technical indicator used to identify volatility/volume breakouts/breakdown
7. Exit - a technical indicator used to determine when a trend is exhausted
What is Volatility in the NNFX trading system?
In the NNFX (No Nonsense Forex) trading system, ATR (Average True Range) is typically used to measure the volatility of an asset. It is used as a part of the system to help determine the appropriate stop loss and take profit levels for a trade. ATR is calculated by taking the average of the true range values over a specified period.
True range is calculated as the maximum of the following values:
-Current high minus the current low
-Absolute value of the current high minus the previous close
-Absolute value of the current low minus the previous close
ATR is a dynamic indicator that changes with changes in volatility. As volatility increases, the value of ATR increases, and as volatility decreases, the value of ATR decreases. By using ATR in NNFX system, traders can adjust their stop loss and take profit levels according to the volatility of the asset being traded. This helps to ensure that the trade is given enough room to move, while also minimizing potential losses.
Other types of volatility include True Range Double (TRD), Close-to-Close, and Garman-Klass
What is a Baseline indicator?
The baseline is essentially a moving average, and is used to determine the overall direction of the market.
The baseline in the NNFX system is used to filter out trades that are not in line with the long-term trend of the market. The baseline is plotted on the chart along with other indicators, such as the Moving Average (MA), the Relative Strength Index (RSI), and the Average True Range (ATR).
Trades are only taken when the price is in the same direction as the baseline. For example, if the baseline is sloping upwards, only long trades are taken, and if the baseline is sloping downwards, only short trades are taken. This approach helps to ensure that trades are in line with the overall trend of the market, and reduces the risk of entering trades that are likely to fail.
By using a baseline in the NNFX system, traders can have a clear reference point for determining the overall trend of the market, and can make more informed trading decisions. The baseline helps to filter out noise and false signals, and ensures that trades are taken in the direction of the long-term trend.
What is a Confirmation indicator?
Confirmation indicators are technical indicators that are used to confirm the signals generated by primary indicators. Primary indicators are the core indicators used in the NNFX system, such as the Average True Range (ATR), the Moving Average (MA), and the Relative Strength Index (RSI).
The purpose of the confirmation indicators is to reduce false signals and improve the accuracy of the trading system. They are designed to confirm the signals generated by the primary indicators by providing additional information about the strength and direction of the trend.
Some examples of confirmation indicators that may be used in the NNFX system include the Bollinger Bands, the MACD (Moving Average Convergence Divergence), and the MACD Oscillator. These indicators can provide information about the volatility, momentum, and trend strength of the market, and can be used to confirm the signals generated by the primary indicators.
In the NNFX system, confirmation indicators are used in combination with primary indicators and other filters to create a trading system that is robust and reliable. By using multiple indicators to confirm trading signals, the system aims to reduce the risk of false signals and improve the overall profitability of the trades.
What is a Continuation indicator?
In the NNFX (No Nonsense Forex) trading system, a continuation indicator is a technical indicator that is used to confirm a current trend and predict that the trend is likely to continue in the same direction. A continuation indicator is typically used in conjunction with other indicators in the system, such as a baseline indicator, to provide a comprehensive trading strategy.
What is a Volatility/Volume indicator?
Volume indicators, such as the On Balance Volume (OBV), the Chaikin Money Flow (CMF), or the Volume Price Trend (VPT), are used to measure the amount of buying and selling activity in a market. They are based on the trading volume of the market, and can provide information about the strength of the trend. In the NNFX system, volume indicators are used to confirm trading signals generated by the Moving Average and the Relative Strength Index. Volatility indicators include Average Direction Index, Waddah Attar, and Volatility Ratio. In the NNFX trading system, volatility is a proxy for volume and vice versa.
By using volume indicators as confirmation tools, the NNFX trading system aims to reduce the risk of false signals and improve the overall profitability of trades. These indicators can provide additional information about the market that is not captured by the primary indicators, and can help traders to make more informed trading decisions. In addition, volume indicators can be used to identify potential changes in market trends and to confirm the strength of price movements.
What is an Exit indicator?
The exit indicator is used in conjunction with other indicators in the system, such as the Moving Average (MA), the Relative Strength Index (RSI), and the Average True Range (ATR), to provide a comprehensive trading strategy.
The exit indicator in the NNFX system can be any technical indicator that is deemed effective at identifying optimal exit points. Examples of exit indicators that are commonly used include the Parabolic SAR, the Average Directional Index (ADX), and the Chandelier Exit.
The purpose of the exit indicator is to identify when a trend is likely to reverse or when the market conditions have changed, signaling the need to exit a trade. By using an exit indicator, traders can manage their risk and prevent significant losses.
In the NNFX system, the exit indicator is used in conjunction with a stop loss and a take profit order to maximize profits and minimize losses. The stop loss order is used to limit the amount of loss that can be incurred if the trade goes against the trader, while the take profit order is used to lock in profits when the trade is moving in the trader's favor.
Overall, the use of an exit indicator in the NNFX trading system is an important component of a comprehensive trading strategy. It allows traders to manage their risk effectively and improve the profitability of their trades by exiting at the right time.
How does Loxx's GKD (Giga Kaleidoscope Modularized Trading System) implement the NNFX algorithm outlined above?
Loxx's GKD v1.0 system has five types of modules (indicators/strategies). These modules are:
1. GKD-BT - Backtesting module (Volatility, Number 1 in the NNFX algorithm)
2. GKD-B - Baseline module (Baseline and Volatility/Volume, Numbers 1 and 2 in the NNFX algorithm)
3. GKD-C - Confirmation 1/2 and Continuation module (Confirmation 1/2 and Continuation, Numbers 3, 4, and 5 in the NNFX algorithm)
4. GKD-V - Volatility/Volume module (Confirmation 1/2, Number 6 in the NNFX algorithm)
5. GKD-E - Exit module (Exit, Number 7 in the NNFX algorithm)
(additional module types will added in future releases)
Each module interacts with every module by passing data between modules. Data is passed between each module as described below:
GKD-B => GKD-V => GKD-C(1) => GKD-C(2) => GKD-C(Continuation) => GKD-E => GKD-BT
That is, the Baseline indicator passes its data to Volatility/Volume. The Volatility/Volume indicator passes its values to the Confirmation 1 indicator. The Confirmation 1 indicator passes its values to the Confirmation 2 indicator. The Confirmation 2 indicator passes its values to the Continuation indicator. The Continuation indicator passes its values to the Exit indicator, and finally, the Exit indicator passes its values to the Backtest strategy.
This chaining of indicators requires that each module conform to Loxx's GKD protocol, therefore allowing for the testing of every possible combination of technical indicators that make up the six components of the NNFX algorithm.
What does the application of the GKD trading system look like?
Example trading system:
Backtest: Strategy with 1-3 take profits, trailing stop loss, multiple types of PnL volatility, and 2 backtesting styles
Baseline: Hull Moving Average
Volatility/Volume: Hurst Exponent
Confirmation 1: Blau Stochastic Momentum Index as shown on the chart above
Confirmation 2: Williams Percent Range
Continuation: Fisher Transform
Exit: Rex Oscillator
Each GKD indicator is denoted with a module identifier of either: GKD-BT, GKD-B, GKD-C, GKD-V, or GKD-E. This allows traders to understand to which module each indicator belongs and where each indicator fits into the GKD protocol chain.
Giga Kaleidoscope Modularized Trading System Signals (based on the NNFX algorithm)
Standard Entry
1. GKD-C Confirmation 1 Signal
2. GKD-B Baseline agrees
3. Price is within a range of 0.2x Volatility and 1.0x Volatility of the Goldie Locks Mean
4. GKD-C Confirmation 2 agrees
5. GKD-V Volatility/Volume agrees
Baseline Entry
1. GKD-B Baseline signal
2. GKD-C Confirmation 1 agrees
3. Price is within a range of 0.2x Volatility and 1.0x Volatility of the Goldie Locks Mean
4. GKD-C Confirmation 2 agrees
5. GKD-V Volatility/Volume agrees
6. GKD-C Confirmation 1 signal was less than 7 candles prior
Continuation Entry
1. Standard Entry, Baseline Entry, or Pullback; entry triggered previously
2. GKD-B Baseline hasn't crossed since entry signal trigger
3. GKD-C Confirmation Continuation Indicator signals
4. GKD-C Confirmation 1 agrees
5. GKD-B Baseline agrees
6. GKD-C Confirmation 2 agrees
1-Candle Rule Standard Entry
1. GKD-C Confirmation 1 signal
2. GKD-B Baseline agrees
3. Price is within a range of 0.2x Volatility and 1.0x Volatility of the Goldie Locks Mean
Next Candle:
1. Price retraced (Long: close < close or Short: close > close )
2. GKD-B Baseline agrees
3. GKD-C Confirmation 1 agrees
4. GKD-C Confirmation 2 agrees
5. GKD-V Volatility/Volume agrees
1-Candle Rule Baseline Entry
1. GKD-B Baseline signal
2. GKD-C Confirmation 1 agrees
3. Price is within a range of 0.2x Volatility and 1.0x Volatility of the Goldie Locks Mean
4. GKD-C Confirmation 1 signal was less than 7 candles prior
Next Candle:
1. Price retraced (Long: close < close or Short: close > close )
2. GKD-B Baseline agrees
3. GKD-C Confirmation 1 agrees
4. GKD-C Confirmation 2 agrees
5. GKD-V Volatility/Volume Agrees
PullBack Entry
1. GKD-B Baseline signal
2. GKD-C Confirmation 1 agrees
3. Price is beyond 1.0x Volatility of Baseline
Next Candle:
1. Price is within a range of 0.2x Volatility and 1.0x Volatility of the Goldie Locks Mean
3. GKD-C Confirmation 1 agrees
4. GKD-C Confirmation 2 agrees
5. GKD-V Volatility/Volume Agrees
█ GKD-C Blau Stochastic Momentum Index
What is Blau Stochastic Momentum Index?
The Blau Stochastic Momentum Index (BSMI) is a technical analysis indicator used to measure momentum in financial markets. It was developed by William Blau, a well-known trader and author of several books on technical analysis.
The BSMI is based on the Stochastic Momentum Index (SMI), which is a popular momentum indicator that measures the distance between the current closing price and the recent high or low. The SMI is similar to the Stochastic Oscillator, but it takes into account the rate of change in the market, making it more responsive to short-term changes in momentum.
The BSMI is designed to provide a more accurate and responsive measure of momentum than the SMI. It uses a digital signal processing technique called "smoothed moving averages" to filter out noise and provide a smoother, more stable indicator. This technique helps to reduce false signals and provide a clearer picture of market momentum.
The BSMI indicator is plotted on a chart as a line that oscillates between -100 and +100. Values above zero indicate bullish momentum, while values below zero indicate bearish momentum. The BSMI line is typically plotted alongside the price chart to help traders identify potential turning points in the market.
Traders can use the BSMI indicator in a variety of ways, including:
1. Identifying overbought and oversold conditions: When the BSMI line reaches extreme values (e.g., above +80 or below -80), it may indicate that the market is overbought or oversold and due for a reversal.
2. Confirming trend strength: When the BSMI line is trending in the same direction as the price, it can confirm the strength of the trend and help traders stay in winning positions.
3. Identifying divergences: When the BSMI line and the price chart are moving in opposite directions, it may indicate a potential trend reversal or weakening of the current trend.
As with any technical indicator, it is important to use the BSMI in conjunction with other forms of analysis and risk management strategies. No single indicator can predict market movements with 100% accuracy, and traders should always use caution and discipline when making trading decisions.
Requirements
Inputs
Confirmation 1 and Solo Confirmation: GKD-V Volatility / Volume indicator
Confirmation 2: GKD-C Confirmation indicator
Outputs
Confirmation 2 and Solo Confirmation Complex: GKD-E Exit indicator
Confirmation 1: GKD-C Confirmation indicator
Continuation: GKD-E Exit indicator
Solo Confirmation Simple: GKD-BT Backtest strategy
Additional features will be added in future releases.
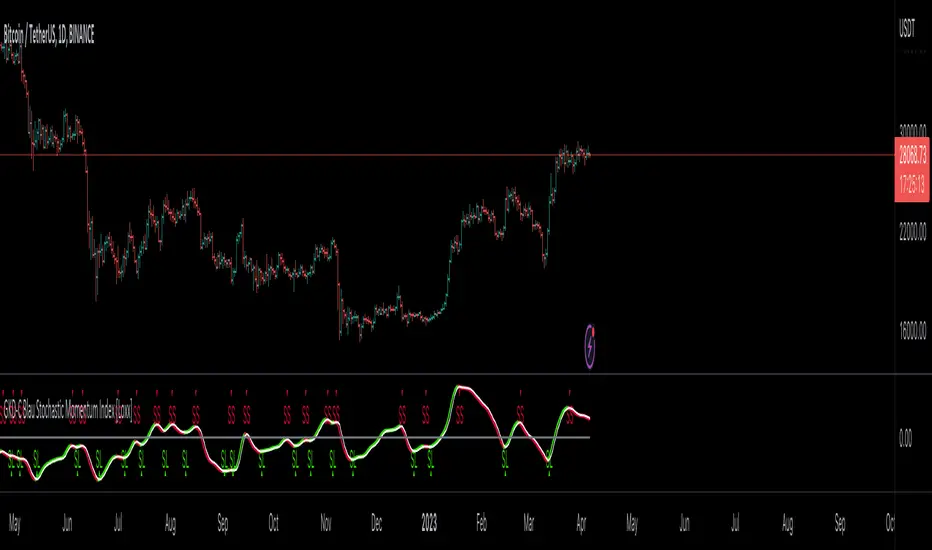
GKD-C Blau Stochastic Momentum [Loxx]Giga Kaleidoscope GKD-C Blau Stochastic Momentum is a Confirmation module included in Loxx's "Giga Kaleidoscope Modularized Trading System".
█ Giga Kaleidoscope Modularized Trading System
What is Loxx's "Giga Kaleidoscope Modularized Trading System"?
The Giga Kaleidoscope Modularized Trading System is a trading system built on the philosophy of the NNFX (No Nonsense Forex) algorithmic trading.
What is the NNFX algorithmic trading strategy?
The NNFX (No-Nonsense Forex) trading system is a comprehensive approach to Forex trading that is designed to simplify the process and remove the confusion and complexity that often surrounds trading. The system was developed by a Forex trader who goes by the pseudonym "VP" and has gained a significant following in the Forex community.
The NNFX trading system is based on a set of rules and guidelines that help traders make objective and informed decisions. These rules cover all aspects of trading, including market analysis, trade entry, stop loss placement, and trade management.
Here are the main components of the NNFX trading system:
1. Trading Philosophy: The NNFX trading system is based on the idea that successful trading requires a comprehensive understanding of the market, objective analysis, and strict risk management. The system aims to remove subjective elements from trading and focuses on objective rules and guidelines.
2. Technical Analysis: The NNFX trading system relies heavily on technical analysis and uses a range of indicators to identify high-probability trading opportunities. The system uses a combination of trend-following and mean-reverting strategies to identify trades.
3. Market Structure: The NNFX trading system emphasizes the importance of understanding the market structure, including price action, support and resistance levels, and market cycles. The system uses a range of tools to identify the market structure, including trend lines, channels, and moving averages.
4. Trade Entry: The NNFX trading system has strict rules for trade entry. The system uses a combination of technical indicators to identify high-probability trades, and traders must meet specific criteria to enter a trade.
5. Stop Loss Placement: The NNFX trading system places a significant emphasis on risk management and requires traders to place a stop loss order on every trade. The system uses a combination of technical analysis and market structure to determine the appropriate stop loss level.
6. Trade Management: The NNFX trading system has specific rules for managing open trades. The system aims to minimize risk and maximize profit by using a combination of trailing stops, take profit levels, and position sizing.
Overall, the NNFX trading system is designed to be a straightforward and easy-to-follow approach to Forex trading that can be applied by traders of all skill levels.
Core components of an NNFX algorithmic trading strategy
The NNFX algorithm is built on the principles of trend, momentum, and volatility. There are six core components in the NNFX trading algorithm:
1. Volatility - price volatility; e.g., Average True Range, True Range Double, Close-to-Close, etc.
2. Baseline - a moving average to identify price trend
3. Confirmation 1 - a technical indicator used to identify trends
4. Confirmation 2 - a technical indicator used to identify trends
5. Continuation - a technical indicator used to identify trends
6. Volatility/Volume - a technical indicator used to identify volatility/volume breakouts/breakdown
7. Exit - a technical indicator used to determine when a trend is exhausted
What is Volatility in the NNFX trading system?
In the NNFX (No Nonsense Forex) trading system, ATR (Average True Range) is typically used to measure the volatility of an asset. It is used as a part of the system to help determine the appropriate stop loss and take profit levels for a trade. ATR is calculated by taking the average of the true range values over a specified period.
True range is calculated as the maximum of the following values:
-Current high minus the current low
-Absolute value of the current high minus the previous close
-Absolute value of the current low minus the previous close
ATR is a dynamic indicator that changes with changes in volatility. As volatility increases, the value of ATR increases, and as volatility decreases, the value of ATR decreases. By using ATR in NNFX system, traders can adjust their stop loss and take profit levels according to the volatility of the asset being traded. This helps to ensure that the trade is given enough room to move, while also minimizing potential losses.
Other types of volatility include True Range Double (TRD), Close-to-Close, and Garman-Klass
What is a Baseline indicator?
The baseline is essentially a moving average, and is used to determine the overall direction of the market.
The baseline in the NNFX system is used to filter out trades that are not in line with the long-term trend of the market. The baseline is plotted on the chart along with other indicators, such as the Moving Average (MA), the Relative Strength Index (RSI), and the Average True Range (ATR).
Trades are only taken when the price is in the same direction as the baseline. For example, if the baseline is sloping upwards, only long trades are taken, and if the baseline is sloping downwards, only short trades are taken. This approach helps to ensure that trades are in line with the overall trend of the market, and reduces the risk of entering trades that are likely to fail.
By using a baseline in the NNFX system, traders can have a clear reference point for determining the overall trend of the market, and can make more informed trading decisions. The baseline helps to filter out noise and false signals, and ensures that trades are taken in the direction of the long-term trend.
What is a Confirmation indicator?
Confirmation indicators are technical indicators that are used to confirm the signals generated by primary indicators. Primary indicators are the core indicators used in the NNFX system, such as the Average True Range (ATR), the Moving Average (MA), and the Relative Strength Index (RSI).
The purpose of the confirmation indicators is to reduce false signals and improve the accuracy of the trading system. They are designed to confirm the signals generated by the primary indicators by providing additional information about the strength and direction of the trend.
Some examples of confirmation indicators that may be used in the NNFX system include the Bollinger Bands, the MACD (Moving Average Convergence Divergence), and the MACD Oscillator. These indicators can provide information about the volatility, momentum, and trend strength of the market, and can be used to confirm the signals generated by the primary indicators.
In the NNFX system, confirmation indicators are used in combination with primary indicators and other filters to create a trading system that is robust and reliable. By using multiple indicators to confirm trading signals, the system aims to reduce the risk of false signals and improve the overall profitability of the trades.
What is a Continuation indicator?
In the NNFX (No Nonsense Forex) trading system, a continuation indicator is a technical indicator that is used to confirm a current trend and predict that the trend is likely to continue in the same direction. A continuation indicator is typically used in conjunction with other indicators in the system, such as a baseline indicator, to provide a comprehensive trading strategy.
What is a Volatility/Volume indicator?
Volume indicators, such as the On Balance Volume (OBV), the Chaikin Money Flow (CMF), or the Volume Price Trend (VPT), are used to measure the amount of buying and selling activity in a market. They are based on the trading volume of the market, and can provide information about the strength of the trend. In the NNFX system, volume indicators are used to confirm trading signals generated by the Moving Average and the Relative Strength Index. Volatility indicators include Average Direction Index, Waddah Attar, and Volatility Ratio. In the NNFX trading system, volatility is a proxy for volume and vice versa.
By using volume indicators as confirmation tools, the NNFX trading system aims to reduce the risk of false signals and improve the overall profitability of trades. These indicators can provide additional information about the market that is not captured by the primary indicators, and can help traders to make more informed trading decisions. In addition, volume indicators can be used to identify potential changes in market trends and to confirm the strength of price movements.
What is an Exit indicator?
The exit indicator is used in conjunction with other indicators in the system, such as the Moving Average (MA), the Relative Strength Index (RSI), and the Average True Range (ATR), to provide a comprehensive trading strategy.
The exit indicator in the NNFX system can be any technical indicator that is deemed effective at identifying optimal exit points. Examples of exit indicators that are commonly used include the Parabolic SAR, the Average Directional Index (ADX), and the Chandelier Exit.
The purpose of the exit indicator is to identify when a trend is likely to reverse or when the market conditions have changed, signaling the need to exit a trade. By using an exit indicator, traders can manage their risk and prevent significant losses.
In the NNFX system, the exit indicator is used in conjunction with a stop loss and a take profit order to maximize profits and minimize losses. The stop loss order is used to limit the amount of loss that can be incurred if the trade goes against the trader, while the take profit order is used to lock in profits when the trade is moving in the trader's favor.
Overall, the use of an exit indicator in the NNFX trading system is an important component of a comprehensive trading strategy. It allows traders to manage their risk effectively and improve the profitability of their trades by exiting at the right time.
How does Loxx's GKD (Giga Kaleidoscope Modularized Trading System) implement the NNFX algorithm outlined above?
Loxx's GKD v1.0 system has five types of modules (indicators/strategies). These modules are:
1. GKD-BT - Backtesting module (Volatility, Number 1 in the NNFX algorithm)
2. GKD-B - Baseline module (Baseline and Volatility/Volume, Numbers 1 and 2 in the NNFX algorithm)
3. GKD-C - Confirmation 1/2 and Continuation module (Confirmation 1/2 and Continuation, Numbers 3, 4, and 5 in the NNFX algorithm)
4. GKD-V - Volatility/Volume module (Confirmation 1/2, Number 6 in the NNFX algorithm)
5. GKD-E - Exit module (Exit, Number 7 in the NNFX algorithm)
(additional module types will added in future releases)
Each module interacts with every module by passing data between modules. Data is passed between each module as described below:
GKD-B => GKD-V => GKD-C(1) => GKD-C(2) => GKD-C(Continuation) => GKD-E => GKD-BT
That is, the Baseline indicator passes its data to Volatility/Volume. The Volatility/Volume indicator passes its values to the Confirmation 1 indicator. The Confirmation 1 indicator passes its values to the Confirmation 2 indicator. The Confirmation 2 indicator passes its values to the Continuation indicator. The Continuation indicator passes its values to the Exit indicator, and finally, the Exit indicator passes its values to the Backtest strategy.
This chaining of indicators requires that each module conform to Loxx's GKD protocol, therefore allowing for the testing of every possible combination of technical indicators that make up the six components of the NNFX algorithm.
What does the application of the GKD trading system look like?
Example trading system:
Backtest: Strategy with 1-3 take profits, trailing stop loss, multiple types of PnL volatility, and 2 backtesting styles
Baseline: Hull Moving Average
Volatility/Volume: Hurst Exponent
Confirmation 1: Blau Stochastic Momentum as shown on the chart above
Confirmation 2: Williams Percent Range
Continuation: Fisher Transform
Exit: Rex Oscillator
Each GKD indicator is denoted with a module identifier of either: GKD-BT, GKD-B, GKD-C, GKD-V, or GKD-E. This allows traders to understand to which module each indicator belongs and where each indicator fits into the GKD protocol chain.
Giga Kaleidoscope Modularized Trading System Signals (based on the NNFX algorithm)
Standard Entry
1. GKD-C Confirmation 1 Signal
2. GKD-B Baseline agrees
3. Price is within a range of 0.2x Volatility and 1.0x Volatility of the Goldie Locks Mean
4. GKD-C Confirmation 2 agrees
5. GKD-V Volatility/Volume agrees
Baseline Entry
1. GKD-B Baseline signal
2. GKD-C Confirmation 1 agrees
3. Price is within a range of 0.2x Volatility and 1.0x Volatility of the Goldie Locks Mean
4. GKD-C Confirmation 2 agrees
5. GKD-V Volatility/Volume agrees
6. GKD-C Confirmation 1 signal was less than 7 candles prior
Continuation Entry
1. Standard Entry, Baseline Entry, or Pullback; entry triggered previously
2. GKD-B Baseline hasn't crossed since entry signal trigger
3. GKD-C Confirmation Continuation Indicator signals
4. GKD-C Confirmation 1 agrees
5. GKD-B Baseline agrees
6. GKD-C Confirmation 2 agrees
1-Candle Rule Standard Entry
1. GKD-C Confirmation 1 signal
2. GKD-B Baseline agrees
3. Price is within a range of 0.2x Volatility and 1.0x Volatility of the Goldie Locks Mean
Next Candle:
1. Price retraced (Long: close < close or Short: close > close )
2. GKD-B Baseline agrees
3. GKD-C Confirmation 1 agrees
4. GKD-C Confirmation 2 agrees
5. GKD-V Volatility/Volume agrees
1-Candle Rule Baseline Entry
1. GKD-B Baseline signal
2. GKD-C Confirmation 1 agrees
3. Price is within a range of 0.2x Volatility and 1.0x Volatility of the Goldie Locks Mean
4. GKD-C Confirmation 1 signal was less than 7 candles prior
Next Candle:
1. Price retraced (Long: close < close or Short: close > close )
2. GKD-B Baseline agrees
3. GKD-C Confirmation 1 agrees
4. GKD-C Confirmation 2 agrees
5. GKD-V Volatility/Volume Agrees
PullBack Entry
1. GKD-B Baseline signal
2. GKD-C Confirmation 1 agrees
3. Price is beyond 1.0x Volatility of Baseline
Next Candle:
1. Price is within a range of 0.2x Volatility and 1.0x Volatility of the Goldie Locks Mean
3. GKD-C Confirmation 1 agrees
4. GKD-C Confirmation 2 agrees
5. GKD-V Volatility/Volume Agrees
█ GKD-C Blau Stochastic Momentum
What is Blau Stochastic Momentum?
Blau Stochastic Momentum (BSM) is a technical analysis indicator used to measure the momentum of a financial market. It was developed by William Blau, a well-known trader and author of several books on technical analysis.
The BSM indicator is based on the Stochastic Momentum Index (SMI), which is a popular momentum indicator that measures the distance between the current closing price and the recent high or low. The SMI is similar to the Stochastic Oscillator, but it takes into account the rate of change in the market, making it more responsive to short-term changes in momentum.
The BSM indicator is designed to provide a more accurate and responsive measure of momentum than the SMI. It uses a digital signal processing technique called "smoothed moving averages" to filter out noise and provide a smoother, more stable indicator. This technique helps to reduce false signals and provide a clearer picture of market momentum.
The BSM indicator is plotted on a chart as a line that oscillates between -100 and +100. Values above zero indicate bullish momentum, while values below zero indicate bearish momentum. The BSM line is typically plotted alongside the price chart to help traders identify potential turning points in the market.
Traders can use the BSM indicator in a variety of ways, including:
1. Identifying overbought and oversold conditions: When the BSM line reaches extreme values (e.g., above +80 or below -80), it may indicate that the market is overbought or oversold and due for a reversal.
2. Confirming trend strength: When the BSM line is trending in the same direction as the price, it can confirm the strength of the trend and help traders stay in winning positions.
3. Identifying divergences: When the BSM line and the price chart are moving in opposite directions, it may indicate a potential trend reversal or weakening of the current trend.
As with any technical indicator, it is important to use the BSM in conjunction with other forms of analysis and risk management strategies. No single indicator can predict market movements with 100% accuracy, and traders should always use caution and discipline when making trading decisions.
Requirements
Inputs
Confirmation 1 and Solo Confirmation: GKD-V Volatility / Volume indicator
Confirmation 2: GKD-C Confirmation indicator
Outputs
Confirmation 2 and Solo Confirmation Complex: GKD-E Exit indicator
Confirmation 1: GKD-C Confirmation indicator
Continuation: GKD-E Exit indicator
Solo Confirmation Simple: GKD-BT Backtest strategy
Additional features will be added in future releases.

GKD-C Blau Momentum [Loxx]Giga Kaleidoscope GKD-C Blau Momentum is a Confirmation module included in Loxx's "Giga Kaleidoscope Modularized Trading System".
█ Giga Kaleidoscope Modularized Trading System
What is Loxx's "Giga Kaleidoscope Modularized Trading System"?
The Giga Kaleidoscope Modularized Trading System is a trading system built on the philosophy of the NNFX (No Nonsense Forex) algorithmic trading.
What is the NNFX algorithmic trading strategy?
The NNFX (No-Nonsense Forex) trading system is a comprehensive approach to Forex trading that is designed to simplify the process and remove the confusion and complexity that often surrounds trading. The system was developed by a Forex trader who goes by the pseudonym "VP" and has gained a significant following in the Forex community.
The NNFX trading system is based on a set of rules and guidelines that help traders make objective and informed decisions. These rules cover all aspects of trading, including market analysis, trade entry, stop loss placement, and trade management.
Here are the main components of the NNFX trading system:
1. Trading Philosophy: The NNFX trading system is based on the idea that successful trading requires a comprehensive understanding of the market, objective analysis, and strict risk management. The system aims to remove subjective elements from trading and focuses on objective rules and guidelines.
2. Technical Analysis: The NNFX trading system relies heavily on technical analysis and uses a range of indicators to identify high-probability trading opportunities. The system uses a combination of trend-following and mean-reverting strategies to identify trades.
3. Market Structure: The NNFX trading system emphasizes the importance of understanding the market structure, including price action, support and resistance levels, and market cycles. The system uses a range of tools to identify the market structure, including trend lines, channels, and moving averages.
4. Trade Entry: The NNFX trading system has strict rules for trade entry. The system uses a combination of technical indicators to identify high-probability trades, and traders must meet specific criteria to enter a trade.
5. Stop Loss Placement: The NNFX trading system places a significant emphasis on risk management and requires traders to place a stop loss order on every trade. The system uses a combination of technical analysis and market structure to determine the appropriate stop loss level.
6. Trade Management: The NNFX trading system has specific rules for managing open trades. The system aims to minimize risk and maximize profit by using a combination of trailing stops, take profit levels, and position sizing.
Overall, the NNFX trading system is designed to be a straightforward and easy-to-follow approach to Forex trading that can be applied by traders of all skill levels.
Core components of an NNFX algorithmic trading strategy
The NNFX algorithm is built on the principles of trend, momentum, and volatility. There are six core components in the NNFX trading algorithm:
1. Volatility - price volatility; e.g., Average True Range, True Range Double, Close-to-Close, etc.
2. Baseline - a moving average to identify price trend
3. Confirmation 1 - a technical indicator used to identify trends
4. Confirmation 2 - a technical indicator used to identify trends
5. Continuation - a technical indicator used to identify trends
6. Volatility/Volume - a technical indicator used to identify volatility/volume breakouts/breakdown
7. Exit - a technical indicator used to determine when a trend is exhausted
What is Volatility in the NNFX trading system?
In the NNFX (No Nonsense Forex) trading system, ATR (Average True Range) is typically used to measure the volatility of an asset. It is used as a part of the system to help determine the appropriate stop loss and take profit levels for a trade. ATR is calculated by taking the average of the true range values over a specified period.
True range is calculated as the maximum of the following values:
-Current high minus the current low
-Absolute value of the current high minus the previous close
-Absolute value of the current low minus the previous close
ATR is a dynamic indicator that changes with changes in volatility. As volatility increases, the value of ATR increases, and as volatility decreases, the value of ATR decreases. By using ATR in NNFX system, traders can adjust their stop loss and take profit levels according to the volatility of the asset being traded. This helps to ensure that the trade is given enough room to move, while also minimizing potential losses.
Other types of volatility include True Range Double (TRD), Close-to-Close, and Garman-Klass
What is a Baseline indicator?
The baseline is essentially a moving average, and is used to determine the overall direction of the market.
The baseline in the NNFX system is used to filter out trades that are not in line with the long-term trend of the market. The baseline is plotted on the chart along with other indicators, such as the Moving Average (MA), the Relative Strength Index (RSI), and the Average True Range (ATR).
Trades are only taken when the price is in the same direction as the baseline. For example, if the baseline is sloping upwards, only long trades are taken, and if the baseline is sloping downwards, only short trades are taken. This approach helps to ensure that trades are in line with the overall trend of the market, and reduces the risk of entering trades that are likely to fail.
By using a baseline in the NNFX system, traders can have a clear reference point for determining the overall trend of the market, and can make more informed trading decisions. The baseline helps to filter out noise and false signals, and ensures that trades are taken in the direction of the long-term trend.
What is a Confirmation indicator?
Confirmation indicators are technical indicators that are used to confirm the signals generated by primary indicators. Primary indicators are the core indicators used in the NNFX system, such as the Average True Range (ATR), the Moving Average (MA), and the Relative Strength Index (RSI).
The purpose of the confirmation indicators is to reduce false signals and improve the accuracy of the trading system. They are designed to confirm the signals generated by the primary indicators by providing additional information about the strength and direction of the trend.
Some examples of confirmation indicators that may be used in the NNFX system include the Bollinger Bands, the MACD (Moving Average Convergence Divergence), and the MACD Oscillator. These indicators can provide information about the volatility, momentum, and trend strength of the market, and can be used to confirm the signals generated by the primary indicators.
In the NNFX system, confirmation indicators are used in combination with primary indicators and other filters to create a trading system that is robust and reliable. By using multiple indicators to confirm trading signals, the system aims to reduce the risk of false signals and improve the overall profitability of the trades.
What is a Continuation indicator?
In the NNFX (No Nonsense Forex) trading system, a continuation indicator is a technical indicator that is used to confirm a current trend and predict that the trend is likely to continue in the same direction. A continuation indicator is typically used in conjunction with other indicators in the system, such as a baseline indicator, to provide a comprehensive trading strategy.
What is a Volatility/Volume indicator?
Volume indicators, such as the On Balance Volume (OBV), the Chaikin Money Flow (CMF), or the Volume Price Trend (VPT), are used to measure the amount of buying and selling activity in a market. They are based on the trading volume of the market, and can provide information about the strength of the trend. In the NNFX system, volume indicators are used to confirm trading signals generated by the Moving Average and the Relative Strength Index. Volatility indicators include Average Direction Index, Waddah Attar, and Volatility Ratio. In the NNFX trading system, volatility is a proxy for volume and vice versa.
By using volume indicators as confirmation tools, the NNFX trading system aims to reduce the risk of false signals and improve the overall profitability of trades. These indicators can provide additional information about the market that is not captured by the primary indicators, and can help traders to make more informed trading decisions. In addition, volume indicators can be used to identify potential changes in market trends and to confirm the strength of price movements.
What is an Exit indicator?
The exit indicator is used in conjunction with other indicators in the system, such as the Moving Average (MA), the Relative Strength Index (RSI), and the Average True Range (ATR), to provide a comprehensive trading strategy.
The exit indicator in the NNFX system can be any technical indicator that is deemed effective at identifying optimal exit points. Examples of exit indicators that are commonly used include the Parabolic SAR, the Average Directional Index (ADX), and the Chandelier Exit.
The purpose of the exit indicator is to identify when a trend is likely to reverse or when the market conditions have changed, signaling the need to exit a trade. By using an exit indicator, traders can manage their risk and prevent significant losses.
In the NNFX system, the exit indicator is used in conjunction with a stop loss and a take profit order to maximize profits and minimize losses. The stop loss order is used to limit the amount of loss that can be incurred if the trade goes against the trader, while the take profit order is used to lock in profits when the trade is moving in the trader's favor.
Overall, the use of an exit indicator in the NNFX trading system is an important component of a comprehensive trading strategy. It allows traders to manage their risk effectively and improve the profitability of their trades by exiting at the right time.
How does Loxx's GKD (Giga Kaleidoscope Modularized Trading System) implement the NNFX algorithm outlined above?
Loxx's GKD v1.0 system has five types of modules (indicators/strategies). These modules are:
1. GKD-BT - Backtesting module (Volatility, Number 1 in the NNFX algorithm)
2. GKD-B - Baseline module (Baseline and Volatility/Volume, Numbers 1 and 2 in the NNFX algorithm)
3. GKD-C - Confirmation 1/2 and Continuation module (Confirmation 1/2 and Continuation, Numbers 3, 4, and 5 in the NNFX algorithm)
4. GKD-V - Volatility/Volume module (Confirmation 1/2, Number 6 in the NNFX algorithm)
5. GKD-E - Exit module (Exit, Number 7 in the NNFX algorithm)
(additional module types will added in future releases)
Each module interacts with every module by passing data between modules. Data is passed between each module as described below:
GKD-B => GKD-V => GKD-C(1) => GKD-C(2) => GKD-C(Continuation) => GKD-E => GKD-BT
That is, the Baseline indicator passes its data to Volatility/Volume. The Volatility/Volume indicator passes its values to the Confirmation 1 indicator. The Confirmation 1 indicator passes its values to the Confirmation 2 indicator. The Confirmation 2 indicator passes its values to the Continuation indicator. The Continuation indicator passes its values to the Exit indicator, and finally, the Exit indicator passes its values to the Backtest strategy.
This chaining of indicators requires that each module conform to Loxx's GKD protocol, therefore allowing for the testing of every possible combination of technical indicators that make up the six components of the NNFX algorithm.
What does the application of the GKD trading system look like?
Example trading system:
Backtest: Strategy with 1-3 take profits, trailing stop loss, multiple types of PnL volatility, and 2 backtesting styles
Baseline: Hull Moving Average
Volatility/Volume: Hurst Exponent
Confirmation 1: Blau Momentum as shown on the chart above
Confirmation 2: Williams Percent Range
Continuation: Fisher Transform
Exit: Rex Oscillator
Each GKD indicator is denoted with a module identifier of either: GKD-BT, GKD-B, GKD-C, GKD-V, or GKD-E. This allows traders to understand to which module each indicator belongs and where each indicator fits into the GKD protocol chain.
Giga Kaleidoscope Modularized Trading System Signals (based on the NNFX algorithm)
Standard Entry
1. GKD-C Confirmation 1 Signal
2. GKD-B Baseline agrees
3. Price is within a range of 0.2x Volatility and 1.0x Volatility of the Goldie Locks Mean
4. GKD-C Confirmation 2 agrees
5. GKD-V Volatility/Volume agrees
Baseline Entry
1. GKD-B Baseline signal
2. GKD-C Confirmation 1 agrees
3. Price is within a range of 0.2x Volatility and 1.0x Volatility of the Goldie Locks Mean
4. GKD-C Confirmation 2 agrees
5. GKD-V Volatility/Volume agrees
6. GKD-C Confirmation 1 signal was less than 7 candles prior
Continuation Entry
1. Standard Entry, Baseline Entry, or Pullback; entry triggered previously
2. GKD-B Baseline hasn't crossed since entry signal trigger
3. GKD-C Confirmation Continuation Indicator signals
4. GKD-C Confirmation 1 agrees
5. GKD-B Baseline agrees
6. GKD-C Confirmation 2 agrees
1-Candle Rule Standard Entry
1. GKD-C Confirmation 1 signal
2. GKD-B Baseline agrees
3. Price is within a range of 0.2x Volatility and 1.0x Volatility of the Goldie Locks Mean
Next Candle:
1. Price retraced (Long: close < close or Short: close > close )
2. GKD-B Baseline agrees
3. GKD-C Confirmation 1 agrees
4. GKD-C Confirmation 2 agrees
5. GKD-V Volatility/Volume agrees
1-Candle Rule Baseline Entry
1. GKD-B Baseline signal
2. GKD-C Confirmation 1 agrees
3. Price is within a range of 0.2x Volatility and 1.0x Volatility of the Goldie Locks Mean
4. GKD-C Confirmation 1 signal was less than 7 candles prior
Next Candle:
1. Price retraced (Long: close < close or Short: close > close )
2. GKD-B Baseline agrees
3. GKD-C Confirmation 1 agrees
4. GKD-C Confirmation 2 agrees
5. GKD-V Volatility/Volume Agrees
PullBack Entry
1. GKD-B Baseline signal
2. GKD-C Confirmation 1 agrees
3. Price is beyond 1.0x Volatility of Baseline
Next Candle:
1. Price is within a range of 0.2x Volatility and 1.0x Volatility of the Goldie Locks Mean
3. GKD-C Confirmation 1 agrees
4. GKD-C Confirmation 2 agrees
5. GKD-V Volatility/Volume Agrees
█ GKD-C Blau Momentum
What is Blau Momentum?
The Blau Momentum Indicator is a technical analysis tool that is used to analyze the momentum of a financial instrument, such as a stock or a currency. Developed by William Blau, the indicator is designed to provide a more accurate and timely picture of market momentum than traditional momentum indicators.
The Blau Momentum Indicator is based on the concept of "smoothed momentum," which is the idea that momentum can be more accurately analyzed by smoothing out the data and reducing noise. The indicator is designed to be highly responsive to changes in market conditions, while also providing a more accurate picture of underlying momentum.
The Blau Momentum Indicator is calculated using a complex formula that takes into account the price and volume data of a financial instrument. The formula is designed to provide a smoothed measure of momentum that is less susceptible to short-term fluctuations and noise.
The indicator is plotted as a line graph, with values ranging from -100 to +100. A value of 0 indicates that the momentum is neutral, while a positive value indicates upward momentum and a negative value indicates downward momentum.
Traders can use the Blau Momentum Indicator in a number of ways. For example, the indicator can be used to confirm the direction of a trend, or to identify potential trend reversals. It can also be used in conjunction with other technical indicators, such as moving averages or oscillators, to provide a more complete picture of market conditions.
Overall, the Blau Momentum Indicator is a powerful tool for analyzing market momentum. While it may require some knowledge of technical analysis to use effectively, the indicator can provide valuable insights into market conditions and help traders make informed trading decisions.
Requirements
Inputs
Confirmation 1 and Solo Confirmation: GKD-V Volatility / Volume indicator
Confirmation 2: GKD-C Confirmation indicator
Outputs
Confirmation 2 and Solo Confirmation Complex: GKD-E Exit indicator
Confirmation 1: GKD-C Confirmation indicator
Continuation: GKD-E Exit indicator
Solo Confirmation Simple: GKD-BT Backtest strategy
Additional features will be added in future releases.

GKD-C Blau Composite High-Low Momentum [Loxx]Giga Kaleidoscope GKD-C Blau Composite High-Low Momentum is a Confirmation module included in Loxx's "Giga Kaleidoscope Modularized Trading System".
█ Giga Kaleidoscope Modularized Trading System
What is Loxx's "Giga Kaleidoscope Modularized Trading System"?
The Giga Kaleidoscope Modularized Trading System is a trading system built on the philosophy of the NNFX (No Nonsense Forex) algorithmic trading.
What is the NNFX algorithmic trading strategy?
The NNFX (No-Nonsense Forex) trading system is a comprehensive approach to Forex trading that is designed to simplify the process and remove the confusion and complexity that often surrounds trading. The system was developed by a Forex trader who goes by the pseudonym "VP" and has gained a significant following in the Forex community.
The NNFX trading system is based on a set of rules and guidelines that help traders make objective and informed decisions. These rules cover all aspects of trading, including market analysis, trade entry, stop loss placement, and trade management.
Here are the main components of the NNFX trading system:
1. Trading Philosophy: The NNFX trading system is based on the idea that successful trading requires a comprehensive understanding of the market, objective analysis, and strict risk management. The system aims to remove subjective elements from trading and focuses on objective rules and guidelines.
2. Technical Analysis: The NNFX trading system relies heavily on technical analysis and uses a range of indicators to identify high-probability trading opportunities. The system uses a combination of trend-following and mean-reverting strategies to identify trades.
3. Market Structure: The NNFX trading system emphasizes the importance of understanding the market structure, including price action, support and resistance levels, and market cycles. The system uses a range of tools to identify the market structure, including trend lines, channels, and moving averages.
4. Trade Entry: The NNFX trading system has strict rules for trade entry. The system uses a combination of technical indicators to identify high-probability trades, and traders must meet specific criteria to enter a trade.
5. Stop Loss Placement: The NNFX trading system places a significant emphasis on risk management and requires traders to place a stop loss order on every trade. The system uses a combination of technical analysis and market structure to determine the appropriate stop loss level.
6. Trade Management: The NNFX trading system has specific rules for managing open trades. The system aims to minimize risk and maximize profit by using a combination of trailing stops, take profit levels, and position sizing.
Overall, the NNFX trading system is designed to be a straightforward and easy-to-follow approach to Forex trading that can be applied by traders of all skill levels.
Core components of an NNFX algorithmic trading strategy
The NNFX algorithm is built on the principles of trend, momentum, and volatility. There are six core components in the NNFX trading algorithm:
1. Volatility - price volatility; e.g., Average True Range, True Range Double, Close-to-Close, etc.
2. Baseline - a moving average to identify price trend
3. Confirmation 1 - a technical indicator used to identify trends
4. Confirmation 2 - a technical indicator used to identify trends
5. Continuation - a technical indicator used to identify trends
6. Volatility/Volume - a technical indicator used to identify volatility/volume breakouts/breakdown
7. Exit - a technical indicator used to determine when a trend is exhausted
What is Volatility in the NNFX trading system?
In the NNFX (No Nonsense Forex) trading system, ATR (Average True Range) is typically used to measure the volatility of an asset. It is used as a part of the system to help determine the appropriate stop loss and take profit levels for a trade. ATR is calculated by taking the average of the true range values over a specified period.
True range is calculated as the maximum of the following values:
-Current high minus the current low
-Absolute value of the current high minus the previous close
-Absolute value of the current low minus the previous close
ATR is a dynamic indicator that changes with changes in volatility. As volatility increases, the value of ATR increases, and as volatility decreases, the value of ATR decreases. By using ATR in NNFX system, traders can adjust their stop loss and take profit levels according to the volatility of the asset being traded. This helps to ensure that the trade is given enough room to move, while also minimizing potential losses.
Other types of volatility include True Range Double (TRD), Close-to-Close, and Garman-Klass
What is a Baseline indicator?
The baseline is essentially a moving average, and is used to determine the overall direction of the market.
The baseline in the NNFX system is used to filter out trades that are not in line with the long-term trend of the market. The baseline is plotted on the chart along with other indicators, such as the Moving Average (MA), the Relative Strength Index (RSI), and the Average True Range (ATR).
Trades are only taken when the price is in the same direction as the baseline. For example, if the baseline is sloping upwards, only long trades are taken, and if the baseline is sloping downwards, only short trades are taken. This approach helps to ensure that trades are in line with the overall trend of the market, and reduces the risk of entering trades that are likely to fail.
By using a baseline in the NNFX system, traders can have a clear reference point for determining the overall trend of the market, and can make more informed trading decisions. The baseline helps to filter out noise and false signals, and ensures that trades are taken in the direction of the long-term trend.
What is a Confirmation indicator?
Confirmation indicators are technical indicators that are used to confirm the signals generated by primary indicators. Primary indicators are the core indicators used in the NNFX system, such as the Average True Range (ATR), the Moving Average (MA), and the Relative Strength Index (RSI).
The purpose of the confirmation indicators is to reduce false signals and improve the accuracy of the trading system. They are designed to confirm the signals generated by the primary indicators by providing additional information about the strength and direction of the trend.
Some examples of confirmation indicators that may be used in the NNFX system include the Bollinger Bands, the MACD (Moving Average Convergence Divergence), and the MACD Oscillator. These indicators can provide information about the volatility, momentum, and trend strength of the market, and can be used to confirm the signals generated by the primary indicators.
In the NNFX system, confirmation indicators are used in combination with primary indicators and other filters to create a trading system that is robust and reliable. By using multiple indicators to confirm trading signals, the system aims to reduce the risk of false signals and improve the overall profitability of the trades.
What is a Continuation indicator?
In the NNFX (No Nonsense Forex) trading system, a continuation indicator is a technical indicator that is used to confirm a current trend and predict that the trend is likely to continue in the same direction. A continuation indicator is typically used in conjunction with other indicators in the system, such as a baseline indicator, to provide a comprehensive trading strategy.
What is a Volatility/Volume indicator?
Volume indicators, such as the On Balance Volume (OBV), the Chaikin Money Flow (CMF), or the Volume Price Trend (VPT), are used to measure the amount of buying and selling activity in a market. They are based on the trading volume of the market, and can provide information about the strength of the trend. In the NNFX system, volume indicators are used to confirm trading signals generated by the Moving Average and the Relative Strength Index. Volatility indicators include Average Direction Index, Waddah Attar, and Volatility Ratio. In the NNFX trading system, volatility is a proxy for volume and vice versa.
By using volume indicators as confirmation tools, the NNFX trading system aims to reduce the risk of false signals and improve the overall profitability of trades. These indicators can provide additional information about the market that is not captured by the primary indicators, and can help traders to make more informed trading decisions. In addition, volume indicators can be used to identify potential changes in market trends and to confirm the strength of price movements.
What is an Exit indicator?
The exit indicator is used in conjunction with other indicators in the system, such as the Moving Average (MA), the Relative Strength Index (RSI), and the Average True Range (ATR), to provide a comprehensive trading strategy.
The exit indicator in the NNFX system can be any technical indicator that is deemed effective at identifying optimal exit points. Examples of exit indicators that are commonly used include the Parabolic SAR, the Average Directional Index (ADX), and the Chandelier Exit.
The purpose of the exit indicator is to identify when a trend is likely to reverse or when the market conditions have changed, signaling the need to exit a trade. By using an exit indicator, traders can manage their risk and prevent significant losses.
In the NNFX system, the exit indicator is used in conjunction with a stop loss and a take profit order to maximize profits and minimize losses. The stop loss order is used to limit the amount of loss that can be incurred if the trade goes against the trader, while the take profit order is used to lock in profits when the trade is moving in the trader's favor.
Overall, the use of an exit indicator in the NNFX trading system is an important component of a comprehensive trading strategy. It allows traders to manage their risk effectively and improve the profitability of their trades by exiting at the right time.
How does Loxx's GKD (Giga Kaleidoscope Modularized Trading System) implement the NNFX algorithm outlined above?
Loxx's GKD v1.0 system has five types of modules (indicators/strategies). These modules are:
1. GKD-BT - Backtesting module (Volatility, Number 1 in the NNFX algorithm)
2. GKD-B - Baseline module (Baseline and Volatility/Volume, Numbers 1 and 2 in the NNFX algorithm)
3. GKD-C - Confirmation 1/2 and Continuation module (Confirmation 1/2 and Continuation, Numbers 3, 4, and 5 in the NNFX algorithm)
4. GKD-V - Volatility/Volume module (Confirmation 1/2, Number 6 in the NNFX algorithm)
5. GKD-E - Exit module (Exit, Number 7 in the NNFX algorithm)
(additional module types will added in future releases)
Each module interacts with every module by passing data between modules. Data is passed between each module as described below:
GKD-B => GKD-V => GKD-C(1) => GKD-C(2) => GKD-C(Continuation) => GKD-E => GKD-BT
That is, the Baseline indicator passes its data to Volatility/Volume. The Volatility/Volume indicator passes its values to the Confirmation 1 indicator. The Confirmation 1 indicator passes its values to the Confirmation 2 indicator. The Confirmation 2 indicator passes its values to the Continuation indicator. The Continuation indicator passes its values to the Exit indicator, and finally, the Exit indicator passes its values to the Backtest strategy.
This chaining of indicators requires that each module conform to Loxx's GKD protocol, therefore allowing for the testing of every possible combination of technical indicators that make up the six components of the NNFX algorithm.
What does the application of the GKD trading system look like?
Example trading system:
Backtest: Strategy with 1-3 take profits, trailing stop loss, multiple types of PnL volatility, and 2 backtesting styles
Baseline: Hull Moving Average
Volatility/Volume: Hurst Exponent
Confirmation 1: Blau Composite High-Low Momentum as shown on the chart above
Confirmation 2: Williams Percent Range
Continuation: Fisher Transform
Exit: Rex Oscillator
Each GKD indicator is denoted with a module identifier of either: GKD-BT, GKD-B, GKD-C, GKD-V, or GKD-E. This allows traders to understand to which module each indicator belongs and where each indicator fits into the GKD protocol chain.
Giga Kaleidoscope Modularized Trading System Signals (based on the NNFX algorithm)
Standard Entry
1. GKD-C Confirmation 1 Signal
2. GKD-B Baseline agrees
3. Price is within a range of 0.2x Volatility and 1.0x Volatility of the Goldie Locks Mean
4. GKD-C Confirmation 2 agrees
5. GKD-V Volatility/Volume agrees
Baseline Entry
1. GKD-B Baseline signal
2. GKD-C Confirmation 1 agrees
3. Price is within a range of 0.2x Volatility and 1.0x Volatility of the Goldie Locks Mean
4. GKD-C Confirmation 2 agrees
5. GKD-V Volatility/Volume agrees
6. GKD-C Confirmation 1 signal was less than 7 candles prior
Continuation Entry
1. Standard Entry, Baseline Entry, or Pullback; entry triggered previously
2. GKD-B Baseline hasn't crossed since entry signal trigger
3. GKD-C Confirmation Continuation Indicator signals
4. GKD-C Confirmation 1 agrees
5. GKD-B Baseline agrees
6. GKD-C Confirmation 2 agrees
1-Candle Rule Standard Entry
1. GKD-C Confirmation 1 signal
2. GKD-B Baseline agrees
3. Price is within a range of 0.2x Volatility and 1.0x Volatility of the Goldie Locks Mean
Next Candle:
1. Price retraced (Long: close < close or Short: close > close )
2. GKD-B Baseline agrees
3. GKD-C Confirmation 1 agrees
4. GKD-C Confirmation 2 agrees
5. GKD-V Volatility/Volume agrees
1-Candle Rule Baseline Entry
1. GKD-B Baseline signal
2. GKD-C Confirmation 1 agrees
3. Price is within a range of 0.2x Volatility and 1.0x Volatility of the Goldie Locks Mean
4. GKD-C Confirmation 1 signal was less than 7 candles prior
Next Candle:
1. Price retraced (Long: close < close or Short: close > close )
2. GKD-B Baseline agrees
3. GKD-C Confirmation 1 agrees
4. GKD-C Confirmation 2 agrees
5. GKD-V Volatility/Volume Agrees
PullBack Entry
1. GKD-B Baseline signal
2. GKD-C Confirmation 1 agrees
3. Price is beyond 1.0x Volatility of Baseline
Next Candle:
1. Price is within a range of 0.2x Volatility and 1.0x Volatility of the Goldie Locks Mean
3. GKD-C Confirmation 1 agrees
4. GKD-C Confirmation 2 agrees
5. GKD-V Volatility/Volume Agrees
█ GKD-C Blau Composite High-Low Momentum
What is the Blau Composite High-Low Momentum?
The Composite High/Low Momentum (HLM) Blau HLM is a technical analysis tool that is used to analyze the momentum of a financial instrument. Developed by William Blau, the HLM is a unique indicator that combines both price and volume data to provide a comprehensive picture of market trends and momentum.
The HLM is based on the concept of price momentum, which is the tendency of a financial instrument to continue moving in the same direction that it has been moving. Momentum is a key indicator for traders, as it can help to identify trends and potential changes in trend.
The HLM is calculated by comparing the current price of a financial instrument to its highest and lowest prices over a specified period of time. This calculation is then combined with a measure of volume, which is used to provide additional insight into market trends and momentum.
The HLM is designed to be highly responsive to changes in market conditions, providing traders with a more accurate and timely picture of market trends. The indicator is also highly customizable, allowing traders to adjust the parameters to suit their individual trading styles and preferences.
One of the key benefits of the HLM is its ability to provide early warning signs of potential trend changes. By analyzing both price and volume data, the HLM is able to identify shifts in market momentum that may indicate a potential reversal in trend.
Overall, the Composite High/Low Momentum Blau HLM is a powerful technical analysis tool that can provide traders with valuable insights into market trends and momentum. While it may require some knowledge of technical analysis to use effectively, the HLM can be a valuable tool for traders looking to make informed trading decisions.
Requirements
Inputs
Confirmation 1 and Solo Confirmation: GKD-V Volatility / Volume indicator
Confirmation 2: GKD-C Confirmation indicator
Outputs
Confirmation 2 and Solo Confirmation Complex: GKD-E Exit indicator
Confirmation 1: GKD-C Confirmation indicator
Continuation: GKD-E Exit indicator
Solo Confirmation Simple: GKD-BT Backtest strategy
Additional features will be added in future releases.
