Adaptive Squeeze Momentum +Adaptive Squeeze Momentum+ (Auto-Timeframe Version)
Overview
Adaptive Squeeze Momentum+ is an enhanced volatility and momentum indicator designed to identify compression and expansion phases in price action. It is inspired by the classic Squeeze Momentum Indicator by LazyBear but introduces automatic parameter adaptation to any timeframe, making it simpler to use across different markets without manual configuration.
Concepts and Methodology
The script combines Bollinger Bands (BB) and Keltner Channels (KC) to detect periods when volatility contracts (squeeze) or expands (release).
A squeeze occurs when BB are inside KC, suggesting low volatility and potential breakout scenarios.
A squeeze release is detected when BB expand outside KC.
Momentum is derived using a linear regression applied to the difference between price and a midrange reference level.
Original Improvements
Compared to the original Squeeze Momentum Indicator, this version offers several enhancements:
Automatic Adaptation: BB and KC lengths and multipliers are dynamically adjusted based on the chart’s timeframe (from 1 minute up to 1 month), removing the need for manual tuning.
Simplified Visualization: A clean, minimalist histogram and clear squeeze state cross markers allow for faster interpretation.
Flexible Application: Designed to work consistently on intraday, daily, and higher timeframes across crypto, forex, stocks, and indices.
Features
Dynamic Squeeze Detection:
Gray Cross: Neutral (no squeeze detected)
Blue Cross: Active squeeze
Yellow Cross: Squeeze released
Momentum Histogram:
Positive/negative momentum shown with slope-based coloring.
Timeframe-Aware Parameters:
Automatically sets optimal BB/KC configurations.
Usage
Watch for blue crosses indicating an active squeeze phase that may precede a directional move.
Use the histogram color and slope to gauge momentum strength and direction.
Combine squeeze release signals with momentum confirmation for potential entries or exits.
Credits and Licensing
This script was inspired by LazyBear’s OLD “Squeeze Momentum Indicator” (). The implementation here significantly expands upon the original by introducing auto-adaptive parameters, restructured logic, and a new visualization approach. Published under the Mozilla Public License 2.0.
Disclaimer
This indicator is for educational purposes only and does not constitute financial advice. Use at your own risk.
Cari dalam skrip untuk "momentum"

Dynamic Momentum GaugeOverview
The Dynamic Momentum Gauge is an indicator designed to provide information and insights into the trend and momentum of a financial asset. While this indicator is not directional , it helps you know when there will be a trend, big move, or when momentum will have a run, and when you should take profits.
How It Works
This indicator calculates momentum and then removes the negative values to focus instead on when the big trend could likely happen and when it could end, or when you should enter a trade based on momentum or exit. Traders can basically use this indicator to time their market entries or exits, and align their strategies with momentum dynamics.
How To Use
As previously mentioned, this is not a directional indicator but more like a timing indicator. This indicator helps you find when the trend moves, and big moves in the markets will occur and its possibly best to exit the trades. For example, if you decide to enter a long trade if the Dynamic Momentum Gauge value is at an extreme low and another momentum indicator that you use has conditions that you would consider to long with, then this indicator is basically telling you that there isn't more space for the momentum to squeeze any longer, can only really expand from that point or stay where it currently is, but this is also a mean reverting process so it does tend to go back up from the low point.
Settings:
Length: This is the length of the momentum, by default its at 100.
Normalization Length: Length of the Normalization which ensures the the values fall within a consistent range.

True Momentum OscillatorThe True Momentum Oscillator (TMO) calculates the delta of the price using the open and close. We have taken the true momentum oscillator a step further and have added the momentum of the main signal (TMO) and the smooth signal line. We believe this helps give a clearer picture of price momentum and helps verify crossovers of the TMO and the smooth signal line. The momentum lines can also help confirm a divergence of the TMO. We have also added multiple moving average options so the user can customize the TMO to suit their needs.
TMO- Green when above Smooth Signal Line, red when below Smooth Signal Line
Smooth Signal- Gray Line
Histogram- TMO-Smooth Signal
TMO Momentum- Orange line
Smooth Signal Momentum- Yellow line
Overbought/Oversold regions- Gray highlighted boundaries
The TMO has defined overbought and oversold regions where either a crossover signal or divergence in the oscillator itself can be taken as a signal. Similar to the MACD, a crossover of the zero line by the TMO can also be utilized as a signal.

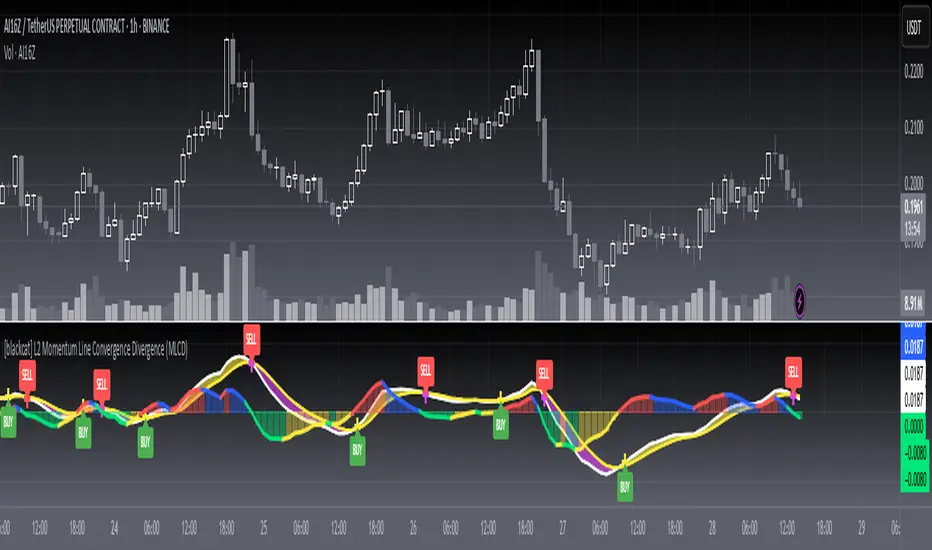
[blackcat] L2 Momentum Line Convergence Divergence (MLCD)Level: 2
Background
Momentum indicators are technical analysis tools that can be used to determine the strength or weakness of the stock price. Momentum measures the speed at which stock prices rise or fall. Common momentum indicators are the relative strength index (RSI) and the moving average of convergence divergence (MACD).
Function
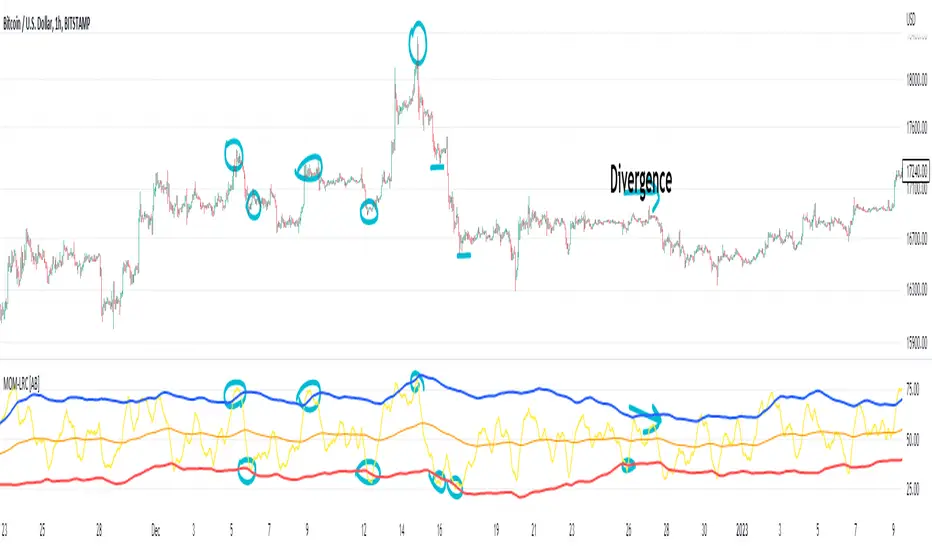
L2 Momentum Line Convergence Divergence (MLCD) is one of my innovative indicator which is to differeniate with average of convergence divergence (MACD). So, I named it as Momentum Line Convergence Divergence (MLCD). In order for everyone to be more familiar with its useage, I inherited the traditional MACD expression method, and added golden cross (yellow cross) and dead cross (fuchsia cross) prompts, as well as bottom divergence (lime cross) and top divergence (red cross) prompts.
Key Signal
mtm --> momentum fast line
mtmaux --> momentum slow line
mtmgx --> momentum gold cross in yellow
mtmdx --> momentum dead cross in fuchsia
mtmbotdiverg --> momentum bottom divergence alert in lime cross
mtmtopdiverg --> momentum top divergence alert in red cross
Pros and Cons
Pros:
1. very stable for market price change and trend following
2. visual bottom and top divergence alerts are provided
Cons:
To be found yet
Remarks
Blackcat1402 brand MLCD indicator
Readme
In real life, I am a prolific inventor. I have successfully applied for more than 60 international and regional patents in the past 12 years. But in the past two years or so, I have tried to transfer my creativity to the development of trading strategies. Tradingview is the ideal platform for me. I am selecting and contributing some of the hundreds of scripts to publish in Tradingview community. Welcome everyone to interact with me to discuss these interesting pine scripts.
The scripts posted are categorized into 5 levels according to my efforts or manhours put into these works.
Level 1 : interesting script snippets or distinctive improvement from classic indicators or strategy. Level 1 scripts can usually appear in more complex indicators as a function module or element.
Level 2 : composite indicator/strategy. By selecting or combining several independent or dependent functions or sub indicators in proper way, the composite script exhibits a resonance phenomenon which can filter out noise or fake trading signal to enhance trading confidence level.
Level 3 : comprehensive indicator/strategy. They are simple trading systems based on my strategies. They are commonly containing several or all of entry signal, close signal, stop loss, take profit, re-entry, risk management, and position sizing techniques. Even some interesting fundamental and mass psychological aspects are incorporated.
Level 4 : script snippets or functions that do not disclose source code. Interesting element that can reveal market laws and work as raw material for indicators and strategies. If you find Level 1~2 scripts are helpful, Level 4 is a private version that took me far more efforts to develop.
Level 5 : indicator/strategy that do not disclose source code. private version of Level 3 script with my accumulated script processing skills or a large number of custom functions. I had a private function library built in past two years. Level 5 scripts use many of them to achieve private trading strategy.
Momentum Fusion v1Momentum Fusion v1
Overview
Momentum Fusion v1 (MFusion) is a multi-oscillator indicator that combines several components to analyze market momentum and trend strength. It incorporates modified versions of classic indicators such as PVI (Positive Volume Index), NVI (Negative Volume Index), MFI (Money Flow Index), RSI, Stochastic, and Bollinger Bands Oscillator. The indicator displays a histogram that changes color based on momentum strength and includes "FUSION🔥" signal labels when extreme values are reached.
Indicator Settings
Parameters:
EMA Length – Smoothing period for the moving average (default: 255).
Smoothing Period – Internal calculation smoothing parameter (default: 15).
BB Multiplier – Standard deviation multiplier for Bollinger Bands (default: 2.0).
Show verde / marron / media lines – Toggles the display of auxiliary lines.
Show FUSION🔥 label – Enables/disables signal labels.
Indicator Components
1. PVI (Positive Volume Index)
Formula:
pvi := volume > volume ? nz(pvi ) + (close - close ) / close * sval : nz(pvi )
Description:
PVI increases when volume rises compared to the previous bar and accounts for price percentage change. The stronger the price movement with increasing volume, the higher the PVI value.
2. NVI (Negative Volume Index)
Formula:
nvi := volume < volume ? nz(nvi ) + (close - close ) / close * sval : nz(nvi )
Description:
NVI tracks price movements during declining volume. If the price rises on low volume, it may indicate a "stealth" trend.
3. Money Flow Index (MFI)
Formula:
100 - 100 / (1 + up / dn)
Description:
An oscillator measuring money flow strength. Values above 80 suggest overbought conditions, while values below 20 indicate oversold conditions.
4. Stochastic Oscillator
Formula:
k = 100 * (close - lowest(low, length)) / (highest(high, length) - lowest(low, length))
Description:
A classic stochastic oscillator showing price position relative to the selected period's range.
5. Bollinger Bands Oscillator
Formula:
(tprice - BB midline) / (upper BB - lower BB) * 100
Description:
Indicates the price position relative to Bollinger Bands in percentage terms.
Key Lines & Histogram
1. Verde (Green Line)
Calculation:
verde = marron + oscp (normalized PVI)
Interpretation:
Higher values indicate stronger bullish momentum. A FUSION🔥 signal appears when the value reaches 750+.
2. Marron (Brown Line)
Calculation:
marron = (RSI + MFI + Bollinger Osc + Stochastic / 3) / 2
Interpretation:
A composite oscillator combining multiple indicators. Higher values suggest overbought conditions.
3. Media (Red Line)
Calculation:
media = EMA of marron with smoothing period
Interpretation:
Acts as a signal line for trend confirmation.
4. Histogram
Calculation:
histo = verde - marron
Colors:
Bright green (>100) – Strong bullish momentum.
Light green (>0) – Moderate bullish momentum.
Orange (<0) – Bearish momentum.
Red (<-100) – Strong bearish momentum.
Signals & Alerts
1. FUSION🔥 (Strong Momentum)
Condition:
verde >= 750
Visualization:
A "FUSION🔥" label appears below the chart.
Alert:
Can be set to trigger notifications when the condition is met.
2. Background Aura
Condition:
verde > 850
Visualization:
The chart background turns teal, indicating extreme momentum.
Usage Recommendations
FUSION🔥 Signal – Can be used as a long entry point when confirmed by other indicators.
Histogram:
1. Green bars – Potential long entry.
2. Red/orange bars – Potential short entry.
3. Media & Marron Crossover – Can serve as an additional trend filter.
4. Suitable for a 5-15 minute time frame
Conclusion
Momentum Fusion v1 is a powerful tool for momentum analysis, combining multiple indicators into a unified system. It is suitable for:
Trend traders (catching strong movements).
Scalpers (identifying short-term impulses).
Swing traders (filtering entry points).
The indicator features customizable settings and visual signals, making it adaptable to various trading styles.

Z-Score Based Momentum Zones with Advanced Volatility ChannelsThe indicator "Z-Score Based Momentum Zones with Advanced Volatility Channels" combines various technical analysis components, including volatility, price changes, and volume correction, to calculate Z-Scores and determine momentum zones and provide a visual representation of price movements and volatility based on multi timeframe highest high and lowest low values.
Note: THIS IS A IMPROVEMNT OF "Multi Time Frame Composite Bands" INDICATOR OF MINE WITH MORE EMPHASIS ON MOMENTUM ZONES CALULATED BASED ON Z-SCORES
Input Options
look_back_length: This input specifies the look-back period for calculating intraday volatility. correction It is set to a default value of 5.
lookback_period: This input sets the look-back period for calculating relative price change. The default value is 5.
zscore_period: This input determines the look-back period for calculating the Z-Score. The default value is 500.
avgZscore_length: This input defines the length of the momentum block used in calculations, with a default value of 14.
include_vc: This is a boolean input that, if set to true, enables volume correction in the calculations. By default, it is set to false.
1. Volatility Bands (Composite High and Low):
Composite High and Low: These are calculated by combining different moving averages of the high prices (high) and low prices (low). Specifically:
a_high and a_low are calculated as the average of the highest (ta.highest) and lowest (ta.lowest) high and low prices over various look-back periods (5, 8, 13, 21, 34) to capture short and long-term trends.
b_high and b_low are calculated as the simple moving average (SMA) of the high and low prices over different look-back periods (5, 8, 13) to smooth out the trends.
high_c and low_c are obtained by averaging a_high with b_high and a_low with b_low respectively.
IDV Correction Calulation : In this script the Intraday Volatility (IDV) is calculated as the simple moving average (SMA) of the daily high-low price range divided by the closing price. This measures how much the price fluctuates in a given period.
Composite High and Low with Volatility: The final c_high and c_low values are obtained by adjusting high_c and low_c with the calculated intraday volatility (IDV). These values are used to create the "Composite High" and "Composite Low" plots.
Composite High and Low with Volatility Correction: The final c_high and c_low values are obtained by adjusting high_c and low_c with the calculated intraday volatility (IDV). These values are used to create the "Composite High" and "Composite Low" plots.
2. Momentum Blocks Based on Z-Score:
Relative Price Change (RPC):
The Relative Price Change (rpdev) is calculated as the difference between the current high-low-close average (hlc3) and the previous simple moving average (psma_hlc3) of the same quantity. This measures the change in price over time.
Additionally, std_hlc3 is calculated as the standard deviation of the hlc3 values over a specified look-back period. The standard deviation quantifies the dispersion or volatility in the price data.
The rpdev is then divided by the std_hlc3 to normalize the price change by the volatility. This normalization ensures that the price change is expressed in terms of standard deviations, which is a common practice in quantitative analysis.
Essentially, the rpdev represents how many standard deviations the current price is away from the previous moving average.
Volume Correction (VC): If the include_vc input is set to true, volume correction is applied by dividing the trading volume by the previous simple moving average of the volume (psma_volume). This accounts for changes in trading activity.
Volume Corrected Relative Price Change (VCRPD): The vcrpd is calculated by multiplying the rpdev by the volume correction factor (vc). This incorporates both price changes and volume data.
Z-Scores: The Z-scores are calculated by taking the difference between the vcrpd and the mean (mean_vcrpd) and then dividing it by the standard deviation (stddev_vcrpd). Z-scores measure how many standard deviations a value is away from the mean. They help identify whether a value is unusually high or low compared to its historical distribution.
Momentum Blocks: The "Momentum Blocks" are essentially derived from the Z-scores (avgZScore). The script assigns different colors to the "Fill Area" based on predefined Z-score ranges. These colored areas represent different momentum zones:
Positive Z-scores indicate bullish momentum, and different shades of green are used to fill the area.
Negative Z-scores indicate bearish momentum, and different shades of red are used.
Z-scores near zero (between -0.25 and 0.25) suggest neutrality, and a yellow color is used.

Banded Chikou Breakout — Quantifying Ichimoku MomentumTitle: Banded Chikou Breakout — Quantifying Ichimoku Momentum
Overview:
Banded Chikou Breakout (BCB) is a unique, algorithmic script designed to augment the capabilities of traders seeking substantial breakout opportunities. Constructed on the robust principles of the Ichimoku trading strategy, BCB is designed to quantify and filter the Chikou Span's significant breakouts above or below the price action. This script does not aim to replace the Ichimoku system; instead, it enhances it, providing an optimized tool for momentum trading.
Rationale:
Ichimoku traders often scrutinize the Chikou Span's position relative to price action to identify market trends. However, determining whether the Chikou Span is above or below due to a genuine trend or mere market noise can be challenging in choppy markets. BCB resolves this predicament by offering a unique way to interpret the Chikou Span's movement. It does so by quantifying the Chikou Span's momentum and utilizing Bollinger Bands to determine its significance. By effectively differentiating substantial movements from the insignificant, BCB can help traders better navigate the market and increase their potential for profitable trades.
How it Works:
BCB combines three key elements: a Momentum Script (simulating Chikou Span), a Bollinger Band Script, and a Timeframe Switcher, all working together to provide a refined trading perspective.
Momentum Script: Calculates the price difference between the current price and the price 'n' periods ago, transforming the Chikou Span into a quantifiable momentum value that signifies the strength and speed of a market move.
Bollinger Band Script: Computes a Simple Moving Average (SMA) around the momentum, plotting two 'bands' at a specified standard deviation from this SMA. This functionality allows traders to discern when the Chikou Span's momentum is abnormally high or low, signifying a potential significant breakout.
Timeframe Switcher: This feature lets traders apply the BCB script to a different timeframe from the one they are currently viewing. This capability can help traders identify higher timeframe breakouts and trade them with precision on the lower timeframe.
How to Use:
BCB is designed to complement the Ichimoku strategy for effective breakout identification.
Add the BCB script to your trading chart. It plots the momentum (yellow line) and Bollinger Bands (green lines) with the area between the bands shaded blue.
Utilize the Ichimoku strategy to identify larger and smaller timeframe trends.
Optional: Leverage the timeframe switcher to synchronize your trades with higher timeframe trends while operating on lower timeframes.
If the BCB momentum line crosses the upper Bollinger Band while the Ichimoku indicates a bullish trend, it signifies a potential significant upward breakout. Similarly, a cross below the lower band during a bearish trend could denote a significant downward breakout.
Remember, without the context provided by the Ichimoku system's trend analysis, BCB can yield false breakouts. It is, therefore, crucial to use these tools in tandem. I like to check for an Ichimoku trend on the 4H and 1H charts, and then use BCB on charts <60 minutes to capture trends with precision.

The Flash-Strategy (Momentum-RSI, EMA-crossover, ATR)The Flash-Strategy (Momentum-RSI, EMA-crossover, ATR)
Are you tired of manually analyzing charts and trying to find profitable trading opportunities? Look no further! Our algorithmic trading strategy, "Flash," is here to simplify your trading process and maximize your profits.
Flash is an advanced trading algorithm that combines three powerful indicators to generate highly selective and accurate trading signals. The Momentum-RSI, Super-Trend Analysis and EMA-Strategy indicators are used to identify the strength and direction of the underlying trend.
The Momentum-RSI signals the strength of the trend and only generates trading signals in confirmed upward or downward trends. The Super-Trend Analysis confirms the trend direction and generates signals when the price breaks through the super-trend line. The EMA-Strategy is used as a qualifier for the generation of trading signals, where buy signals are generated when the EMA crosses relevant trend lines.
Flash is highly selective, as it only generates trading signals when all three indicators align. This ensures that only the highest probability trades are taken, resulting in maximum profits.
Our trading strategy also comes with two profit management options. Option 1 uses the so-called supertrend-indicator which uses the dynamic ATR as a key input, while option 2 applies pre-defined, fixed SL and TP levels.
The settings for each indicator can be customized, allowing you to adjust the length, limit value, factor, and source value to suit your preferences. You can also set the time period in which you want to run the backtest and how many dollar trades you want to open in each position for fully automated trading.
Choose your preferred trade direction and stop-loss/take-profit settings, and let Flash do the rest. Say goodbye to manual chart analysis and hello to consistent profits with Flash. Try it now!
General Comments
This Flash Strategy has been developed in cooperation between Baby_whale_to_moon and JS-TechTrading. Cudos to Baby_whale_to_moon for doing a great job in transforming sophisticated trading ideas into pine scripts.
Detailed Description
The “Flash” script considers the following indicators for the generation of trading signals:
1. Momentum-RSI
2. ‘Super-Trend’-Analysis
3. EMA-Strategy
1. Momentum-RSI
• This indicator signals the strength of the underlying upward- or downward-trend.
• The signal range of this indicator is from 0 to 100. Values > 60 indicate a confirmed upward- or downward-trend.
• The strategy will only generate trading signals in case the stock (or any other financial security) is in a confirmed upward- (long entry signals) or downward-trend (short entry signals).
• This indicator provides information with regards to the strength of the underlying trend and it does not give any insight with regard to the direction of the trend. Therefore, this strategy also considers other indicators which provide technical confirmation with regards to the direction of the underlying trend.
Graph 1 shows this concept:
• The Momentum-RSI indicator gives lower readings during consolidation phases and no trading signals are generated during these periods.
Example (graph 2):
2. Super-Trend Analysis
• The red line in the graph below represents the so-called super-trend-line. Trading signals are only generated in case the price action breaks through this super-trend-line indicating a new confirmed upward-trend (or downward-trend, respectively).
• If that happens, the super trend-line changes its color from red to green, giving confirmation that the trend changed from bearish to bullish and long-entries can be considered.
• The vice-versa approach can be considered for short entries.
Graph 3 explains this concept:
3. Exponential Moving Average / EMA-Strategy
The functionality of this EMA-element of the strategy has been programmed as follows:
• The exponential moving average and two other trend lines are being used as qualifiers for the generation of trading-signals.
• Buy-signals for long-entries are only considered in case the EMA (yellow line in the graph below) crosses the red line.
• Sell-signals for short-entries are only considered in case the EMA (yellow line in the graph below) crosses the green line.
An example is shown in graph 4 below:
We use this indicator to determine the new trend direction that may occur by using the data of the price's past movement.
4. Bringing it all together
This section describes in detail, how this strategy combines the Momentum-RSI, the super-trend analysis and the EMA-strategy.
The strategy only generates trading-signals in case all of the following conditions and qualifiers are being met:
1. Momentum-RSI is higher than the set value of this strategy. The standard and recommended value is 60 (graph 5):
2. The super-trend analysis needs to indicate a confirmed upward-trend (for long-entry signals) or a confirmed downward-trend (for short-entry signals), respectively.
3. The EMA-strategy needs to indicate that the stock or financial security is in a confirmed upward-trend (long-entries) or downward-trend (short-entries), respectively.
The strategy will only generate trading signals if all three qualifiers are being met. This makes this strategy highly selective and is the key secret for its success.
Example for Long-Entry (graph 6):
When these conditions are met, our Long position is opened.
Example for Short-Entry (graph 7):
Trade Management Options (graph 8)
Option 1
In this dynamic version, the so-called supertrend-indicator is being used for the trade exit management. This supertrend-indicator is a sophisticated and optimized methodology which uses the dynamic ATR as one of its key input parameters.
The following settings of the supertrend-indicator can be changed and optimized (graph 9):
The dynamic SL/TP-lines of the supertrend-indicator are shown in the charts. The ATR-length and the supertrend-factor result in a multiplier value which can be used to fine-tune and optimize this strategy based on the financial security, timeframe and overall market environment.
Option 2 (graph 10):
Option 2 applies pre-defined, fixed SL and TP levels which will appear as straight horizontal lines in the chart.
Settings options (graph 11):
The following settings can be changed for the three elements of this strategy:
1. (Length Mom-Rsi): Length of our Mom-RSI indicator.
2. Mom-RSI Limit Val: the higher this number, the more momentum of the underlying trend is required before the strategy will start creating trading signals.
3. The length and factor values of the super trend indicator can be adjusted:ATR Length SuperTrend and Factor Super Trend
4. You can set the source value used by the ema trend indicator to determine the ema line: Source Ema Ind
5. You can set the EMA length and the percentage value to follow the price: Length Ema Ind and Percent Ema Ind
6. The backtesting period can be adjusted: Start and End time of BackTest
7. Dollar cost per position: this is relevant for 100% fully automated trading.
8. Trade direction can be adjusted: LONG, SHORT or BOTH
9. As we explained above, we can determine our stop-loss and take-profit levels dynamically or statically. (Version 1 or Version 2 )
Display options on the charts graph 12):
1. Show horizontal lines for the Stop-Loss and Take-profit levels on the charts.
2. Display relevant Trend Lines, including color setting options for the supertrend functionality. In the example below, green lines indicate a confirmed uptrend, red lines indicate a confirmed downtrend.
Other comments
• This indicator has been optimized to be applied for 1 hour-charts. However, the underlying principles of this strategy are supply and demand in the financial markets and the strategy can be applied to all timeframes. Daytraders can use the 1min- or 5min charts, swing-traders can use the daily charts.
• This strategy has been designed to identify the most promising, highest probability entries and trades for each stock or other financial security.
• The combination of the qualifiers results in a highly selective strategy which only considers the most promising swing-trading entries. As a result, you will normally only find a low number of trades for each stock or other financial security per year in case you apply this strategy for the daily charts. Shorter timeframes will result in a higher number of trades / year.
• Consequently, traders need to apply this strategy for a full watchlist rather than just one financial security.

MFI + RSI + MOM With Bull & Bear Trend LabelMOMENTUM + MONEY FLOW INDEX + RELATIVE STRENGTH INDEX WITH BULL & BEAR LABELS
This is a combination of 3 popular indicators. Momentum(MOM), Money Flow Index(MFI) and Relative Strength Index(RSI) along with color changing labels that tell you each indicator's current trend.
The middle white line shows the level that each indicator needs to stay above to be bullish and below for bearish. Watch for all three indicators to cross and hold above or below the mid line for big moves.
It is important to note that these indicators do not need to be going up to be bullish or down to be bearish. They just need to hold above or below the mid line to understand the overall trend.
The momentum indicator is the most relevant in my opinion. If it is holding above the mid line steadily, usually the overall trend will continue upwards so look to buy the dips if the momentum cloud is staying above the white line and vice versa.
It is also important to note that the default settings for this indicator are the 100 period as I find it to be super relevant across most charts but these numbers can be changed in the indicator settings.
Since momentum swings wildly past the normal 0-100 range, it is important to note that the momentum line has been “normalized” to stay within this same range as the rsi and mfi. So if you look at a normal momentum indicator side by side with this indicator it will not look the same however, I find it to be a very good indicator of overall direction so I know the current market sentiment even when price is diverging from the indicator directions.
All of the colors, sources and lengths can be easily customized in the indicator settings input tab.
***HOW TO USE***
When Momentum is above the mid line, it is bullish. When Momentum is below the mid line, it is bearish.
A label on the right side will update in real time to tell you if momentum is Bullish or Bearish for faster recognition of the trend.
When RSI is above the mid line, it is bullish. When Momentum is below the mid line it is bearish.
A label on the right side will update in real time to tell you if RSI is Bullish or Bearish for faster recognition of the trend.
When MFI is above the mid line, it is bullish. When MFI is below the mid line it is bearish.
A label on the right side will update in real time to tell you if MFI is Bullish or Bearish for faster recognition of the trend.
This indicator was built to help you quickly identify the Bullish or Bearish nature of the current trend with a live color changing label so you can glance at the label and understand it's direction without analyzing the indicator data.
***MARKETS***
This indicator can be used as a signal on all markets, including stocks, crypto, futures and forex.
***TIMEFRAMES***
This mom + mfi + rsi indicator can be used on all timeframes.
***TIPS***
Try using numerous indicators of ours on your chart so you can instantly see the bullish or bearish trend of multiple indicators in real time without having to analyze the data. Some of our favorites are our Auto Fibonacci, Directional Movement Index, Volume Profile, Auto Support And Resistance and Money Flow Index in combination with this indicator. They all have real time Bullish and Bearish labels as well so you can immediately understand each indicator's trend.

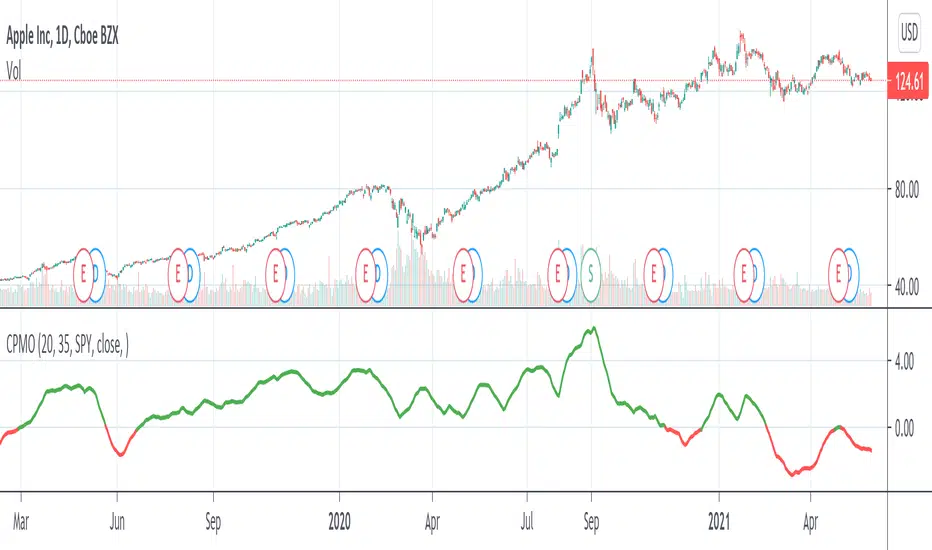
Compare Price Momentum Oscillator [CC]The Compare Price Momentum Oscillator was created by Vitali Apirine (Stocks and Commodities Aug 2020 pg 16) and this is a handy indicator to compare the momentum of the current symbol you are looking at to the s&p to determine the relative strength of the underlying security. Buy when the line turns green and sell when it turns red.
Let me know if there are any other scripts you would like to see me publish!
Volume ⨃ αMomentum 🦝🦾First attempt playing around with mixing volume and momentum... I find it to be nonsense, but putting it up for the moment.


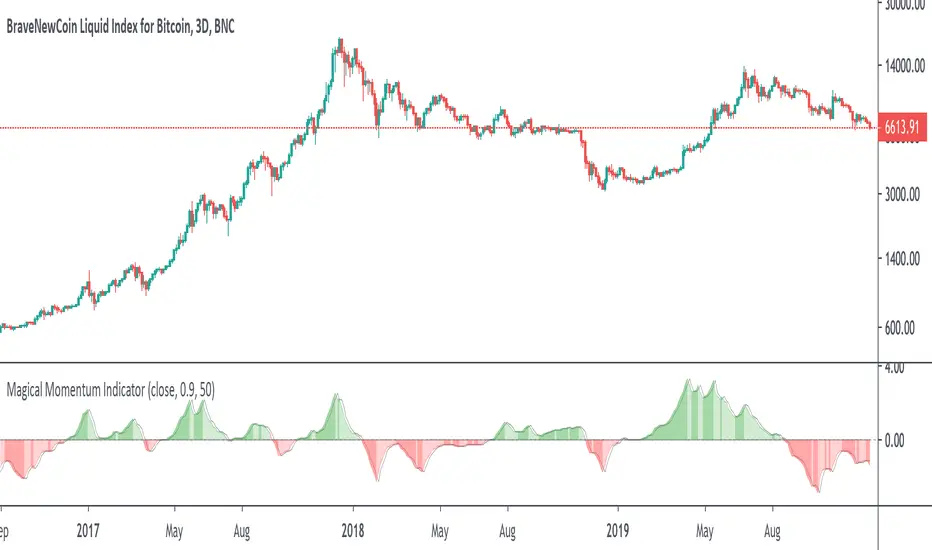
Ehlers Smoothed Adaptive Momentum [LazyBear]Bored of Ehlers yet? :) I still have plenty of Ehlers in my collection, was thinking of publishing one of his Fishers or Adaptive RVI next, but @ChartArt requested Smoothed Adaptive Momentum (SAM), so here we go...
This is my 200th script (not including the variations and other custom scripts I shared over PM). My complete list of indicators here - bit.ly
Now, about the indicator :)
This smoothed adaptive momentum is straightforward to use (per Ehlers original rules). If it crosses above zero buy the next open, if it crosses below zero sell the next open. Of course, I strongly suggest filtering the signals.
Finally, here's an Ehlers-only chart to help determine where BTC is heading :P
More info:
- Ehlers CG Oscillator:
- Cybernetic Analysis for Stocks and Futures (Ehlers)
List of my public indicators: bit.ly
List of my app-store indicators: blog.tradingview.com
--Updated chart--
Here's the chart with barcolors ON (forgot to turn it on in the published one)

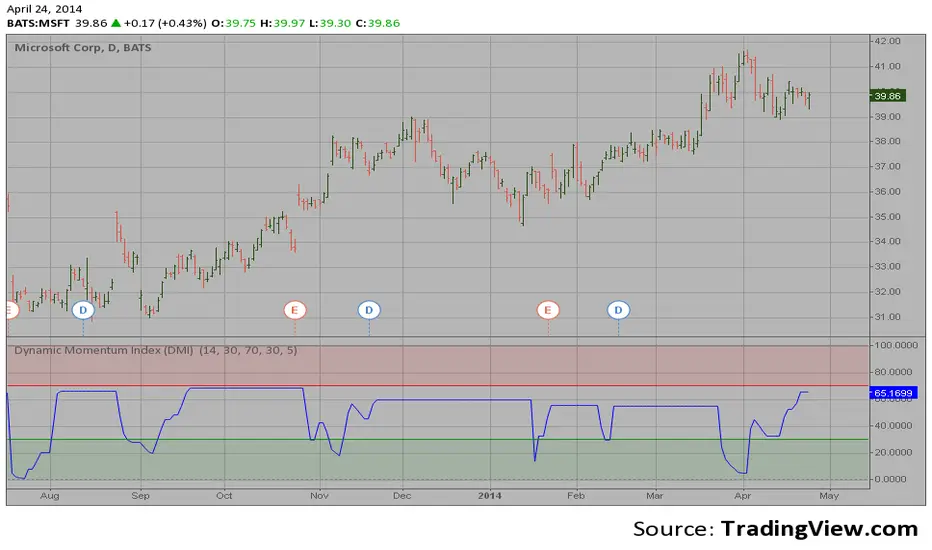
Dynamic Momentum Index (DMI) This indicator plots Dynamic Momentum Index indicator. The Dynamic Momentum
Index (DMI) was developed by Tushar Chande and Stanley Kroll. The indicator
is covered in detail in their book The New Technical Trader.
The DMI is identical to Welles Wilder`s Relative Strength Index except the
number of periods is variable rather than fixed. The variability of the time
periods used in the DMI is controlled by the recent volatility of prices.
The more volatile the prices, the more sensitive the DMI is to price changes.
In other words, the DMI will use more time periods during quiet markets, and
less during active markets. The maximum time periods the DMI can reach is 30
and the minimum is 3. This calculation method is similar to the Variable
Moving Average, also developed by Tushar Chande.
The advantage of using a variable length time period when calculating the RSI
is that it overcomes the negative effects of smoothing, which often obscure short-term moves.
The volatility index used in controlling the time periods in the DMI is based
on a calculation using a five period standard deviation and a ten period average
of the standard deviation.
Market State Momentum OscillatorMarket State Momentum Oscillator (MSMO)
Overview
The MSMO combines three elements in one panel:
Momentum oscillator (gray/blue area with aqua signal line)
Market State filter (green/red background area)
Money Flow Index (orange line)
Works on all markets and all timeframes. Non-repainting at bar close.
Colors and meaning
Gray area: Momentum above 0 (bullish bias)
Blue area: Momentum below 0 (bearish bias)
Aqua line: Signal line smoothing the oscillator
Green background: Market state bullish (price above moving average)
Red background: Market state bearish (price below moving average)
Orange line: Money Flow Index (volume-weighted momentum)
How to use
Always wait for confirmation of the green or red market state before acting.
Trend alignment: Watch the slope of the Weekly and Daily 200 MA and Weekly and Daily 50 MA to understand higher-timeframe trend direction. Trade only in alignment with the broader trend.
Entries:
Long: Green state + gray histogram rising + MFI trending up
Short: Red state + blue histogram falling + MFI trending down
Exits: Histogram crossing back through 0, or state background flips against the position.
Users can add chart alerts on plot crossings if needed.
Inputs
Lengths for oscillator pivot, signal smoothing, state moving average, trend weight, return %, and Money Flow Index. Defaults work for most charts.
Note
Educational use only. Not financial advice.
Tags
trend, oscillator, market state, momentum, money flow, crypto, forex, stocks, indices, futures

RSI-Adaptive T3 + Squeeze Momentum Strategy✅ Strategy Guide: RSI-Adaptive T3 + Squeeze Momentum Strategy
📌 Overview
The RSI-Adaptive T3 + Squeeze Momentum Strategy is a dynamic trend-following strategy based on an RSI-responsive T3 moving average and Squeeze Momentum detection .
It adapts in real-time to market volatility to enhance entry precision and optimize risk.
⚠️ This strategy is provided for educational and research purposes only.
Past performance does not guarantee future results.
🎯 Strategy Objectives
The main objective of this strategy is to catch the early phase of a trend and generate consistent entry signals.
Designed to be intuitive and accessible for traders from beginner to advanced levels.
✨ Key Features
RSI-Responsive T3: T3 length dynamically adjusts according to RSI values for adaptive trend detection
Squeeze Momentum: Combines Bollinger Bands and Keltner Channels to identify trend buildup phases
Visual Triggers: Entry signals are generated from T3 crossovers and momentum strength after squeeze release
📊 Trading Rules
Long Entry:
When T3 crosses upward, momentum is positive, and the squeeze has just been released.
Short Entry:
When T3 crosses downward, momentum is negative, and the squeeze has just been released.
Exit (Reversal):
When the opposite condition to the entry is triggered, the position is reversed.
💰 Risk Management Parameters
Pair & Timeframe: BTC/USD (30-minute chart)
Capital (simulated): $30,00
Order size: `$100` per trade (realistic, low-risk sizing)
Commission: 0.02%
Slippage: 2 pips
Risk per Trade: 5%
Number of Trades (backtest period): 181
📊 Performance Overview
Symbol: BTC/USD
Timeframe: 30-minute chart
Date Range: January 1, 2024 – July 3, 2025
Win Rate: 47.8%
Profit Factor: 2.01
Net Profit: 173.16 (units not specified)
Max Drawdown: 5.77% or 24.91 (0.79%)
⚙️ Indicator Parameters
Indicator Name: RSI-Adaptive T3 + Squeeze Momentum
RSI Length: 14
T3 Min Length: 5
T3 Max Length: 50
T3 Volume Factor: 0.7
BB Length: 27 (Multiplier: 2.0)
KC Length: 20 (Multiplier: 1.5, TrueRange enabled)
🖼 Visual Support
T3 slope direction, squeeze status, and momentum bars are visually plotted on the chart,
providing high clarity for quick trend analysis and execution.
🔧 Strategy Improvements & Uniqueness
Inspired by the RSI Adaptive T3 by ChartPrime and Squeeze Momentum Indicator by LazyBear ,
this strategy fuses both into a hybrid trend-reversal and momentum breakout detection system .
Compared to traditional trend-following methods, it excels at capturing early trend signals with greater sensitivity .
✅ Summary
The RSI-Adaptive T3 + Squeeze Momentum Strategy combines momentum detection with volatility-responsive risk management.
With a strong balance between visual clarity and practicality, it serves as a powerful tool for traders seeking high repeatability.
⚠️ This strategy is based on historical data and does not guarantee future profits.
Always use appropriate risk management when applying it.

BB Breakout + Momentum Squeeze [Strategy]This Strategy is Based on 3 free indicators
- Bollinger Bands Breakout Oscillator: Link
- TTM Squeeze Pro: Link
- Rolling ATR Bands: Link
Bollinger Bands Breakout Oscillator - This tool shows how strong a market trend is by measuring how often prices move outside their normal Bollinger bands range. It helps you see whether prices are strongly moving in one direction or just moving sideways. By looking at how much and how frequently prices push beyond their typical boundaries, you can identify which direction the market is heading over your selected time period.
TM Squeeze Pro - This is a custom version of the TTM Squeeze indicator.
It's designed to help traders spot consolidation phases in the market (when price is coiling or "squeezing") and to catch breakouts early when volatility returns. The logic is based on the relationship between Bollinger Bands and Keltner Channels, combined with a momentum oscillator to show direction and strength.
Rolling ATR Bands - This indicator combines volatility bands (ATR) with momentum and trend signals to show where the market might be breaking out, retesting, or trending. It's highly visual and helpful for traders looking to time entries/exits during trending or volatile moves.
Logic Of the Strategy:
We are going to use the Bollinger Bands Breakout to determine the direction of the market. Than check the Volatility of the price by looking at the TTM Squeeze indicator. And use the ATR Bands to determine dynamic Stop Losses and based on the calculate the Take Profit targets and quantity for each position dynamically.
For the Long Setup:
1. We need to see the that Bull Power (Green line of the Bollinger Bands Breakout Oscilator) is crossing the level of 50.
2. Check the presence of volatility (Green dot based on the TTM Squeeze indicator)
For the Short Setup:
1. We need to see the that Bear Power (Red line of the Bollinger Bands Breakout Oscilator) is crossing the level of 50.
2. Check the presence of volatility (Green dot based on the TTM Squeeze indicator)
Stop Loss is determined by the Lower ATR Band (for the Long entry) and Upper ATR Band (For the Short entry)
Take Profit is 1:1.5 risk reward ration, which means if the Stop loss is 1% the TP target will be 1.5%
Move stop Loss to Breakeven: If the price will go in the direction of the trade for at least half of the Risk Reward target then the stop will automatically be adjusted to the entry price. For Example: the Stop Loss is 1%, the price has move at least 0.5% in the direction of your trade and that will move the Stop Loss level to the Entry point.
You can Adjust the parameters for each indicator used in that script and also adjust the Risk and Money management block to see how the PnL will change.

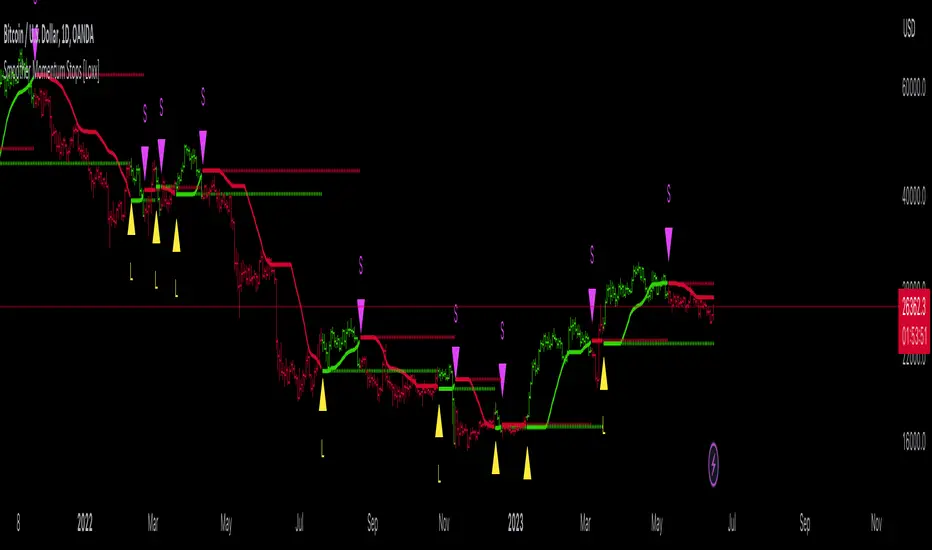
Smoother Momentum Stops [Loxx]Smoother Momentum Stops (SMS) is a dynamic tool that combines the logic of momentum and moving averages to create an overlay of the market price and generate potential trade signals. The original idea for this indicator comes from the beloved and esteemed trading indicator guru Mladen Rakic.
Understanding the Framework
The SMS incorporates various aspects of technical analysis, including momentum calculation, several types of moving averages, and an intelligent stop-and-reverse system that determines when to enter and exit trades.
The indicator initiates by defining the color scheme for visualization, specifically green for bullish trends and red for bearish trends. It further utilizes the 'smmom' and 'fema' functions to calculate smoothed momentum and fast exponential moving averages, respectively. The values computed by these functions are central to the signal generation process.
Momentum Calculation
The 'smmom' function serves to calculate a smoother momentum by taking a source (such as the closing price) and a period as inputs. This function employs a complex algorithm involving exponential moving averages (EMA), wherein two EMAs are calculated with different smoothing factors, and the difference between the two results is returned as the output. This smooth momentum calculation assists in eliminating unnecessary noise from the market and delivers more reliable momentum readings.
Moving Averages Computation
One key feature of the SMS is the ability to select from five different moving average types: Exponential Moving Average (EMA), Fast Exponential Moving Average (FEMA), Linear Weighted Moving Average (LWMA), Simple Moving Average (SMA), and Smoothed Moving Average (SMMA). The 'variant' function assigns the chosen method to the '_avg' variable, which is then used in the trade signal logic.
Trade Signal Generation
SMS employs a complex yet robust mechanism for generating trade signals. A stop-and-reverse system is established, which works on the principle of momentum. If the smoothed momentum is positive, an upper stop is determined and if the momentum is negative, a lower stop is defined.
The process continues by defining long and short entry conditions. The indicator goes long when an upper stop exists, and the previous bar had a lower stop, signifying a shift in momentum. The short entry condition is the opposite: the indicator goes short when a lower stop exists, and the previous bar had an upper stop. Alerts are generated for each of these conditions, helping traders to take timely action.
Visual Representation and UI Options
In terms of visual representation, the indicator plots upper and lower stops, employing green color for upper and red for lower stops. If the option to color bars is chosen, the entire bar is colored green or red, based on whether an upper or lower stop exists. This feature allows traders to visually comprehend market conditions better. Support and reisstance levels are also provided for visual context.
Conclusion
The Smoother Momentum Stops indicator is a potent tool for traders seeking to optimize their trading strategies. It blends the fundamentals of momentum and moving averages, resulting in a robust system that provides clear, reliable, and timely trading signals. By adjusting the smoothing type and period parameters, traders can customize the indicator to fit various market conditions and asset types, thereby adding a layer of flexibility to their trading strategies.
The use of a stop-and-reverse system adds a layer of risk management by offering precise entry and exit points based on momentum shifts. These stops are not just mere levels of entries or exits, but they reflect the undercurrent of the market's momentum, thus providing a dynamic framework to make informed trading decisions.
Additionally, the SMS indicator offers visual simplicity. The color-coded bars and distinct symbols for long and short positions make it easier for traders to interpret the signals and market direction quickly. Combined with the alert system, it ensures that traders never miss an important trading opportunity.
Finally, the power of the SMS indicator lies in its adaptability and comprehensive approach. By providing a selection of moving averages and an intelligent momentum-based system, it encapsulates various aspects of market behavior. As such, it is a useful tool not just for momentum traders, but for any trader who understands the significance of moving averages and momentum in predicting market movements.
In conclusion, the Smoother Momentum Stops indicator stands as an innovative, adaptable, and powerful tool for the modern trader. Its blend of flexibility, dynamic risk management, and straightforward visualization offer a comprehensive solution for traders looking to navigate the complex world of financial markets. With a detailed understanding of its workings as presented in this essay, traders can harness its full potential to optimize their strategies, manage risk, and achieve their trading objectives.
(Very promising) [Abdullah Ahmed] Momentum indicator V.1Description: MOM-LRC is a powerful technical analysis indicator designed to provide traders with signals based on the momentum of an asset's price and its deviation from its mean value. The indicator calculates the exponential RSI and uses a custom function to determine the percentage change from the mean. The upper and lower bands of the momentum channel are then calculated using linear regression of the rate of change from the mean. The channel multiplier can be adjusted to increase or decrease the sensitivity of the indicator.
How to use :
1 - Using MOM-LRC , look for buy signals when the price of the asset is below the lower border of the channel and retracing up. The opposite is true in the case of sell signals.
2 - It is also used in the case of negative and positive divergences, just as you use RSI
The indicator can be used on any time frame and any asset, making it a versatile tool for traders of all levels.
features:
Calculates exponential RSI and percentage change from the mean
Uses linear regression to calculate upper and lower bands of momentum channel
Adjustable channel multiplier for increased sensitivity
Suitable for any time frame and any asset
Happy trading!
8 Day Run - Momentum StrategyInspired by Linda Bradford Raschke.
Entry criteria:
This strategy is used to capture momentum effects on the daily periodicities. Once prices have had a run of 8 or more consecutive closes above or below the 5-period simple moving average the strategy is primed to trade.
It will then enter a short on the first close above the 5sma after a run of 8 or more closes below the 5sma (it will enter a long when the price closes below the 5sma after a run of 8 or more closes above the 5sma).
Exit criteria:
All trades are exited on the first close back above/ below the 5sma.

[EDU] RSI Momentum BandsRSI Momentum Bands serve a purpose to find best RSI momentum for entering a trade.
Indicator is built simply:
1st RSI MA is smoothed RSI by little period, 2nd RSI MA is smoothed RSI by a bigger period.
Then we calculate standard deviation from the 2nd MA and make upper and lower band.
The rules for trades are simple:
When RSI is above higher band - Buy ;
When RSI is below lower band - Sell .
The indicator is for educational purposes only to present trades a momentum bands concepts, widely used across professionals.
Hope you will find it helpful.
Take your profits!
- Tarasenko Fyodor
OBV with Volume/Momentum DivergenceCredits go to vyperphi696 and LazyBear for the original OBV with Divergence script.
This indicator has the new option to check for momentum divergence, which I have done by adding RSI and MACD data.
Hence the indicator allows combined testing of volume and momentum divergence. This feature aims to improve trend reversal detection by reducing false positives.
In summary, 3 divergence categories are shown by default as lines:
Volume + RSI + MACD (dark green/red)
Volume + RSI / Volume + MACD (light green/red)
Volume (gray)
Line colors can be adjusted via plot settings. Therefore it is also possible to distinguish Volume + RSI and Volume + MACD divergence if necessary.
Lastly, I edited the indicator scaling mechanism when changing from one timeframe to another; the transitions are smoother now. This only applies when auto-scaling is off.
