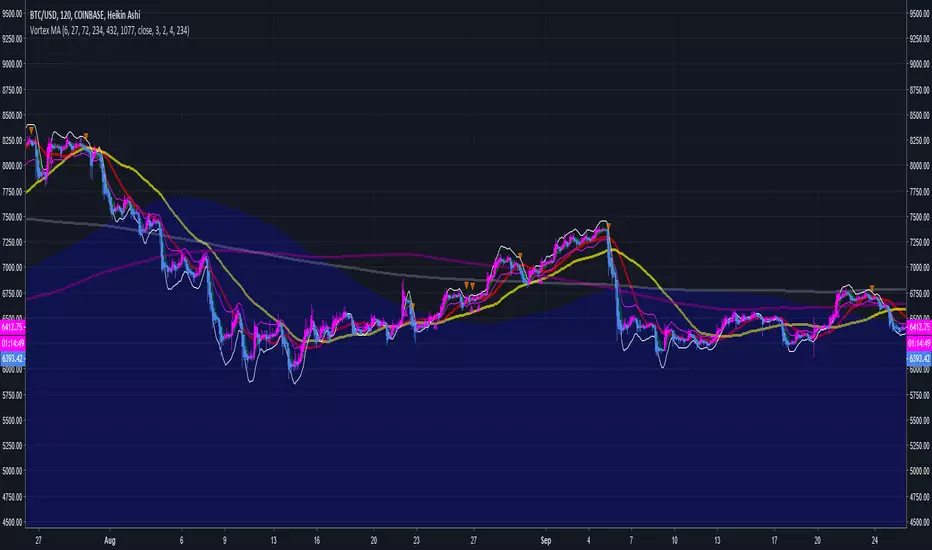
Multiple Moving Averages Alerts ScriptAlerts script that has triggers on multiple moving average crossovers so that profit is maximised, it also has an optional control moving average, enabled by default, that when active will stop trading when the price (first ma) is below the control moving average.
Source code is open so that others can use and modify
Click Below for Backtesting version:
Disclaimers, not an expert, not intended to be financial advise.
Biffy
Cari dalam skrip untuk "moving average crossover"
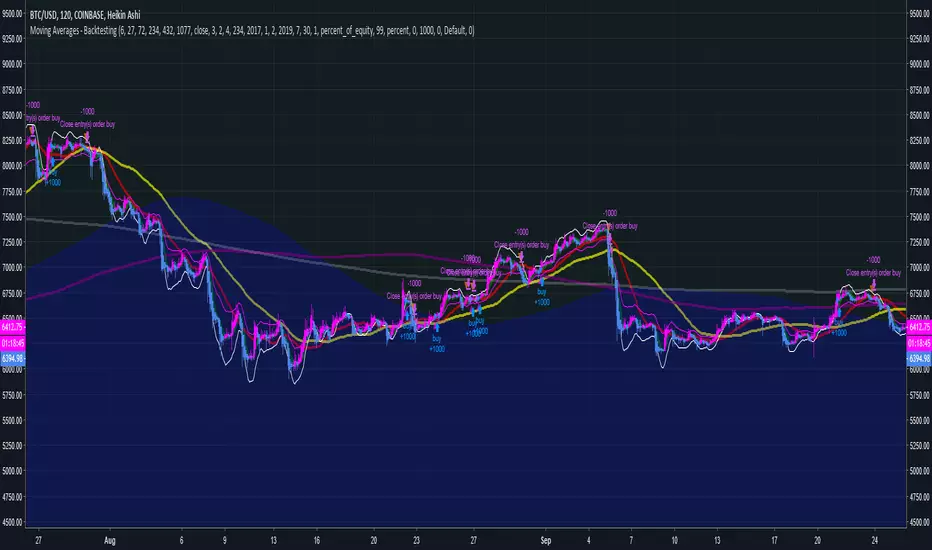
Moving Averages - BacktestingAlerts script that has triggers on multiple moving average crossovers so that profit is maximised, it also has an optional control moving average, enabled by default, that when active will stop trading when the price (first ma) is below the control moving average.
Source code is open so that others can use and modify
Click Below for Alerts Study version:
Disclaimers, not an expert, not intended to be financial advise.
Biffy
The Bear & Bull TieWhat it does:
Bear & Bull Tie is a moving average crossover indicator that identifies trend reversals and generates entry/exit signals based on the relationship between price and three simple moving averages (SMA 21, SMA 55, SMA 89). The indicator combines these three MAs into an Average Moving Average (AMA) to confirm directional bias, then uses ATR (Average True Range) volatility measurement for dynamic position sizing and stop-loss placement.
How it works:
The indicator operates on a simple but effective principle: it enters a bullish trend when price closes above all three moving averages simultaneously, and enters a bearish trend when price closes below all three MAs simultaneously. This "three MA alignment" approach filters out noise and confirms genuine trend changes. The indicator then plots:
Entry levels at the highest MA during uptrends or lowest MA during downtrends
Stop-loss zones calculated using 2x ATR distance from entry prices
Trend confirmation fill between price and the Average Moving Average, color-coded blue for bullish and red for bearish
The ATR-based stop-loss sizing adapts to market volatility, making it suitable for different market conditions and timeframes.
How to use it:
Monitor the filled zones to visually confirm your trend bias
Watch for alerts when new long or short setups form; entry prices and ATR-based stops are displayed on the chart
Trade the zones between your entry level and stop-loss zone, adjusting position size based on your risk tolerance
Exit when colors reverse to indicate trend termination
The indicator works best on higher timeframes (1H and above) where trend clarity is stronger and false signals are reduced.
Alerts: FOR AUTOMATION / NOTIFICATION's (create an alert for B/B tie (2, 4) that uses Any Alert / Function Call )
Long Positions:
entries ---> "Bull Tie on NVDA | Entry : 100.5 | ATR Stop : 99.5"
exits ------> "Bull Tie on NVDA | Exit : 110.1"
Short Positions:
entries ---> "Bear Tie on NVDA | Entry : 120.05 | ATR Stop : 85.05"
exits -----> "Bear Tie on NVDA | Exit : 100"
Credits:
This script incorporates concepts and code portions from @LOKEN94 with his explicit permission. Special thanks for the foundational logic that inspired this development.
Disclaimer:
This indicator is for educational and analytical purposes. It is not financial advice. Past performance does not guarantee future results. Always manage risk properly and use stops. Test thoroughly on historical data before live trading.

Lyapunov Market Instability (LMI)Lyapunov Market Instability (LMI)
What is Lyapunov Market Instability?
Lyapunov Market Instability (LMI) is a revolutionary indicator that brings chaos theory from theoretical physics into practical trading. By calculating Lyapunov exponents—a measure of how rapidly nearby trajectories diverge in phase space—LMI quantifies market sensitivity to initial conditions. This isn't another oscillator or trend indicator; it's a mathematical lens that reveals whether markets are in chaotic (trending) or stable (ranging) regimes.
Inspired by the meditative color field paintings of Mark Rothko, this indicator transforms complex chaos mathematics into an intuitive visual experience. The elegant simplicity of the visualization belies the sophisticated theory underneath—just as Rothko's seemingly simple color blocks contain profound depth.
Theoretical Foundation (Chaos Theory & Lyapunov Exponents)
In dynamical systems, the Lyapunov exponent (λ) measures the rate of separation of infinitesimally close trajectories:
λ > 0: System is chaotic—small changes lead to dramatically different outcomes (butterfly effect)
λ < 0: System is stable—trajectories converge, perturbations die out
λ ≈ 0: Edge of chaos—transition between regimes
Phase Space Reconstruction
Using Takens' embedding theorem , we reconstruct market dynamics in higher dimensions:
Time-delay embedding: Create vectors from price at different lags
Nearest neighbor search: Find historically similar market states
Trajectory evolution: Track how these similar states diverged over time
Divergence rate: Calculate average exponential separation
Market Application
Chaotic markets (λ > threshold): Strong trends emerge, momentum dominates, use breakout strategies
Stable markets (λ < threshold): Mean reversion dominates, fade extremes, range-bound strategies work
Transition zones: Market regime about to change, reduce position size, wait for confirmation
How LMI Works
1. Phase Space Construction
Each point in time is embedded as a vector using historical prices at specific delays (τ). This reveals the market's hidden attractor structure.
2. Lyapunov Calculation
For each current state, we:
- Find similar historical states within epsilon (ε) distance
- Track how these initially similar states evolved
- Measure exponential divergence rate
- Average across multiple trajectories for robustness
3. Signal Generation
Chaos signals: When λ crosses above threshold, market enters trending regime
Stability signals: When λ crosses below threshold, market enters ranging regime
Divergence detection: Price/Lyapunov divergences signal potential reversals
4. Rothko Visualization
Color fields: Background zones represent market states with Rothko-inspired palettes
Glowing line: Lyapunov exponent with intensity reflecting market state
Minimalist design: Focus on essential information without clutter
Inputs:
📐 Lyapunov Parameters
Embedding Dimension (default: 3)
Dimensions for phase space reconstruction
2-3: Simple dynamics (crypto/forex) - captures basic momentum patterns
4-5: Complex dynamics (stocks/indices) - captures intricate market structures
Higher dimensions need exponentially more data but reveal deeper patterns
Time Delay τ (default: 1)
Lag between phase space coordinates
1: High-frequency (1m-15m charts) - captures rapid market shifts
2-3: Medium frequency (1H-4H) - balances noise and signal
4-5: Low frequency (Daily+) - focuses on major regime changes
Match to your timeframe's natural cycle
Initial Separation ε (default: 0.001)
Neighborhood size for finding similar states
0.0001-0.0005: Highly liquid markets (major forex pairs)
0.0005-0.002: Normal markets (large-cap stocks)
0.002-0.01: Volatile markets (crypto, small-caps)
Smaller = more sensitive to chaos onset
Evolution Steps (default: 10)
How far to track trajectory divergence
5-10: Fast signals for scalping - quick regime detection
10-20: Balanced for day trading - reliable signals
20-30: Slow signals for swing trading - major regime shifts only
Nearest Neighbors (default: 5)
Phase space points for averaging
3-4: Noisy/fast markets - adapts quickly
5-6: Balanced (recommended) - smooth yet responsive
7-10: Smooth/slow markets - very stable signals
📊 Signal Parameters
Chaos Threshold (default: 0.05)
Lyapunov value above which market is chaotic
0.01-0.03: Sensitive - more chaos signals, earlier detection
0.05: Balanced - optimal for most markets
0.1-0.2: Conservative - only strong trends trigger
Stability Threshold (default: -0.05)
Lyapunov value below which market is stable
-0.01 to -0.03: Sensitive - quick stability detection
-0.05: Balanced - reliable ranging signals
-0.1 to -0.2: Conservative - only deep stability
Signal Smoothing (default: 3)
EMA period for noise reduction
1-2: Raw signals for experienced traders
3-5: Balanced - recommended for most
6-10: Very smooth for position traders
🎨 Rothko Visualization
Rothko Classic: Deep reds for chaos, midnight blues for stability
Orange/Red: Warm sunset tones throughout
Blue/Black: Cool, meditative ocean depths
Purple/Grey: Subtle, sophisticated palette
Visual Options:
Market Zones : Background fields showing regime areas
Transitions: Arrows marking regime changes
Divergences: Labels for price/Lyapunov divergences
Dashboard: Real-time state and trading signals
Guide: Educational panel explaining the theory
Visual Logic & Interpretation
Main Elements
Lyapunov Line: The heart of the indicator
Above chaos threshold: Market is trending, follow momentum
Below stability threshold: Market is ranging, fade extremes
Between thresholds: Transition zone, reduce risk
Background Zones: Rothko-inspired color fields
Red zone: Chaotic regime (trending)
Gray zone: Transition (uncertain)
Blue zone: Stable regime (ranging)
Transition Markers:
Up triangle: Entering chaos - start trend following
Down triangle: Entering stability - start mean reversion
Divergence Signals:
Bullish: Price makes low but Lyapunov rising (stability breaking down)
Bearish: Price makes high but Lyapunov falling (chaos dissipating)
Dashboard Information
Market State: Current regime (Chaotic/Stable/Transitioning)
Trading Bias: Specific strategy recommendation
Lyapunov λ: Raw value for precision
Signal Strength: Confidence in current regime
Last Change: Bars since last regime shift
Action: Clear trading directive
Trading Strategies
In Chaotic Regime (λ > threshold)
Follow trends aggressively: Breakouts have high success rate
Use momentum strategies: Moving average crossovers work well
Wider stops: Expect larger swings
Pyramid into winners: Trends tend to persist
In Stable Regime (λ < threshold)
Fade extremes: Mean reversion dominates
Use oscillators: RSI, Stochastic work well
Tighter stops: Smaller expected moves
Scale out at targets: Trends don't persist
In Transition Zone
Reduce position size: Uncertainty is high
Wait for confirmation: Let regime establish
Use options: Volatility strategies may work
Monitor closely: Quick changes possible
Advanced Techniques
- Multi-Timeframe Analysis
- Higher timeframe LMI for regime context
- Lower timeframe for entry timing
- Alignment = highest probability trades
- Divergence Trading
- Most powerful at regime boundaries
- Combine with support/resistance
- Use for early reversal detection
- Volatility Correlation
- Chaos often precedes volatility expansion
- Stability often precedes volatility contraction
- Use for options strategies
Originality & Innovation
LMI represents a genuine breakthrough in applying chaos theory to markets:
True Lyapunov Calculation: Not a simplified proxy but actual phase space reconstruction and divergence measurement
Rothko Aesthetic: Transforms complex math into meditative visual experience
Regime Detection: Identifies market state changes before price makes them obvious
Practical Application: Clear, actionable signals from theoretical physics
This is not a combination of existing indicators or a visual makeover of standard tools. It's a fundamental rethinking of how we measure and visualize market dynamics.
Best Practices
Start with defaults: Parameters are optimized for broad market conditions
Match to your timeframe: Adjust tau and evolution steps
Confirm with price action: LMI shows regime, not direction
Use appropriate strategies: Chaos = trend, Stability = reversion
Respect transitions: Reduce risk during regime changes
Alerts Available
Chaos Entry: Market entering chaotic regime - prepare for trends
Stability Entry: Market entering stable regime - prepare for ranges
Bullish Divergence: Potential bottom forming
Bearish Divergence: Potential top forming
Chart Information
Script Name: Lyapunov Market Instability (LMI) Recommended Use: All markets, all timeframes Best Performance: Liquid markets with clear regimes
Academic References
Takens, F. (1981). "Detecting strange attractors in turbulence"
Wolf, A. et al. (1985). "Determining Lyapunov exponents from a time series"
Rosenstein, M. et al. (1993). "A practical method for calculating largest Lyapunov exponents"
Note: After completing this indicator, I discovered @loxx's 2022 "Lyapunov Hodrick-Prescott Oscillator w/ DSL". While both explore Lyapunov exponents, they represent independent implementations with different methodologies and applications. This indicator uses phase space reconstruction for regime detection, while his combines Lyapunov concepts with HP filtering.
Disclaimer
This indicator is for research and educational purposes only. It does not constitute financial advice or provide direct buy/sell signals. Chaos theory reveals market character, not future prices. Always use proper risk management and combine with your own analysis. Past performance does not guarantee future results.
See markets through the lens of chaos. Trade the regime, not the noise.
Bringing theoretical physics to practical trading through the meditative aesthetics of Mark Rothko
Trade with insight. Trade with anticipation.
— Dskyz , for DAFE Trading Systems

Optimized Auto-Detect Strategy (MA, ATR, Trend, RSI) Overview
This script is designed for traders seeking a trend-following approach that adapts to different currency pairs (e.g., EURUSD, NZDUSD, XAUUSD). It combines moving average crossovers with ATR-based stops, optional trend filters, and RSI filters to help reduce false signals and capture larger moves.
Key Features
1. Auto-Detect Logic
- Automatically applies different moving average periods and ATR multipliers based on the symbol (e.g., XAUUSD, EURUSD, NZDUSD).
- Makes it easy to switch charts without manually adjusting parameters each time.
2. ATR-Based Stop
- Uses the Average True Range (ATR) to set dynamic stop-loss levels, adapting to each market’s volatility.
3. Optional Trend Filter
- Filters out trades if price is below the 200 SMA for longs (and above for shorts), aiming to avoid choppy, range-bound markets.
4. Optional RSI Filter
- Only enters long if RSI is above a certain threshold (e.g., 50), or short if below another threshold, reducing entries during low momentum.
5. Partial Exit & Trailing/Break-Even
- Locks in partial profit at a chosen R:R (e.g., 1:1), then either trails the remaining position or moves the stop to break-even.
- This helps capture additional gains if the trend extends beyond the initial target.
6. Customizable Parameters
- You can toggle on/off each filter (Trend, RSI) and adjust the ATR multiplier, MA periods, partial exit levels, etc.
- Allows easy optimization for different pairs or timeframes.
How to Use
1. Add to Chart: Click “Add to chart” in the Pine Editor.
2. Configure Inputs: In the script’s settings, toggle the filters you want (Trend Filter, RSI Filter, etc.) and set your desired ATR multiplier, RSI thresholds, partial exit ratio, etc.
3. Strategy Tester: Check the performance under the “Strategy Tester” tab. Adjust parameters if needed.
4. Realistic Settings: Consider adding spreads/commissions in the “Properties” tab for more accurate backtests, especially if you trade pairs with higher spreads (like XAUUSD).
Disclaimer
No Guarantee: This script does not guarantee profits. Markets are unpredictable, and results may vary with market conditions.
For Educational Purposes: Always do your own research and forward testing. Past performance does not indicate future results.

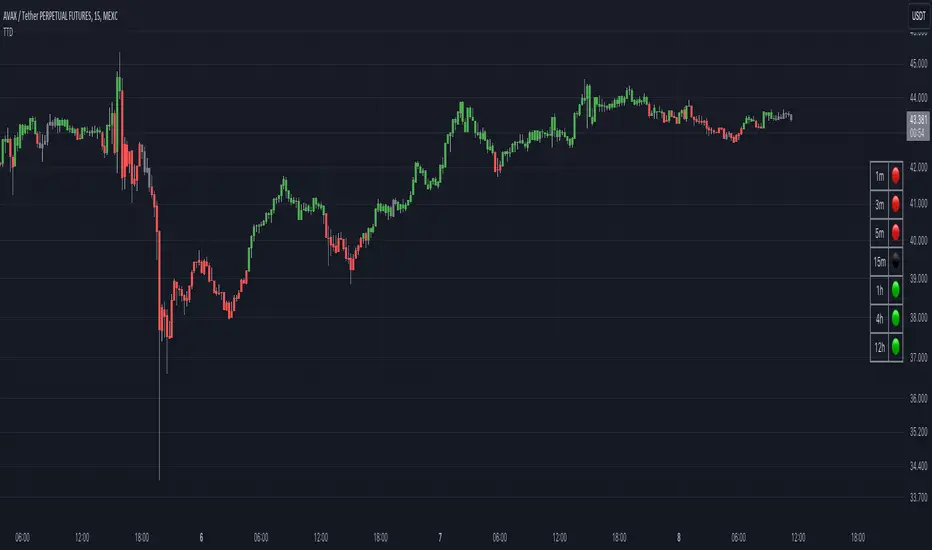
Traders Trend DashboardThe Traders Trend Dashboard (TTD) is a comprehensive trend analysis tool designed to assist traders in making informed trading decisions across various markets and timeframes. Unlike conventional trend-following scripts, TTD goes beyond simple trend detection by incorporating a unique combination of moving averages and a visual dashboard, providing traders with a clear and actionable overview of market trends. Here's how TTD stands out from the crowd:
Originality and Uniqueness:
TTD doesn't rely on just one moving average crossover to detect trends. Instead, it employs a dynamic approach by comparing two moving averages of distinct periods across multiple timeframes. This innovative methodology enhances trend detection accuracy and reduces false signals commonly associated with single moving average systems.
Market Applicability:
TTD is versatile and adaptable to various financial markets, including forex, stocks, cryptocurrencies, and commodities. Its flexibility ensures that traders can utilize it across different asset classes and capitalize on market opportunities.
Optimal Timeframe Utilization:
Unlike many trend indicators that work best on specific timeframes, TTD caters to traders with diverse trading preferences. It offers support for intraday trading (1m, 3m, 5m), short-term trading (15m, 30m, 1h), and swing trading (4h, D, W, M), making it suitable for a wide range of trading styles.
Underlying Conditions and Interpretation:
TTD is particularly effective during trending markets, where its multi-timeframe approach helps identify consistent trends across various time horizons. In ranging markets, TTD can indicate potential reversals or areas of uncertainty when moving averages converge or cross frequently.
How to Use TTD:
1. Timeframe Selection: Choose the relevant timeframes based on your trading style and preferences. Enable or disable timeframes in the settings to focus on the most relevant ones for your strategy.
2. Dashboard Interpretation: The TTD dashboard displays green (🟢) and red (🔴) symbols to indicate the relationship between two moving averages. A green symbol suggests that the shorter moving average is above the longer one, indicating a potential bullish trend. A red symbol suggests the opposite, indicating a potential bearish trend.
3. Confirmation and Strategy: Consider TTD signals as confirmation for your trading strategy. For instance, in an uptrend, look for long opportunities when the dashboard displays consistent green symbols. Conversely, in a downtrend, focus on short opportunities when red symbols dominate.
4. Risk Management: As with any indicator, use TTD in conjunction with proper risk management techniques. Avoid trading solely based on indicator signals; instead, integrate them into a comprehensive trading plan.
Conclusion:
The Traders Trend Dashboard (TTD) offers traders a powerful edge in trend analysis, combining innovation, versatility, and clarity. By understanding its unique methodology and integrating its signals with your trading strategy, you can make more informed trading decisions across various markets and timeframes. Elevate your trading with TTD and unlock a new level of trend analysis precision.
Oliver Velez IndicatorOliver Velez is a well-known trader and educator who has developed multiple trading strategies. One of them is the 20-200sma strategy, which is a basic moving average crossover strategy. The strategy involves using two simple moving averages (SMAs) - a short-term SMA with a period of 20 and a long-term SMA with a period of 200 - on a 2-minute timeframe chart.
When the short-term SMA crosses above the long-term SMA, it signals a potential bullish trend and traders may look for opportunities to enter a long position. Conversely, when the short-term SMA crosses below the long-term SMA, it signals a potential bearish trend and traders may look for opportunities to enter a short position.
Traders using this strategy may also look for additional confirmations, such as price action signals or other technical indicators, before entering or exiting a trade. It is important to note that no trading strategy can guarantee profits, and traders should always use risk management techniques to limit potential losses.
This script is an implementation of the 2 SMA's (can also choose other types of MA's), with Elephant Bar Indicator (EBI) and the Tail Bars Indicator in TradingView.
The Elephant Bar Indicator is a technical indicator used in trading to identify potential trend reversals in the market. It is named after the large size of the bullish or bearish candlestick that it represents. The Tail Bars Indicator is a pattern recognition technique that identifies candlestick patterns with long tails or wicks.
The script starts by defining the input parameters for both indicators. For the Elephant Bar Indicator, the user inputs the lookback period and the size multiplier. For the Tail Bars Indicator, the user inputs the tail ratio and opposite wick ratio.
Next, the script calculates the moving averages of the closing price over the defined short and long periods using the Moving Average function. The script then calculates the average candle size and volume over the lookback period.
The script then identifies the Elephant Bars and Tail Bars using the input parameters and additional conditions. For Elephant Bars, the script identifies bullish and bearish bars that meet certain criteria, such as a size greater than the average candle size and volume greater than the average volume.
For Tail Bars, the script identifies bullish and bearish bars that have long tails or wicks and meet certain criteria such as opposite wick size less than or equal to the tail size multiplied by the input opposite wick ratio.
Finally, the script plots the Elephant Bar and Tail Bar signals on the chart using different colors and shapes. The script also plots the moving averages and Keltner Channels to help traders identify potential trend reversals.
It is still under development, so please, if someone has ideas to add, more than welcome
Trend-Quality IndicatorBINANCE:BTCUSDT
Open source version of the Trend-Quality Indicator as described by David Sepiashvili in [ Stocks & Commodities V. 22:4 (14-20) ]
Q-Indicator and B-Indicator are available both separately or together
█ OVERVIEW
The Trend-Quality indicator is a trend detection and estimation tool that is based on a two-step filtering technique. It measures cumulative price changes over term-oriented semicycles and relates them to “noise”. The approach reveals congestion and trending periods of the price movement and focuses on the most important trends, evaluating their strength in the process. The indicator is presented in a centered oscillator (Q-Indicator) and banded oscillator format (B-Indicator).
Semicycles are determined by using a short term and a longer term EMAs. The starting points for the cycles are determined by the moving averages crossover.
Cumulative price change (CPC) indicator measures the amount that the price has changed from a fixed starting point within a given semicycle. The CPC indicator is calculated as a cumulative sum of differences between the current and previous prices over the period from the fixed starting point.
The trend within the given semicycle can be found by calculating the moving average of the cumulative price change.
The noise can be defined as the average deviation of the cumulative price change from the trend. To determine linear noise, we calculate the absolute value of the difference between CPC and trend, and then smooth it over the n-point period. The root mean square noise, similar to the conventional standard deviation, can be derived by summing the squares of the difference between CPC and trend over each of the preceding n-point periods, dividing the sum by n, and calculating the square root of the result.
█ Q-INDICATOR
The Q-Indicator is a centered oscillator that fluctuates around a zero line with no upper or lower limits, is calculated by dividing trend by noise.
The Q-Indicator is intended to measure trend activity. The further the Q is from 0, the less the risk of trading with a trend, and the more reliable the trading opportunity. Values exceeding +2 or -2 can be qualified as promising
Values:
in the -1 to +1 range (GRAY) indicate that the trend is buried beneath noise. It is preferable to stay out of this zone
in the +1 to +2 or -1 to -2 range (YELLOW) indicate weak trending
in the +2 to +5 range (BLUE) or -2 to -5 range (ORANGE) indicate moderate trending
above +5 range (GREEN) or below -5 (RED) indicate strong trending
Readings exceeding strong trending levels can indicate overbought or oversold conditions and signal that price action should be monitored closely.
█ B-INDICATOR
The B-Indicator is a banded oscillator that fluctuates between 0 and 100, is calculated by dividing the absolute value of trend by noise added to absolute value of trend, and scaling the result appropriately.
The B-indicator doesn’t show the direction of price movement, but only the existence of the trend and its strength. It requires additional tools for reversal manifestations.
The indicator’s interpretation is simple. The central line suggests that the trend and noise are in equilibrium (trend is equal to noise).
Values:
below 50 (GRAY) indicate ranging market
in the 50 to 65 range (YELLOW) indicate weak trending
in the 65 to 80 range (BLUE) indicate moderate trending
above 80 (GREEN) indicate strong trending
The 65 level can be thought of as the demarcation line of trending and ranging markets and can help determine which type of technical analysis indicator (lagging or leading) is better suited to current market conditions. Readings exceeding strong trending levels can indicate overbought or oversold conditions.

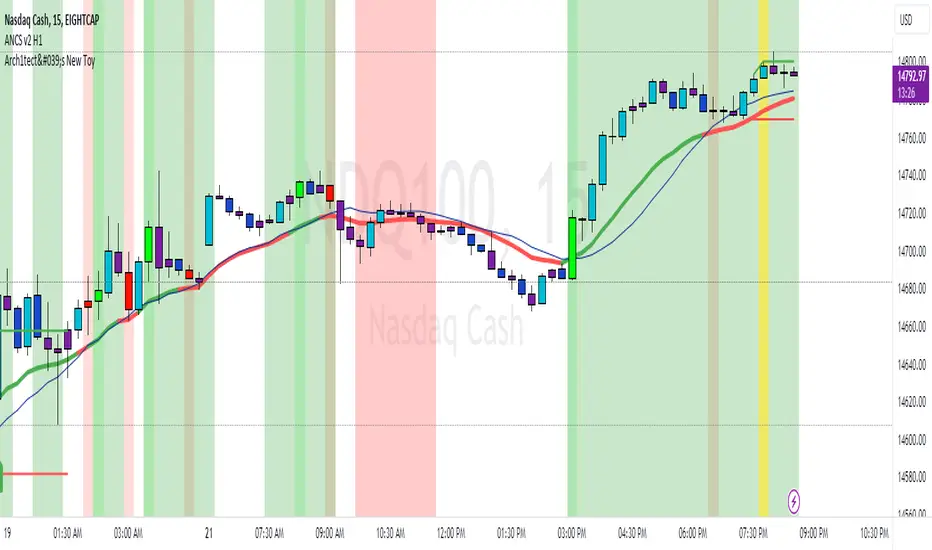
Arch1tect's New ToyDescription:
Arch1tect's New Toy tries to predict market trends by simply utilising 2 moving averages crossovers.
How it works:
Buy signals are triggered when the faster MA crosses over the slower MA from the downside to the upside.
Sell signals are triggered when the faster MA crosses under the slower MA from the upside to the downside.
How to use:
Take buys when buy signal is triggered AND close existing sell position
Take sells when sell signal is triggered AND close existing buy position
Note:
Settings are optimised for XAUUSD on the M1 chart.
Extra:
Alerts are included.
You can toggle between EMA , WMA and SMA to your liking.
Strategy Tester version:
Arch1tect's New Toy (Strategy Tester Version)Description:
The version of Arch1tect's New Toy indicator with Strategy Tester added.
This indicator tries to predict market trends by simply utilising 2 moving averages crossovers.
How it works:
Buy signals are triggered when the faster MA crosses over the slower MA from the downside to the upside.
Sell signals are triggered when the faster MA crosses under the slower MA from the upside to the downside.
How to use:
Take buys when buy signal is triggered AND close existing sell position
Take sells when sell signal is triggered AND close existing buy position
Note:
Settings are optimised for XAUUSD on the M1 chart.
Extra:
Alerts are included.
You can toggle between EMA, WMA and SMA to your liking.
Indicator version:

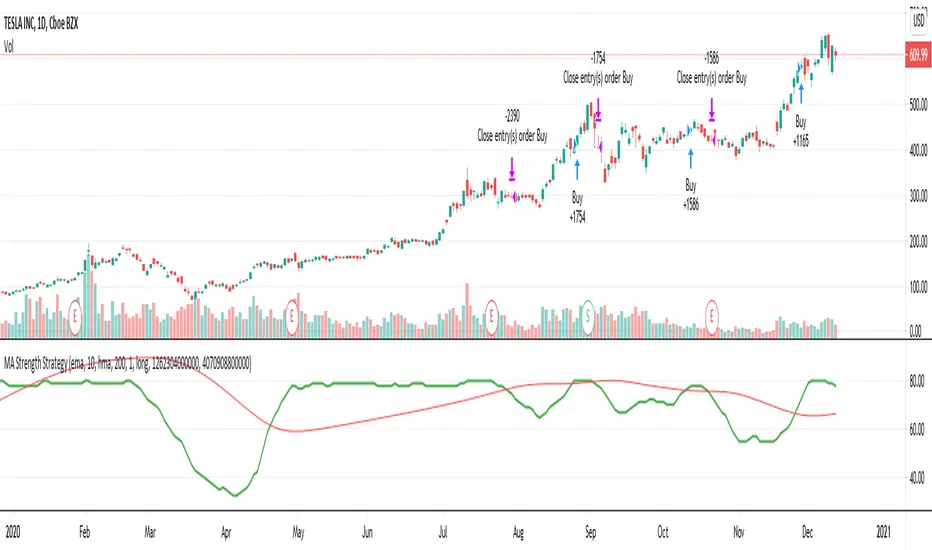
MA Strength StrategyThis is based on Aligned Moving Average Index published earlier:
But, instead of scoring trend based on how many moving averages are aligned, we are considering upside score. Higher scores are assigned for slower moving averages and lower scores for faster moving averages to give more stress to long term trend.
Buy/Sell conditions are based on moving average crossover on the upside score sum of Loopback days.
This is a very rough idea which seems to have been working ok on long only trades. Can be further improved.
[blackcat] L1 Stick-Line Merged MACDLevel: 1
Background
The MACD is a superior derivative of moving average crossovers and was developed by Gerald Appel in 1979 as a market timing tool. MACD uses two exponential moving averages with different bar periods, which are then subtracted to form what Mr. Appel calls the Fast Line. A 9-period moving average of the fast line creates the slow line.
Function
L1 Stick-Line Merged MACD merges dif and dea lines with macd sticks by the same color candles. The generation of candles help to confirm the trend contiuation. E.g. yellow candles indicate up trend continuation while blue candles indicate down trend continuation
Key Signal
dif --> classic MACD diff fast line in yellow
dea --> classic MACD dea slow line in fuchsia
macd --> classic difference histogram
upslmerge --> up trend continuation yellow candle merge condition
dnslmerge --> down trend continuation blue candle merge condition
Pros and Cons
Pros:
1. merged line and stick with candles help confirm trend reversal
2. long entry signal is indicated.
Cons:
1. need sophisticated knowledge of MACD to use this well
2. this still requires a lot of MACD experience to obtain reliable trading signals
Remarks
Merge lines and sticks of MACD into candles. Better view of the trend
Readme
In real life, I am a prolific inventor. I have successfully applied for more than 60 international and regional patents in the past 12 years. But in the past two years or so, I have tried to transfer my creativity to the development of trading strategies. Tradingview is the ideal platform for me. I am selecting and contributing some of the hundreds of scripts to publish in Tradingview community. Welcome everyone to interact with me to discuss these interesting pine scripts.
The scripts posted are categorized into 5 levels according to my efforts or manhours put into these works.
Level 1 : interesting script snippets or distinctive improvement from classic indicators or strategy. Level 1 scripts can usually appear in more complex indicators as a function module or element.
Level 2 : composite indicator/strategy. By selecting or combining several independent or dependent functions or sub indicators in proper way, the composite script exhibits a resonance phenomenon which can filter out noise or fake trading signal to enhance trading confidence level.
Level 3 : comprehensive indicator/strategy. They are simple trading systems based on my strategies. They are commonly containing several or all of entry signal, close signal, stop loss, take profit, re-entry, risk management, and position sizing techniques. Even some interesting fundamental and mass psychological aspects are incorporated.
Level 4 : script snippets or functions that do not disclose source code. Interesting element that can reveal market laws and work as raw material for indicators and strategies. If you find Level 1~2 scripts are helpful, Level 4 is a private version that took me far more efforts to develop.
Level 5 : indicator/strategy that do not disclose source code. private version of Level 3 script with my accumulated script processing skills or a large number of custom functions. I had a private function library built in past two years. Level 5 scripts use many of them to achieve private trading strategy.

[blackcat] L1 Another Improved MACD IndicatorLevel: 1
Background
The MACD is a superior derivative of moving average crossovers and was developed by Gerald Appel in 1979 as a market timing tool. MACD uses two exponential moving averages with different bar periods, which are then subtracted to form what Mr. Appel calls the Fast Line. A 9-period moving average of the fast line creates the slow line.
Function
L1 Another Improved MACD Indicator improves MACD histogram by customized an algorithm and add three levels of long entry alerts derived from ema ().
Key Signal
diff --> classic MACD diff fast line in white
dea --> classic MACD dea slow line in yellow
macd --> classic difference histogram,but I did not use it directly in the plot.
macd1 --> ema3 of macd
Pros and Cons
Pros:
1. more clear sub level trend change with new histograms
Cons:
1. need sophisticated knowledge of MACD to use this well
2. this still requires a lot of MACD experience to obtain reliable trading signals
Remarks
Another improved MACD on histogram
Readme
In real life, I am a prolific inventor. I have successfully applied for more than 60 international and regional patents in the past 12 years. But in the past two years or so, I have tried to transfer my creativity to the development of trading strategies. Tradingview is the ideal platform for me. I am selecting and contributing some of the hundreds of scripts to publish in Tradingview community. Welcome everyone to interact with me to discuss these interesting pine scripts.
The scripts posted are categorized into 5 levels according to my efforts or manhours put into these works.
Level 1 : interesting script snippets or distinctive improvement from classic indicators or strategy. Level 1 scripts can usually appear in more complex indicators as a function module or element.
Level 2 : composite indicator/strategy. By selecting or combining several independent or dependent functions or sub indicators in proper way, the composite script exhibits a resonance phenomenon which can filter out noise or fake trading signal to enhance trading confidence level.
Level 3 : comprehensive indicator/strategy. They are simple trading systems based on my strategies. They are commonly containing several or all of entry signal, close signal, stop loss, take profit, re-entry, risk management, and position sizing techniques. Even some interesting fundamental and mass psychological aspects are incorporated.
Level 4 : script snippets or functions that do not disclose source code. Interesting element that can reveal market laws and work as raw material for indicators and strategies. If you find Level 1~2 scripts are helpful, Level 4 is a private version that took me far more efforts to develop.
Level 5 : indicator/strategy that do not disclose source code. private version of Level 3 script with my accumulated script processing skills or a large number of custom functions. I had a private function library built in past two years. Level 5 scripts use many of them to achieve private trading strategy.
[blackcat] L1 Improved MACD IndicatorLevel: 1
Background
The MACD is a superior derivative of moving average crossovers and was developed by Gerald Appel in 1979 as a market timing tool. MACD uses two exponential moving averages with different bar periods, which are then subtracted to form what Mr. Appel calls the Fast Line. A 9-period moving average of the fast line creates the slow line.
Function
L1 Improved MACD Indicator mainly improves MACD histogram by customized an algorithm and add three levels of long entry alerts derived from ema().
Key Signal
buy1 --> the 1st level of buy alert in green
buy2 --> the 2nd level of buy alert in lime
buy3 --> the 3rd level of buy alert in yellow
diff --> classic MACD diff fast line in white
dea --> classic MACD dea slow line in yellow
macd --> classic difference histogram,but I did not use it directly in the plot.
Pros and Cons
Pros:
1. more clear sub level trend change with new histograms
2. three levels of buy alerts
Cons:
1. need sophisticated knowledge of MACD to use this well
2. this still requires a lot of MACD experience to obtain reliable trading signals
Remarks
I am a fan of MACD. Even the most classic MACD can have in-depth usage. I think MACD is the king of indicators.
Readme
In real life, I am a prolific inventor. I have successfully applied for more than 60 international and regional patents in the past 12 years. But in the past two years or so, I have tried to transfer my creativity to the development of trading strategies. Tradingview is the ideal platform for me. I am selecting and contributing some of the hundreds of scripts to publish in Tradingview community. Welcome everyone to interact with me to discuss these interesting pine scripts.
The scripts posted are categorized into 5 levels according to my efforts or manhours put into these works.
Level 1 : interesting script snippets or distinctive improvement from classic indicators or strategy. Level 1 scripts can usually appear in more complex indicators as a function module or element.
Level 2 : composite indicator/strategy. By selecting or combining several independent or dependent functions or sub indicators in proper way, the composite script exhibits a resonance phenomenon which can filter out noise or fake trading signal to enhance trading confidence level.
Level 3 : comprehensive indicator/strategy. They are simple trading systems based on my strategies. They are commonly containing several or all of entry signal, close signal, stop loss, take profit, re-entry, risk management, and position sizing techniques. Even some interesting fundamental and mass psychological aspects are incorporated.
Level 4 : script snippets or functions that do not disclose source code. Interesting element that can reveal market laws and work as raw material for indicators and strategies. If you find Level 1~2 scripts are helpful, Level 4 is a private version that took me far more efforts to develop.
Level 5 : indicator/strategy that do not disclose source code. private version of Level 3 script with my accumulated script processing skills or a large number of custom functions. I had a private function library built in past two years. Level 5 scripts use many of them to achieve private trading strategy.
Scripting Tutorial 5 - Triple Many Moving Averages CrossoversThis script is for a triple moving average indicator where the user can select from different types of moving averages and periods. This script improves upon tutorial 3 by adding source selection for MAs and another option for an MA that is not built-in, the HMA . It is meant as an educational script with well formatted styling, and references for specific functions.
Simple TrenderOriginates from:
I was reading some Impulse Trading literature by A. Elder.. In it, someone named Kerry Lovvorn proposed "An End of Day Trend Following System" for someone lazy.
Originally it is just price closing above an 8 ema (low) for long. Exit when price closes below an 8 ema (low). The opposite for a short position.
Conditions: Buy when price closed below ema (low) for two bars or more, then closes above. Opposite for a short position. I do not follow this condition. Though it may help with whipsaw.
My condition is when price closes above the 26 ema (low) (works the best for me) I place orders above the initial crossing bars high. Opposite for lows.
I look for stocks that are low in price to go long on. I want the run from 2's to 15's
I look for stocks that are mid-teens/20's in price to go short on. I want the run from 20's to 2's
I look for stock with news and earnings that are already running (up or down) to play the pullback.
These conditions can easily be scanned for on thinkorswim
From first glance, the system looks like CMsling shotsystem. Although, I plagiarized some parts of the codes, because I am inept when it comes to that shit, it differs as it is not a moving average crossover system.
It is a price crossing over concept. A moving average VWAP is used for best entries on pullbacks.
Purpose:
--To catch the majority of a trend/wave/run.
--To identify pullback areas to go long or short while in midst of trend. To catch pullbacks off news and earning runners.
--To catch the initial start of trend with clear rules to enter
--Clear rules to exit
Issues
--possibilities of getting ninja sliced the fuck up. Can be mitigated by entering stocks with decent average volume. And also only going long above 200 ema and short below it. ADX won't work, at the initial start of the trend it will show not trending. Can look at blow off volume at the bottom followed by increase in buying for long and vice versa for short.
--Can give some huge gains away through gap ups or gap downs from news or earnings during trend. However, can get huge gain on gaps from news or earning. Nature of the game.
--Need some brass balls and a supply of pepto to stomach through some of the pullbacks. Gut wrenching seeing big gains dwindle. But they all even out at the end, you hope. (see NBEV and IGC, and CRON and others. shit don't go in straight lines, homie)
Pros
--It's simple and easy. Overall, you profit
--works with any security
Cons
--It can be stressful.
--does not work well on lower time frames. Do not recommend going below 15 minutes
--Possibility of working on 5 minutes with a time frame breakout strategy (15,30 min).
Couple it with LazyBear "Weis Wave Volume" indicator. Works well for pullback entries.
Enjoy. Ride some waves.

Predictive EMAFrom the MQL5 Indicator database, here is what the author said about the script,
"Goal of this indicator:
Given three EMA's of varying lengths, use their values
for a estimator of "where we are now" or will be in the near future.
This is a very simplistic method, better ones are probably found
in the signal processing and target tracking literature.
A Kalman filter has been known since the 1950's 1960's and there
is better still. Nevertheless this is easily programmable in the
typical environments of a retail trading application like Metatrader4.
Method:
An an exponential moving average (EMA) or a simple moving average (SMA), for that
matter, have a bandwidth parameter 'L', the effective length of the window. This
is in units of time or, really, inverse of frequency. Higher L means a lower
frequency effect.
With a parameter L, the weighted time index of the EMA and SMA is (L-1)/2. Example:
take an SMA of the previous 5 values: -5 -4 -3 -2 -1 now. The average "amount of time"
back in the past of the data which go in to the SMA is hence -3, or (L-1)/2. Same applies
for an EMA. The standard parameterization makes this correspondence between EMA
and SMA.
Therefore the idea here is to take two different EMA's, a longer, and
a shorter of lengths L1 and L2 (L2 <L1). Now take the pairs:
which defines a line.
Extrapolate to , solve for y and that is the predictive EMA estimate.
Application:
Traditional moving averages, as simple-minded linear filters, have significant group delay.
In engineering that isn't so important as nobody cares if your sound from your iPod is delayed
a few milliseconds after it is first processed. But in markets, you can't
trade on the smoothed price, only the actual noisy, market price now. Hence you
ought to estimate better.
This statistic (what math/science people call what technical analysts call an 'indicator')
may be useful as the "fast" moving average in a moving average crossover trading system.
It could also be useful for the slow moving average as well.
For instance, on a 5 minute chart:
try for the fast: (will be very wiggly, note)
LongPeriod 25.0
ShortPeriod 8.0
ExtraTimeForward 1.0
and for the slow:
LongPeriod 500.0
ShortPeriod 50.0 to 200.0
ExtraTimeForward 0.0
But often a regular MA for the slow can work as well or better, it appears from visual inspection.
Enjoy.
In chaos there is order, and in that order there is chaos and order inside again.
Then, surrounding everything, pointy haired bosses. "
I may have done it incorrectly, feel free to revise

Hash Momentum IndicatorHash Momentum Indicator
Overview
The Hash Momentum Indicator provides real-time momentum-based trading signals with visual entry/exit markers and automatic risk management levels. This is the indicator version of the popular Hash Momentum Strategy, designed for traders who want signal alerts without backtesting functionality.
Perfect for: Live trading, automation via alerts, multi-indicator setups, and clean chart visualization.
What Makes This Indicator Special
1. Pure Momentum-Based Signals
Captures price acceleration in real-time - not lagging moving average crossovers. Enters when momentum exceeds a dynamic ATR-based threshold, catching moves as they begin accelerating.
2. Automatic Risk Management Visualization
Every signal automatically displays:
Entry level (white dashed line)
Stop loss level (red line)
Take profit target (green line)
Partial TP levels (dotted green lines)
3. Smart Trade Management
Trade Cooldown: Prevents overtrading by enforcing waiting period between signals
EMA Trend Filter: Only trades with the trend (optional)
Session Filters: Trade only during Tokyo/London/New York sessions (optional)
Weekend Toggle: Avoid low-liquidity weekend periods (optional)
4. Clean Visual Design
🟢 Tiny green dot = Long entry signal
🔴 Tiny red dot = Short entry signal
🔵 Blue X = Long exit
🟠 Orange X = Short exit
No cluttered labels or dashboard - just clean signals
5. Professional Alerts Ready
Set up TradingView alerts for:
Long signals
Short signals
Long exits
Short exits
How It Works
Step 1: Calculate Momentum
Momentum = Current Price - Price
Normalized by standard deviation for consistency
Must exceed ATR × Threshold to trigger
Step 2: Confirm Acceleration
Momentum must be increasing (positive momentum change)
Price must be moving in signal direction
Step 3: Apply Filters
EMA Filter: Long only above EMA, short only below EMA (if enabled)
Session Filter: Check if in allowed trading session (if enabled)
Weekend Filter: Block signals on Sat/Sun (if enabled)
Cooldown: Ensure minimum bars passed since last signal
Step 4: Generate Signal
All conditions met = Entry signal fires
Lines automatically drawn for entry, stop, and targets
Step 5: Exit Detection
Opposite momentum detected = Exit signal
Stop loss or take profit hit = Exit signal
Lines removed from chart
⚙️ Settings Guide
Core Strategy
Momentum Length (Default: 13)
Number of bars for momentum calculation. Higher values = stronger signals but fewer trades.
Aggressive: 10
Balanced: 13
Conservative: 18-24
Momentum Threshold (Default: 2.25)
ATR multiplier for signal generation. Higher values = only trade the biggest momentum moves.
Aggressive: 2.0
Balanced: 2.25
Conservative: 2.5-3.0
Risk:Reward Ratio (Default: 2.5)
Your target profit as a multiple of your risk. With 2.2% stop and 2.5 R:R, your target is 5.5% profit.
Conservative: 3.0+ (need 25% win rate to profit)
Balanced: 2.5 (need 29% win rate to profit)
Aggressive: 2.0 (need 33% win rate to profit)

QQQ TimingThis is a trend-following position trading strategy designed for the QQQ and the leveraged ETF QLD (ProShares Ultra QQQ). The primary goal is to capture multi-month holds for maximal profit.
Key Instruments & Performance
The strategy performs best with QLD, which yields far superior results compared to QQQ.
TQQQ (triple-leveraged) results in higher drawdowns and is not the optimal choice.
Important: The system is not intended for use with other indexes, individual stocks, or investments (like crypto or gold), as performance can vary widely.
Buy Signals
The strategy's signals are rooted in the S&P 500 Index (SPX), as testing showed it provides more reliable triggers than using QQQ itself.
Primary Buy Signal (Credit to IBD/Mike Webster): The SPX triggers a buy when its low closes above the 21-day Exponential Moving Average (EMA) for three consecutive days.
Refinement with Downtrend Lines: During corrective or bear periods, results and drawdowns can be significantly improved by incorporating downtrend lines. These lines connect lower highs. The strategy waits for the price to close above a drawn downtrend line before executing a buy. This refinement can modify the primary signal, either by allowing for an earlier entry or, in some cases, completely nullifying a false signal until the trend change proves itself.
Risk Management & Exit Strategy
Initial Buy Risk: A 3.7% stop loss is applied immediately upon the initial entry.
Initial Exit Rule: An exit is required if the QQQ's low drops below the 50-day Simple Moving Average (SMA).
Note: The 3.7% stop often provides protection when the initial buy occurs below the 50-day SMA. However, if QQQ is already trading above its 50-day SMA at the time of the SPX signal (indicating relative strength), historically, it has been better to use the 50-day SMA rule to give the position more room to run.
Trend Exit (Profit-Taking): To stay in a strong trend for the optimal amount of time, the long position is exited when a moving average crossover to the downside is triggered, based around the 107-day Simple Moving Average (SMA).

MAxRSI Signals [KedArc Quant]Description:
MAxRSI Indicator Marks LONG/SHORT signals from a Moving Average crossover and (optionally) confirms them with RSI. Includes repaint-safe confirmation, optional higher-timeframe (HTF) smoothing, bar coloring, and alert conditions.
Why combine MA + RSI
* The MA crossover is the primary trend signal (fast trend vs slow trend).
* RSI is a gate, not a second, separate signal. A crossover only becomes a trade signal if momentum agrees (e.g., RSI ≥ level for LONG, ≤ level for SHORT). This reduces weak crosses in ranging markets.
* The parts are integrated in one rule: *Crossover AND RSI condition (if enabled)* → plot signal/alert. No duplicated outputs or unrelated indicators.
How it works (logic)
* MA types: SMA / EMA / WMA / HMA (HMA is built via WMA of `len/2` and `len`, then WMA with `sqrt(len)`).
* Signals:
* LONG when *Fast MA crosses above Slow MA* and (if enabled) *RSI ≥ Long Min*.
* SHORT when *Fast MA crosses below Slow MA* and (if enabled) *RSI ≤ Short Max*.
* Repaint-safe (optional): confirms crosses on closed bars to avoid intrabar repaint.
* HTF (optional): computes MA/RSI on a higher timeframe to smooth noise on lower charts.
* Alerts: crossover alerts + state-flip (bull↔bear) alerts.
How to use (step-by-step)
1. Add to chart. Set MA Type, Fast and Slow (keep Fast < Slow).
2. Turn Use RSI Filter ON for confirmation (default: RSI 14 with 50/50 levels).
3. (Optional) Turn Repaint-Safe ON for close-confirmed signals.
4. (Optional) Turn HTF ON (e.g., 60 = 1h) for smoother signals on low TFs.
5. Enable alerts: pick “MAxRSI Long/Short” or “Bullish/Bearish State”.
Timeframe guidance
* Intraday (1–15m): EMA 9–20 fast vs EMA 50 slow, RSI filter at 50/50.
* Swing (1h–D): EMA 20 fast vs EMA 200 slow, RSI 50/50 (55/45 for stricter).
What makes it original
* Repaint-safe cross confirmation (previous-bar check) for reliable signals/alerts.
* HTF gating (doesn’t compute both branches) for speed and clarity.
* Warning-free MA helper (precomputes SMA/EMA/WMA/HMA each bar), HMA built from built-ins only.
* State-flip alerts and optional RSI overlay on price pane.
Built-ins used
`ta.sma`, `ta.ema`, `ta.wma`, (HMA built from these), `ta.rsi`, `ta.crossover`, `ta.crossunder`, `request.security`, `plot`, `plotshape`, `barcolor`, `alertcondition`, `input.*`, `math.*`.
Note: Indicator only (no orders). Test settings per symbol. Not financial advice.
⚠️ Disclaimer
This script is provided for educational purposes only.
Past performance does not guarantee future results.
Trading involves risk, and users should exercise caution and use proper risk management when applying this strategy.

Strategy Chameleon [theUltimator5]Have you ever looked at an indicator and wondered to yourself "Is this indicator actually profitable?" Well now you can test it out for yourself with the Strategy Chameleon!
Strategy Chameleon is a versatile, signal-agnostic trading strategy designed to adapt to any external indicator or trading system. Like a chameleon changes colors to match its environment, this strategy adapts to match any buy/sell signals you provide, making it the ultimate backtesting and automation tool for traders who want to test multiple strategies without rewriting code.
🎯 Key Features
1) Connects ANY external indicator's buy/sell signals
Works with RSI, MACD, moving averages, custom indicators, or any Pine Script output
Simply connect your indicator's signal output to the strategy inputs
2) Multiple Stop Loss Types:
Percentage-based stops
ATR (Average True Range) dynamic stops
Fixed point stops
3) Advanced Trailing Stop System:
Percentage trailing
ATR-based trailing
Fixed point trailing
4) Flexible Take Profit Options:
Risk:Reward ratio targeting
Percentage-based profits
ATR-based profits
Fixed point profits
5) Trading Direction Control
Long Only - Bull market strategies
Short Only - Bear market strategies
Both - Full market strategies
6) Time-Based Filtering
Optional trading session restrictions
Customize active trading hours
Perfect for day trading strategies
📈 How It Works
Signal Detection: The strategy monitors your connected buy/sell signals
Entry Logic: Executes trades when signals trigger during valid time periods
Risk Management: Automatically applies your chosen stop loss and take profit levels
Trailing System: Dynamically adjusts stops to lock in profits
Performance Tracking: Real-time statistics table showing win rate and performance
⚙️ Setup Instructions
0) Add indicator you want to test, then add the Strategy to your chart
Connect Your Signals:
imgur.com
Go to strategy settings → Signal Sources
1) Set "Buy Signal Source" to your indicator's buy output
2) Set "Sell Signal Source" to your indicator's sell output
3) Choose table position - This simply changes the table location on the screen
4) Set trading direction preference - Buy only? Sell only? Both directions?
imgur.com
5) Set your preferred stop loss type and level
You can set the stop loss to be either percentage based or ATR and fully configurable.
6) Enable trailing stops if desired
imgur.com
7) Configure take profit settings
8) Toggle time filter to only consider specific time windows or trading sessions.
🚀 Use Cases
Test various indicators to determine feasibility and/or profitability.
Compare different signal sources quickly
Validate trading ideas with consistent risk management
Portfolio Management
Apply uniform risk management across different strategies
Standardize stop loss and take profit rules
Monitor performance consistently
Automation Ready
Built-in alert conditions for automated trading
Compatible with trading bots and webhooks
Easy integration with external systems
⚠️ Important Notes
This strategy requires external signals to function
Default settings use 10% of equity per trade
Pyramiding is disabled (one position at a time)
Strategy calculates on bar close, not every tick
🔗 Integration Examples
Works perfectly with:
RSI strategies (connect RSI > 70 for sells, RSI < 30 for buys)
Moving average crossovers
MACD signal line crosses
Bollinger Band strategies
Custom oscillators and indicators
Multi-timeframe strategies
📋 Default Settings
Position Size: 10% of equity
Stop Loss: 2% percentage-based
Trailing Stop: 1.5% percentage-based (enabled)
Take Profit: Disabled (optional)
Trade Direction: Both long and short
Time Filter: Disabled

Long-Leg Doji Breakout StrategyThe Long-Leg Doji Breakout Strategy is a sophisticated technical analysis approach that capitalizes on market psychology and price action patterns.
Core Concept: The strategy identifies Long-Leg Doji candlestick patterns, which represent periods of extreme market indecision where buyers and sellers are in equilibrium. These patterns often precede significant price movements as the market resolves this indecision.
Pattern Recognition: The algorithm uses strict mathematical criteria to identify authentic Long-Leg Doji patterns. It requires the candle body to be extremely small (≤0.1% of the total range) while having long wicks on both sides (at least 2x the body size). An ATR filter ensures the pattern is significant relative to recent volatility.
Trading Logic: Once a Long-Leg Doji is identified, the strategy enters a "waiting mode," monitoring for a breakout above the doji's high (long signal) or below its low (short signal). This confirmation approach reduces false signals by ensuring the market has chosen a direction.
Risk Management: The strategy allocates 10% of equity per trade and uses a simple moving average crossover for exits. Visual indicators help traders understand the pattern identification and trade execution process.
Psychological Foundation: The strategy exploits the natural market cycle where uncertainty (represented by the doji) gives way to conviction (the breakout), creating high-probability trading opportunities.
The strength of this approach lies in its ability to identify moments when market sentiment shifts from confusion to clarity, providing traders with well-defined entry and exit points while maintaining proper risk management protocols.
How It Works
The strategy operates on a simple yet powerful principle: identify periods of market indecision, then trade the subsequent breakout when the market chooses direction.
Step 1: Pattern Detection
The algorithm scans for Long-Leg Doji candles, which have three key characteristics:
Tiny body (open and close prices nearly equal)
Long upper wick (significant rejection of higher prices)
Long lower wick (significant rejection of lower prices)
Step 2: Confirmation Wait
Once a doji is detected, the strategy doesn't immediately trade. Instead, it marks the high and low of that candle and waits for a definitive breakout.
Step 3: Trade Execution
Long Entry: When price closes above the doji's high
Short Entry: When price closes below the doji's low
Step 4: Exit Strategy
Positions are closed when price crosses back through a 20-period moving average, indicating potential trend reversal.
Market Psychology Behind It
A Long-Leg Doji represents a battlefield between bulls and bears that ends in a stalemate. The long wicks show that both sides tried to push price in their favor but failed. This creates a coiled spring effect - when one side finally gains control, the move can be explosive as trapped traders rush to exit and momentum traders jump aboard.
Key Parameters
Doji Body Threshold (0.1%): Ensures the body is truly small relative to the candle's range
Wick Ratio (2.0): Both wicks must be at least twice the body size
ATR Filter: Uses Average True Range to ensure the pattern is significant in current market conditions
Position Size: 10% of equity per trade for balanced risk management
Pros:
High Probability Setups: Doji patterns at key levels often lead to significant moves as they represent genuine shifts in market sentiment.
Clear Rules: Objective criteria for entry and exit eliminate emotional decision-making and provide consistent execution.
Risk Management: Built-in position sizing and exit rules help protect capital during losing trades.
Market Neutral: Works equally well for long and short positions, adapting to market direction rather than fighting it.
Visual Confirmation: The strategy provides clear visual cues, making it easy to understand when patterns are forming and trades are triggered.
Cons:
False Breakouts: In choppy or ranging markets, price may break the doji levels only to quickly reverse, creating whipsaws.
Patience Required: Traders must wait for both pattern formation and breakout confirmation, which can test discipline during active market periods.
Simple Exit Logic: The moving average exit may be too simplistic, potentially cutting profits short during strong trends or holding losers too long during reversals.
Volatility Dependent: The strategy relies on sufficient volatility to create meaningful doji patterns - it may underperform in extremely quiet markets.
Lagging Entries: Waiting for breakout confirmation means missing the very beginning of moves, reducing potential profit margins.
Best Market Conditions
The strategy performs optimally during periods of moderate volatility when markets are making genuine directional decisions rather than just random noise. It works particularly well around key support/resistance levels where the market's indecision is most meaningful.
Optimization Considerations
Consider combining with additional confluence factors like volume analysis, support/resistance levels, or other technical indicators to improve signal quality. The exit strategy could also be enhanced with trailing stops or multiple profit targets to better capture extended moves while protecting gains.
Best for Index option,
Enjoy !!

EMA Pullback Speed Strategy 📌 **Overview**
The **EMA Pullback Speed Strategy** is a trend-following approach that combines **price momentum** and **Exponential Moving Averages (EMA)**.
It aims to identify high-probability entry points during brief pullbacks within ongoing uptrends or downtrends.
The strategy evaluates **speed of price movement**, **relative position to dynamic EMA**, and **candlestick patterns** to determine ideal timing for entries.
One of the key concepts is checking whether the price has **“not pulled back too much”**, helping focus only on situations where the trend is likely to continue.
⚠️ This strategy is designed for educational and research purposes only. It does not guarantee future profits.
🧭 **Purpose**
This strategy addresses the common issue of **"jumping in too late during trends and taking unnecessary losses."**
By waiting for a healthy pullback and confirming signs of **trend resumption**, traders can enter with greater confidence and reduce false entries.
🎯 **Strategy Objectives**
* Enter in the direction of the prevailing trend to increase win rate
* Filter out false signals using pullback depth, speed, and candlestick confirmations
* Predefine Take-Profit (TP) and Stop-Loss (SL) levels for safer, rule-based trading
✨ **Key Features**
* **Dynamic EMA**: Reacts faster when price moves quickly, slower when market is calm – adapting to current momentum
* **Pullback Filter**: Avoids trades when price pulls back too far (e.g., more than 5%), indicating a trend may be weakening
* **Speed Check**: Measures how strongly the price returns to the trend using candlestick body speed (open-to-close range in ticks)
📊 **Trading Rules**
**■ Long Entry Conditions:**
* Current price is above the dynamic EMA (indicating uptrend)
* Price has pulled back toward the EMA (a "buy the dip" situation)
* Pullback depth is within the threshold (not excessive)
* Candlesticks show consecutive bullish closes and break the previous high
* Price speed is strong (positive movement with momentum)
**■ Short Entry Conditions:**
* Current price is below the dynamic EMA (indicating downtrend)
* Price has pulled back up toward the EMA (a "sell the rally" setup)
* Pullback is within range (not too deep)
* Candlesticks show consecutive bearish closes and break the previous low
* Price speed is negative (downward momentum confirmed)
**■ Exit Conditions (TP/SL):**
* **Take-Profit (TP):** Fixed 1.5% target above/below entry price
* **Stop-Loss (SL):** Based on recent price volatility, calculated using ATR × 4
💰 **Risk Management Parameters**
* Symbol & Timeframe: BTCUSD on 1-hour chart (H1)
* Test Capital: \$3000 (simulated account)
* Commission: 0.02%
* Slippage: 2 ticks (minimal execution lag)
* Max risk per trade: 5% of account balance
* Backtest Period: Aug 30, 2023 – May 9, 2025
* Profit Factor (PF): 1.965 (Net profit ÷ Net loss, including spreads & fees)
⚙️ **Trading Parameters & Indicator Settings**
* Maximum EMA Length: 50
* Accelerator Multiplier: 3.0
* Pullback Threshold: 5.0%
* ATR Period: 14
* ATR Multiplier (SL distance): 4.0
* Fixed TP: 1.5%
* Short-term EMA: 21
* Long-term EMA: 50
* Long Speed Threshold: ≥ 1000.0 (ticks)
* Short Speed Threshold: ≤ -1000.0 (ticks)
⚠️Adjustments are based on BTCUSD.
⚠️Forex and other currency pairs require separate adjustments.
🔧 **Strategy Improvements & Uniqueness**
Unlike basic moving average crossovers or RSI triggers, this strategy emphasizes **"momentum-supported pullbacks"**.
By combining dynamic EMA, speed checks, and candlestick signals, it captures trades **as if surfing the wave of a trend.**
Its built-in filters help **avoid overextended pullbacks**, which often signal the trend is ending – making it more robust than traditional trend-following systems.
✅ **Summary**
The **EMA Pullback Speed Strategy** is easy to understand, rule-based, and highly reproducible – ideal for both beginners and intermediate traders.
Because it shows **clear visual entry/exit points** on the chart, it’s also a great tool for practicing discretionary trading decisions.
⚠️ Past performance is not a guarantee of future results.
Always respect your Stop-Loss levels and manage your position size according to your risk tolerance.
