MTF IQ IFM Moving AverageMTF ready adaptive MA using Ehler's IQ IFM ( In Phase - Quadrature Instantaneous Frequency Measurement ).
Ehler's formula is a method of quantitatively measuring the length of a market cycle. In this case it is used to calculate the "optimal" adaptive EMA.
Theoretically the length generated by Ehler's formula could be used in many indicators and it's been placed within it's own function so you should be able to simply copy/paste it. HOWEVER pine will not accept series variables for the length input used in built-in functions. You will have to manually code (or find) a version of your indicator that doesn't use the pine built in.
Options :
type : optionally add volume weighting
range : historical range used in IQ IFM
cycle length mult : method to create faster/slower MAs. eg 0.5 is half the length of a cycle and a faster EMA ie EMA10 vs EMA20
low sat fix : some cryptocurrencies with low satoshi values cause an issue with the calculation, if you get no/nonsensical lines, enable this. Shouldn't affect other instruments, but can be disabled just in case.
MTF options: run the calculation on an alternative timeframe
--------------------------------------
If you find it useful please consider a tip/donation :
BTC - 3BMEXEDyWJ58eXUEALYPadbn1wwWKmf6sA
Cari dalam skrip untuk "mtf"


MTF GMMA with Display Timeframe ControlJapanese below / 日本語説明は下記
Multi time frame GMMA indicator that shows GMMA of the current timeframe and GMMA of upper time frame(MTF GMMA).
One of the GMMA’s advantages is to visualize trends showing multiple MAs of short term and long term. By providing both of MTF GMMA and the current timeframe’s GMMA, traders can grasp trends having upper timeframe’s perspectives.
How is it different from other MTF indicators?
Problems with other MTF GMMA indicators are;
-If you set higher timeframe GMMA , it will also be shown on further higher timeframes.
i.e. If you set 4hour GMMA on 1 hour or lower time frame charts, it will also appear on daily and weekly chart, which is not necessary.
To tackle these problems, this indicator has incorporated “display timeframe control” functions as follows.
-To show MTF GMMA on timeframe lower than the upper timeframe you set as MTF timeframe.
For example, if you select daily timeframe for MTF GMMA , the GMMA will be shown only on 4 hour or lower timeframes(1H, 30M, 15M, 5M, 1M).
Functions:
-One upper timeframe can be selected from monthly, weekly, daily, 4hour, 1hour, 30mins, 15mins and 5mins for MTF GMMA
-MA type can be selected from SMA/EMA
-MA period can be configured but common for current timeframe GMMA and MTF GMMA
-Both of current timeframe/MTF GMMA can be disabled when not necessary by ticking checkbox
How to use?
A suggested use of GMMA with MTF GMMA is trend following while price is above the current timeframe GMMA and MTF GMMA(buy the dips and sell the rips) and aim trend reversal when the current timeframe GMMA crosses MTF GMMA
Sample chart
1 hour chart with 1 hour GMMA(blue and yellow) and 4 hour GMMA(MTF GMMA, green)
——————————————————————————————
上位足のGMMA(MTF GMMA)と現在タイムフレームのGMMAの2つのGMMAを表示することのできるインジケーターです。
GMMAの一つのメリットは短期・長期のMAを複数表示することでトレンドを容易に可視化できることですが、上位足のGMMAを合わせて表示することで上位足の目線を保ったままトレンドを把握することができます。
他のマルチタイムフレームGMMAインジケーターとの違い
他のマルチタイムフレームGMMAのインジケーターでは、上位足のGMMAを表示すると、さらにその上位足でもそのGMMAが表示され、チャートが見にくくなるという問題に直面します。
例: 4時間足のGMMAを下位足で表示可能な様に設定すると、日足や週足でも表示されチャートが見にくくなる。
この問題に対して、このインジケーターでは、
・上位足のGMMAを表示する時間軸を制御することで上位足で不必要な情報を表示させない。
という機能を加えることでこの問題を解決しています。
具体的には、マルチタイムフレーム用に選択した上位足のタイムフレームより小さいタイムフレームでのみ上位足のGMMAが表示されるようになっています。
例えば、上位足として日足を選択した場合、日足のGMMAは4時間足、1時間足、30分足、15分足、5分足、1分足にのみ表示されます。
機能
-上位足のタイムフレートとして、月足、週足、日足、4時間足、1時間足、30分足、15分足、5分足を選択可能
-MAタイプはSMA/EMAから選択可能
-MAの期間は設定可能ですが、現在タイムフレームGMMAとMTF GMMAで共通
-現在タイムフレームGMMAとMTF GMMAは不要な時はチェックボックスで非表示可能
使い方
使い方の一つの例として、価格が現在タイムフレームGMMAとMTF GMMAの上にある間はトレンドフォロー(押し目買い/戻り売り)を、現在タイムフレームGMMAとMTF GMMAがクロスした時はトレンド転換を狙うということが挙げられます。
サンプルチャート
1時間足に4時間足のGMMA表示(青と黄色: 1HのGMMA, 緑: 4HのGMMA)

MTF Bull Power Bear Power(Elder Ray Indicator)■Overview
This indicator enables to select an upper timeframe’s Bull Power Bear Power(aka Elder Ray Indicator) (MTF) and the one of chart’s timeframe simultaneously by which users can always analyze looking at upper timeframe situation.
Also, it displays signals when bull power bear power cross zero line with an ability to set alerts.
■Formula
The indicator calculates bull power and bear power following the original Elder Ray indicator as follows.
1.Bull Power : High - EMA(13)
2.Bear Power : Low - EMA(13)
3.Bull Power Bear Power : 1 + 2
※MTF is same as above
※MA period can be changed
※High/Low is highs/lows of a chart timeframe that users are opening unless you show MTF.
See the link below for the details.
www.investopedia.com
To enable MTF, users can select “Auto” mode and “Manual” mode. When “Auto” selected, upper timeframes are determined based on the chart’s timeframes that users are currently opening as follows.
Chart timeframes -> upper timeframes
Weekly -> Monthly
Daily -> Weekly
4hour -> Daily
1hour -> 4hour
30min -> 4hour
15min -> 1hour
5min -> 1hour
1min -> 15min
■Signals
When bull power bear power cross zero line, signals can be displayed. These can be used to analyze reversal of buying/selling power.
Alerts can be set with the same condition.
——————————————
エルダー·レイ·インジケーターとしても知られるブルパワー·ベアパワーのMTFバージョンインジケーターです。
一つの上位足のブルパワー·ベアパワーとチャートのタイムフレームのブルパワー·ベアパワーの両方を同時に表示することができるため、常に上位足の状況を鑑みながら分析することができます。
また、それぞれのブルパワー·ベアパワーとゼロラインとの交差でシグナル表示、アラート設定が可能です。
■計算式
ブルパワー·ベアパワーの計算式は以下の通りです。
オリジナルのエルダー·レイ·インジケーターと同じくEMAと高値·安値を用いて計算しています。
1.ブルパワー: 高値 - EMA(13)
2.ベアパワー: 安値 - EMA(13)
3.ブルパワー·ベアパワー = 1 + 2
※MTFも上記に同じ
※MAの期間は変更可能
※高値·安値は現在開いているチャートの高値·安値です。(MTFは指定したタイムフレームの高値・安値)
ブルパワー·ベアパワーの詳細は以下のリンクを参照してください。
www.investopedia.com
MTFのブルパワー·ベアパワーを表示するにあたっては、”Auto”モードと”Manual”モードの二つから選択することができます。
“Auto”モード選択時は、現在開いているチャートのタイムフレームに基づき、上位足のタイムフレームが下記の通りに自動的に決定されます。
チャートタイムフレーム -> 上位足タイムフレーム
週足 -> 月足
日足 -> 週足
4時間足 -> 日足
1時間足 -> 4時間足
30分足 -> 4時間足
15分足 -> 1時間足
5分足 -> 1時間足
1分足 -> 15分足
■シグナル
ブルパワー·ベアパワーとゼロラインとの交差でシグナルを表示します。
売り買いの強弱反転ポイントの目安として使ってください。
同じ条件でアラート設定も可能です。

MTF CandleLevelsIn the spirit of freedom from oppression on this day of July 4th, 2021 in the United States, I hereby release this flagship indicator "MTF CandleLevels" into the wild for any subscribing TV member on the planet to utilize. It's now one my few great gifts to the souls of humankind within the realm of trading on TV. TradingView continues to bless Pine Script by releasing supplemental upgrades, enough for me to develop this indicator beyond it's experimental phase to full potential, as I had always wished to design it from theory. Educationally while using it, you will witness how OHLC/HA candles are actually formed for charts. I like to think of it as a candle formation microscope anyone can learn from.
It is intended for any style of trading or skill level from newcomer to advanced. There are no requirements/prerequisites for you use it. Which means you don't have to wear a mouth muzzle, get multiple doses of the life endangering FrankenJabs, subserviently bow down to authoritarian demands of obedience, or learn the ancient mystical art of deception "Fau Chi" in order to employ it's inherent power. A little sprinkle of satire helps with a dry technical read :). You have the absolute freedom to utilize it any way you see fit! That's right, it's even your choice whether you use it or not. The unshackled empowerment of choice always equates to FREEDOM. I can't program these precious gems without it...
One thing you will have noticed is it's specifically published on a Heikin Ashi(HA) chart, while having immunity to the Heikin Ashi candle charts unique open/close behavior. This has been believed to be an impossibility until now. For members who don't know, HA candle charts have a different `open` and `close` from the `open` and `close` of the other ordinary OHLC candle charts. Regardless of "CandleLevels Mode" chosen in Settings, the indicator will display identical on either bar chart type, excluding Renko, Line Break, Kagi, Point&Figure, and Range candle charts of course. It's abilities supersede the simpler "Multi-Time Period Charts" built-in TV indicator with a completely different architecture. For those of you extremely curious about how I accomplished this indicators level of code complexity, it was immensely difficult taking over a year of effort for this one functional unit, and I will leave it at that...
This novel MTF technology displays OHLC/HA support and resistance levels that mimic the functionality of larger duration candle formations in real time. Basically explained, while charting on a shorter duration timeframe candle chart, you can see open, high, low, and close levels fluctuate in the larger duration timeframe. This reduces the need to jump back and forth to view price action on different chart sampling intervals. You may even use multiple sets of CandleLevels indicators over a wide variety of chosen timeframe options, along with everything else in between.
The CandleLevels behavior is chosen within the indicator "Settings" using a selection mode of either the standard OHLC candlestick formations or Heikin Ashi candlestick formations. Each mode has a multitude of uses depending on the users trading style or timeframe.
Visbility of CandleLevels will ONLY occur when it is set to a larger duration timeframe interval than the current chart sampling rate. For example, you may be using the 5 minute interval sampling rate on the chart, yet you can easily see the open, high, low, close ranges with a chosen 120 minute timeframe setting. The multiple time frame(MTF) settings are highly adjustable having intervals of seconds, minutes, days, a multiple of the chart interval, or the common input(type=input.resolution) function provided by Pine.
CandleLevels come with multiple color schemes to reduce color interference with other indicators in the overlay pane, including the intended use of multiple sets of CandleLevels. My basic color scheme selections can be overridden to choose any imaginable color you desire for your visual acuity. Also, there are additional controls available to fine tune a visually pleasing appearance depending on your preferences and viewable area. One last new hidden fine tune capability, not only for this indicator but all TV indicators, is the agility to use up/down arrow keys on the keyboard when an indicator setting is in focus after mouse selection. For example, when choosing line thickness, you can modify values/options by key stroke. Try it out, I'm sure you will find this useful for any indictor for eternity.
NOTICE: There is only 500 line drawings available, in total to display, at this current release. This equates to 83 sets of CandleLevels maximum.
Features List Includes:
Candle type selection
MTF controls for seconds, minutes, days, multiple-of, and TV input
Multiple color schemes with color overrides
Color opacity selector
Line thickness control
Enable/disable capable MTF interval display with positioning
When available time provides itself, I will consider your inquiries, thoughts, and concepts presented below in the comments section, should you have any questions or comments regarding this indicator. When my indicators achieve more prevalent use by TV members, I may implement more ideas when they present themselves as worthy additions. Have a profitable future everyone!
RISK DISCLAIMER:
My scripts, indicators, and studies are specifically intended for informational and educational use only. These use historical data points to perform calculations to derive real-time calculations. They do not infer, indicate, or guarantee future results or performance.
By utilizing this script/indicator/study or any portion of it, you agree to accept 100% responsibly and liability for your investment or financial decisions, and I will not be held liable for your subjective analytic interpretations incurring sustained monetary losses. The opinions and information visual or otherwise provided by this script/indicator is not investment advice, nor does it constitute recommendation.

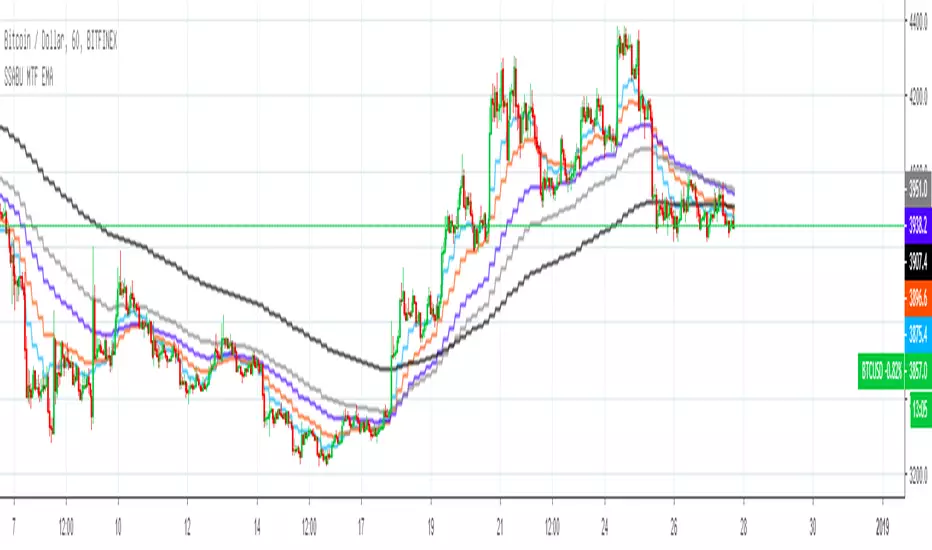
SSABU MTF EMA
✅ MTF EMA (Multi-Time Frame Exponential of Moving Average Line) Indicator.
This indicator is an auxiliary indicator for viewing the exponential moving average of the high frame's span in the low frame's span.
If you set the indicator instead of entering the time directly, you can set 1/3/5/13/30/45 minutes 1/2/3 / hour per day from EMA1 MTF Set (Minute).
The default setting is 4H and the number of horizontal lines is 5.
The screenshot above shows a 4 hour horizon on a 1 hour bar chart.
✅ MTF EMA (멀티 타임 프레임 지수 이동 평균선) 지표입니다.
본 지표는 낮은 프레임의 분봉에서 높은 프레임의 분봉의 지수 이동 평균선을 볼 수 있는 보조지표 입니다.
직접 시간을 입력 하는 건 아니고 지표를 설치하시면 EMA1 MTF Set(Minute)에서 1/3/5/13/30/45분 1/2/3/시간 1일 1주로 설정이 가능합니다.
기본설정은 4H으로 되어있고 이평선갯수는 5개로 구성되어 있습니다.
위의 스크린샷은 1시간봉의 차트에서 4시간의 이평선을 적용한 모습입니다.
✅ 매매에 도움되는 다른 보조지표
Basel ver 2.21
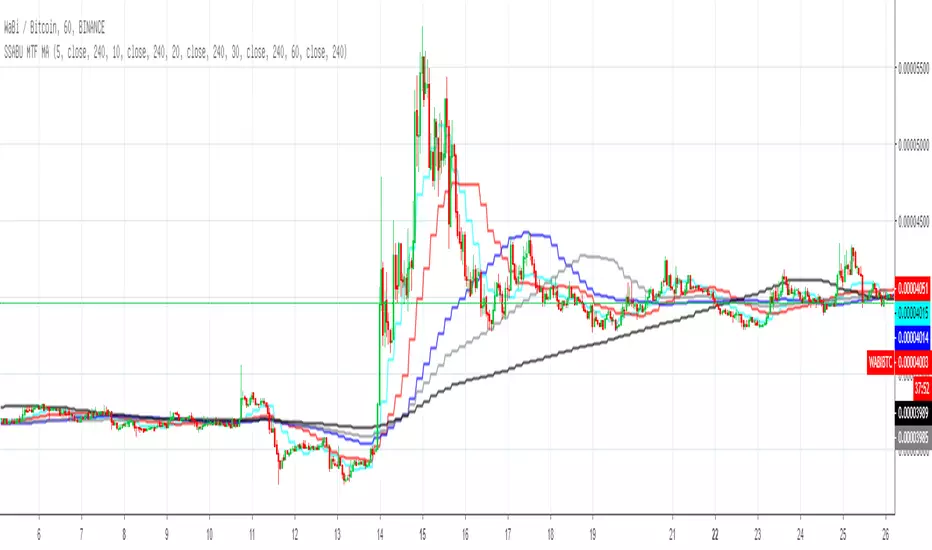
SSABU MTF MA
✅ MTF MA (Multi-Time Frame Moving Average ) Indicator.
This indicator is an auxiliary indicator for viewing the moving average line of the high frame's span in the low frame's span.
If you set the indicator instead of entering the time directly, you can set 1/3/5/13/30/45 minutes 1/2/3 / hour for 1 week from MA1 MTF Set (Minute).
The default setting is 4H and the number of horizontal lines is 5.
The screenshot above shows a 4 hour horizon on a 1 hour bar chart.
✅ MTF MA (멀티 타임 프레임 이평선) 지표입니다.
본 지표는 낮은 프레임의 분봉에서 높은 프레임의 분봉의 이동평균선을 볼 수 있는 보조지표 입니다.
직접 시간을 입력 하는 건 아니고 지표를 설치하시면 MA1 MTF Set(Minute)에서 1/3/5/13/30/45분 1/2/3/시간 1일 1주로 설정이 가능합니다.
기본설정은 4H으로 되어있고 이평선갯수는 5개로 구성되어 있습니다.
위의 스크린샷은 1시간봉의 차트에서 4시간의 이평선을 적용한 모습입니다.
✅ Other indicators to help you trade
✅ 매매에 도움되는 다른 보조지표
Basel major swing 2.2
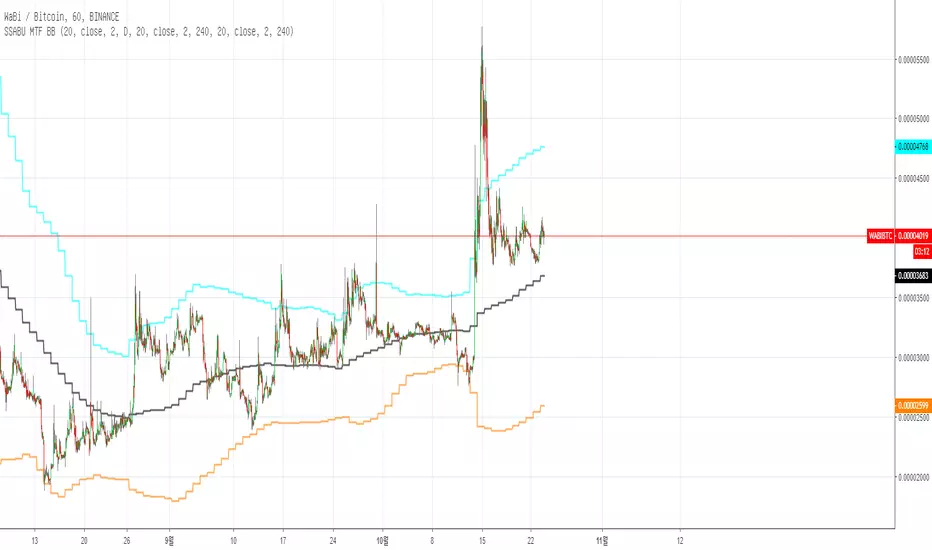
SSABU MTF BB
✅ MTF BB (Multi-Time Frame Bollinger Band) Indicator.
This indicator is a supplementary indicator for viewing the BB value of the high frame splitting in the low frame splitting.
If you set the indicator instead of entering the time directly, you can set 1/3/5/13/30/45 minutes 1/2/3 / hour for 1 week from BB1 MTF Set (Minute).
The default setting is 4H and the number of BB is 3.
The above screenshot shows a BB with a one-hour stick in the chart of 1 hour's bar.
✅ MTF BB (멀티 타임 프레임 볼린저 밴드) 지표입니다.
본 지표는 낮은 프레임의 분봉에서 높은 프레임의 분봉의 BB수치를 볼 수 있는 보조지표 입니다.
직접 시간을 입력 하는 건 아니고 지표를 설치하시면 BB1 MTF Set(Minute)에서 1/3/5/13/30/45분 1/2/3/시간 1일 1주로 설정이 가능합니다.
기본설정은 4H으로 되어있고 BB갯수는 3개로 구성되어 있습니다.
위의 스크린샷은 1시간봉의 차트에서 일봉의 BB를 적용한 모습입니다.
✅ Other indicators to help you trade
✅ 매매에 도움되는 다른 보조지표
Basel major swing ver 2.2
MTF SMA on specific timeframe(5M-4H)Japanese below. 日本語の説明は下記
This is multi time frame simple moving average that is shown only on the specific timeframe; 5M, 15M, 30M, 1H, 4H.
Problem of conventional MTF moving average is that MTF MA is sometimes annoying especially when you look at upper timeframe such as daily chart and/or weekly chart.
e.g. You set 20 MA of 4 hour chart into 1 hour chart, however, when you look at daily chart, daily chart also shows 20MA of 4 hour chart which is unnecessary.
This is why I have developed this MTF SMA indicator shown only on the timeframe from 5M to 4 hour.
With this indicator, even if you set MA of upper timeframe(such as 4 hour) into Lower timeframe, that MA will not be shown on above daily chart.
You can customize adding or removing below code;
timeframe.period == “X”? security(syminfo.tickerid, res, sma(src, ma_len))
X is the timeframe that you would add/remove from the indicator.
——————————————————————————————
特定の時間軸にのみ表示されるマルチタイムフレーム移動平均線のインジケーターです。
従来のマルチタイムフレーム移動平均線の問題点は、上位足に切り替えた時にもマルチタイムフレーム移動平均線の設定が表示され、チャートが見にくくなる点でした。
例: 4時間足の20MAをマルチタイムフレーム移動平均線としてセットしたとします。この場合、1時間足などの下位足で4時間足の20MAが表示されることになりますが、同時に日足や週足といった上位足チャートを見る時にも、この4時間足の20MAが表示されてしまいます。
このインジケーターでは、従来のマルチタイムフレーム移動平均線と同様に、設定元となる上位足の時間軸(4時間、日足など)を選択し、期間とソースを設定することができる一方で、表示されるのは5分足、15分足、30分足,1時間足、4時間足のみとなります。
スクリプトのMAの取得部分に以下コードを追加することで、必要な時間軸を追加・削除することが可能です。
timeframe.period == “X”? security(syminfo.tickerid, res, sma(src, ma_len))
Xは表示したい時間軸です。4時間足チャートからこのインジケーターを削除したい場合は
timeframe.period == “240”? security(syminfo.tickerid, res, sma(src, ma_len))
を削除してください。

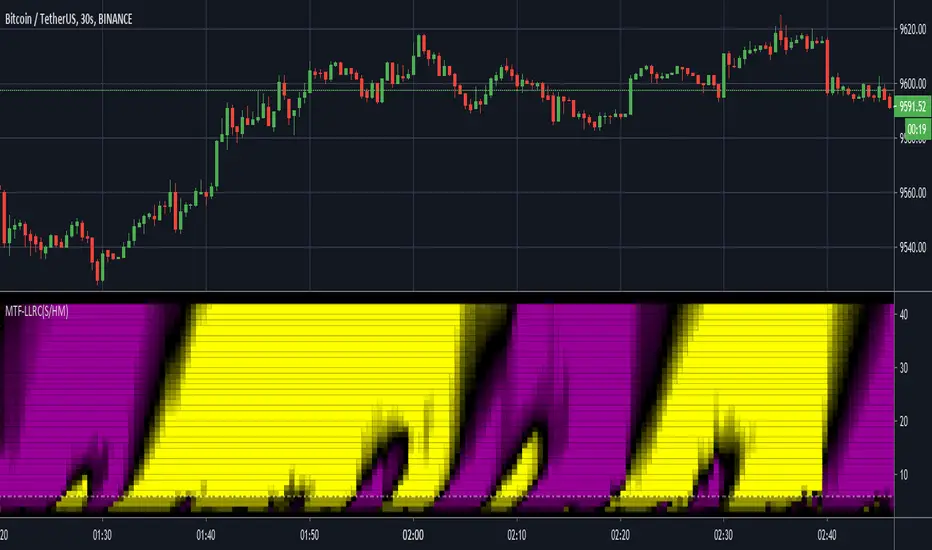
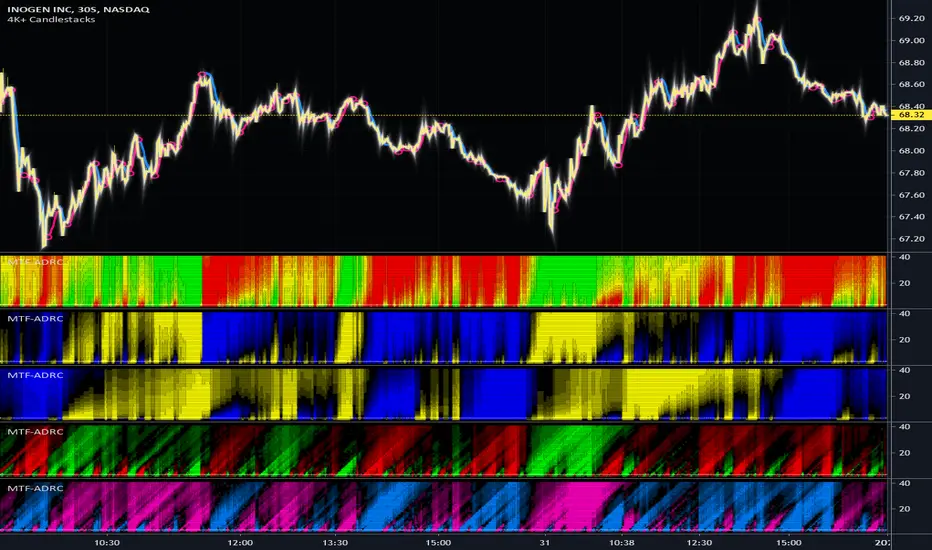
MTF Lag-Less RasterChart (Spectrogram/HeatMap)I present yet another state-of-the-art "MTF Lag-Less RasterChart" employing PSv4.0. Simply describing how this indicator works, the bottom of the indicator pane is most reactive and is highly effective at identifying reversal points quickly once they occur, while the upper portion of the indicator commonly shows enduring trends. This may be my finest multi-timeframe heatmap indicator that I have created so far, complete with multiple stunning gradient color schemes. I'm unsure if I will be able to pack any more tech into these RasterCharts. This may exclude additional algorithms or polychromatics I may discover later on that are worthy of other RasterChart releases. One last thing, this is a companion indicator to my "Lag-Less Rainbow Ribbon" indicator, because the heavily modified base algorithms are nearly identical.
I once again would like to personally thank Dr . John Ehlers for inspiring me to ponder into the realm of heatmap technology and all it has to offer. Your mathemagical splendor is most appreciated! You're a divine inspiration to the algorithmic trading community and forever shall be.
The MTF capabilities include seconds, minutes, and days. If the time frame settings are shorter in time than the current sampling interval, a warning notification will be appropriately displayed. I included a horizontal rule to approximately gauge at what level you may wish to have before entering/exiting a trade upon identifying a trend change. This gizmo functions on all assets on time frames ranging from one second bars up to the "All" chart having monthly bars.
Lastly, I have included so many color scheming techniques that I couldn't demonstrate all of them above. This indicator has what I would term as enhanced "predator" vision. For those of you who have witnessed these movies, you may understand what I have built. This indicator additionally includes a color morphing control to perfectly adjust the gradients to your visual liking, on any time frame whether it be seconds or daily chart preferences. The use of this indicator is just like any of my other RasterCharts or heatmap indicators found on the internet, except it has the greatest versatility I have accomplished as of yet.
Features List Includes:
"Source" selection
MTF controls for seconds, minutes, and days
Adjustable horizontal rule to differentiate between more reactive aspects of turning point fluctuations in the lower portion of the chart (visible above)
Window aperture control
Adjustable heatmap brightness control
Visual color scheme techniques (a few of many are displayed above)
Color gradient morphing
Color inversion control
This is not a freely available indicator, FYI. To witness my Pine poetry in action, properly negotiated requests for unlimited access, per indicator, may ONLY be obtained by direct contact with me using TV's "Private Chats" or by "Message" hidden in my member name above. The comments section below is solely just for commenting and other remarks, ideas, compliments, etc... regarding only this indicator, not others. When available time provides itself, I will consider your inquiries, thoughts, and concepts presented below in the comments section, should you have any questions or comments regarding this indicator. When my indicators achieve more prevalent use by TV members, I may implement more ideas when they present themselves as worthy additions. As always, "Like" it if you simply just like it with a proper thumbs up, and also return to my scripts list occasionally for additional postings. Have a profitable future everyone!
MTF Accumulation/Distribution RasterChart (Spectrogram/HeatMap)As my first published indicator for year 2020, I present my revolutionary "MTF Accumulation/Distribution RasterChart" employing PSv4.0. This is probably a world's first all-in-one multi-timeframe, multi-algorithm heatmap indicator with multiple color schemes. I decided to release this multicator now, because it has been a year long journey for me to develop spectrogram technology with abilities John Ehlers didn't include with his original heatmaps. I would like to personally thank Dr. John Ehlers for inspiring me to ponder into the realm of heatmap technology and all it has to offer. Thank you! You're a divine inspiration to the algorithmic trading community and forever shall be.
Each of the algorithms use "volume" and "price" data in their calculations to provide a unique spectrogram for either algorithm chosen, hence the accumulation/distribution attributed to the title of this indicator. The MTF capabilities include seconds, minutes, and days. If the time frame settings are shorter in time than the current sampling interval, a warning will be appropriately displayed. Also, when volume data is not applicable to an asset, the indicator will become completely red. I included so many color scheming techniques I couldn't demonstrate all of them above. This indicator has what I would term as "predator" vision. For those of you who have seen these movies, you will understand what I have built.
The use of this indicator is just like any of my other RasterCharts or heatmap indicators found on the internet, except it has much more versatility. This indicator has so many uses, I really haven't discovered all of it's characteristics yet. Anyhow, this is one of my most beautiful indicators I have created so far, but I feel there is still more room for enhancements with a possibility of more sibling algorithms to incorporate later. Lastly, I couldn't have done this without the computing power/wizardry provided by ALL Tradingview staff. They deserve a HUGE and proper, THANK YOU!!! Happy New Year 2020 everyone...
Features List Includes:
MTF controls for seconds, minutes, and days
Multiple volume weighted algorithms to choose from
Gain control for algorithm #1
Adjustable horizontal rule to differentiate between more reactive aspects of turning point fluctuations in the lower portion of the chart (visible above)
Adjustable heatmap brightness control
Visual color scheme techniques (a few of many are displayed above)
Color inversion control
"NO VOLUME" detection (indicator becomes red)
This is not a freely available indicator, FYI. To witness my Pine poetry in action, properly negotiated requests for unlimited access, per indicator, may ONLY be obtained by direct contact with me using TV's "Private Chats" or by "Message" hidden in my member name above. The comments section below is solely just for commenting and other remarks, ideas, compliments, etc... regarding only this indicator, not others. When available time provides itself, I will consider your inquiries, thoughts, and concepts presented below in the comments section, should you have any questions or comments regarding this indicator. When my indicators achieve more prevalent use by TV members, I may implement more ideas when they present themselves as worthy additions. As always, "Like" it if you simply just like it with a proper thumbs up, and also return to my scripts list occasionally for additional postings. Have a profitable future everyone!
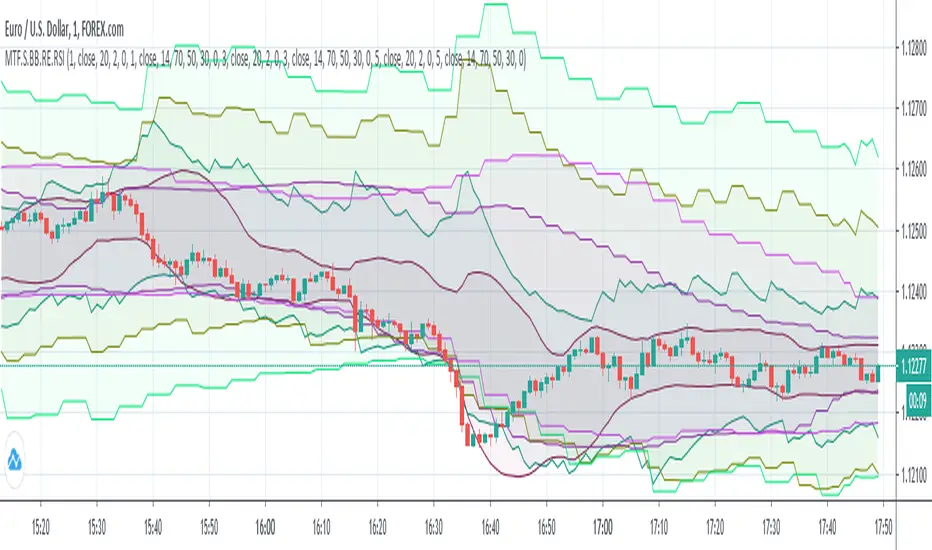
MTF Shifting BBs + Reverse Engineering RSIs Overlay on ChartAnother multi-timeframe indicator presents 3 MTF (each) Bollinger Bands and 3 MTF (each) Reverse Engineering RSI and of course with shifting (left/right) capability.
RERSI in a simple term is the RSI but on the main chart alongside with candles.
There are many adjustable options like:
- Show/Hide each BB
- Show/Hide each MA
- Non-integer BB deviation values
- Positive/Negative shifting values
- Show/Hide each RSI
- Show/Hide each RSI Mid Level
- Adjustable Overbought, Oversold and Mid Levels values
I wrote this after my first script MTFSBB, because it's very useful to have BBs and RSIs together on a chart.
Calculating RERSIs will take some time, so be patient with it and feel free to use it.
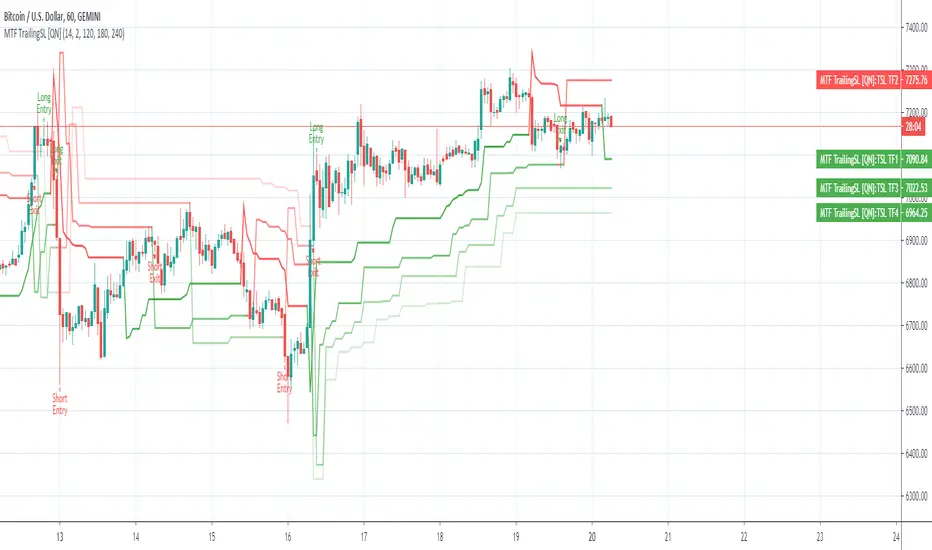
MTF Trailing SL Alerts [QuantNomad]These are alerts for my MTF Trailing SL Strategy.
Entry Long position if all 4 time-frames agree on the long signal.
Exit Long positions when at least 2 time-frames disagree on the long signals.
Entry to Short position if all 4 time-frames agree on Short signal.
Exit from Short positions when at least 2 time-frames disagree on Short signal.
Use "Once Per Bar Close" when creating alerts.
Link to the strategy:
MTF Enhanced Money Flow Index - Quong/SoudackThis is my "Enhanced Money Flow Index" indicator using Pine Script version 4.0. This was originally conceived by Gene Quong and Avrum Soudack. While the original was simplistically designed, I enhanced it by adding a multitude of features listed below.
Most noticeably is the multiple time frame (MTF) features in the indicator "Settings". The upper two displayed indicators are using 15 second and 4 minute time frames. This may be the second PSv4.0 script to accommodate seconds in MTF adequately, but don't quote me on that. I haven't spent hours extensively looking for them. Be forewarned, second-based time frames are currently for Premium subscribers only, until such time in the future when the prerogative of TV might change. I will be adding second-based time frames to my other indicators where I feel it is beneficial to the indicator.
One other noticeable feature of this script is the adjustable automated gain control mechanism providing better visibility than the plain original TV built-in seen on the very bottom. This enables the indicator to make more complete full swings between +/-1.0 with the available indicator space compared to the original for a slightly improved visual examination.
Note: This script has volume detection built-in. When no volume is available, the background color will be overwhelmingly red AND the indicator will cease to function.
Features List Includes:
I.P.O.C.S.(Initial Public Offering Clean Start) Technology
Enable/disable dark background for enhanced visibility
"Period" adjustment
"Gain Control" adjustment
"Line Width" adjustment
"Display Area" selection for visual variations displayed above
Ranges and thresholds are enable/disable capable
Upper threshold adjustment
Red/green secondary range that adjusts +/- from the upper/lower thresholds
Lower threshold adjustment
Adjustable centered medial zone
This is not a freely available indicator, FYI. To witness my Pine poetry in action, properly negotiated requests for unlimited access, per indicator, may ONLY be obtained by direct contact with me using TV's "Private Chats" or by "Message" hidden in my member name above. The comments section below is solely just for commenting and other remarks, ideas, compliments, etc... regarding only this indicator, not others. If you do have any questions or comments regarding this indicator, I will consider your inquiries, thoughts, and concepts presented below in the comments section, when time provides it. When my indicators achieve more prevalent use by TV members, I will implement more ideas when they present themselves as worthy additions. As always, "Like" it if you simply just like it with a proper thumbs up, and also return to my scripts list occasionally for additional postings. Have a profitable future everyone!

MTF Moving AvaragesHello traders! I feel inspired today! Except another MTF release later!!!!
MTF Moving Average
Shows either the price is on top or under a specific moving average on multiple time frames. It helps the user have a larger picture of what is happening in the market and what the major trend is.
GREEN = CLOSED OVER MA
RED = CLOSED UNDER MA
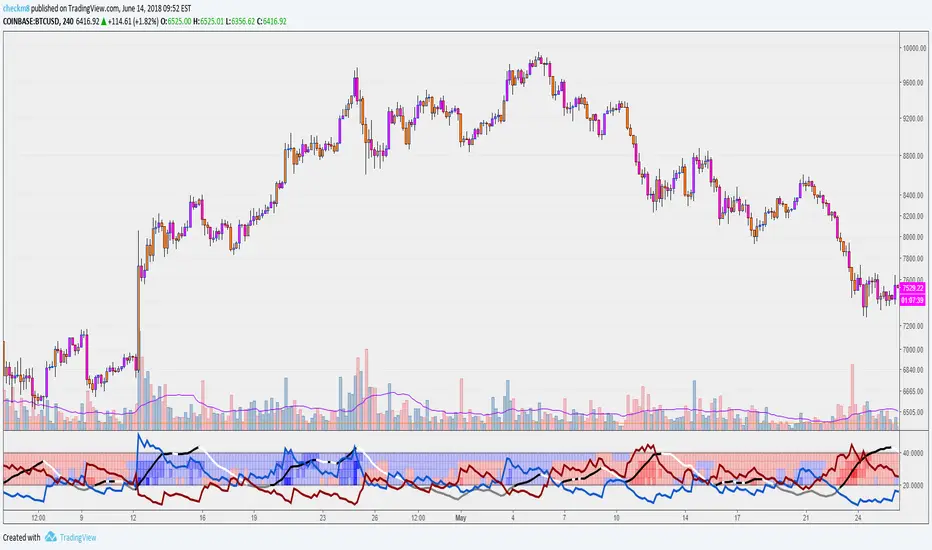
MTF ADX and DMI Grid with RSIHello and welcome to my latest revision of my ADX and DMI series.
This indicator features the Average Directional Index (ADX) and the Directional Moving Index (DMI), with a multi-timeframe (MTF) grid that shows you the dominant DMI on the select timeframes. There are four grid rows, allowing you to select four different timeframes to show in the study. In addition to this, the colors displayed in the grid will reflect RSI levels, when the RSIs on the select timeframes exceed 70 or 80, or fall below 30 or 20.
For example, if one of your select timeframes is 4h, the standard settings will display a blue block in the relative row of the grid if the +DMI is above the -DMI on the 4h timeframe. If the RSI exceeds 70, the shade of blue will become darker, and become even darker if the 4h RSI exceeds 80. This will apply for the inverse case, where if the -DMI is dominant, the grid will display a darker shade of red as the 4h RSI falls below 30 and 20.
The ADX is the line in the oscillator that changes between black, white, and gray. ADX will be black when it is rising, white when it is falling, and gray when it is below the key level value (default set to 20). When ADX is below 20, you can assume the dominant DMI is irrelevant as there is no real trend strength. You can change your set key value in the oscillator settings, as well as all the colors, and so on.
If you are not familiar with the ADX and DMI indicator, a useful guide can be found below:
1) An ADX reading below 20 signifies that there is no prevailing trend in play. This means that, regardless of DMI dominance, there is no real strength. This is a good measure for sideways price action.
2) If +DMI is above -DMI, this means that a bullish trend is in play, and vice versa (where a -DMI dominance shows a bearish trend in play). Make sure to pay attention to the value of ADX, as this will show the significance of DMI dominance.
3) The strongest possible position you can have is one where the DMIs have a crossover on an ADX that is perking or sloping upwards.
4) You should be exiting your positions at the peak of the ADX , shown by the color changes, as this is often the furthest extent of the dominant trend. Once the ADX tips, the trend weakens and is less likely to see continuation. NOTE: Divergences are possible, where the ADX may be falling, but the dominant trend sees continuation. This simply means that the dominant trend is weakening, but still going.
5) Speculating on DMI crossovers is dangerous, especially on larger timeframes. Be careful when doing so if you are not familiar with the calculations behind the DMIs and if you are not familiar with how movements on lower timeframes translate to larger timeframes.
Additional resources to learn about ADX & DMI:
1) seekingalpha.com
2) stockcharts.com
Previous versions:
1)
2)
Happy trading and feel free to reach out with any question, suggestions, or concerns!
MTF RSI + Average (Multi-Timeframe) [TH]Multi-Timeframe Relative Strength Index --- MTF RSI
Eliminates having to change time intervals to view a different Time Interval's RSI value (up to 5 time intervals possible through the settings).
The RSI values from Multiple Time Frames can be averaged together to show one single RSI.
A table overlay (info box) makes it easy to quickly identify RSI values on the multiple different time frames.

MTF Key Levels - Support and ResistanceThis indicator shows how to Multi Time Frame (MTF) interpret levels:
Watch how price acts around these levels and how they can act as support/resistance and can be used as great confluence levels for your technical analysis.
This indicator displays:
VWAP Levels
Daily / Weekly / Monthly / Yearly
Within the chart above I have marked out how displaying these VWAP levels can provide support and resistance levels to be aware of.
Daily – Weekly - Monthly – Yearly Levels
O = Open / H = High / L = Low
pO = Previous Open / pH = Previous High / pL = Previous Low / pEQ = Previous Equlibrium
Having previous Low/High levels makes you aware of Swing Failure Patterns (SFP). Also the daily/weekly/monthly opening and previous opening can assist with the trend.
Daily Open: Gives you an idea who is in control for the day. This level very often acts as strong support or resistance.
Weekly Open: Indicates where the price is within the higher timeframe.
Monthly Open & Yearly Levels: Overview of direction for the whole month without looking at a monthly chart and Yearly chart
Line Options
Within the line options you can choose to have a clean chart and display a “short line”. These line length can be adjusted by the user.
Line just to the right.
Line across the screen.
Disclaimer: The Monthly and Yealy VWAP will only show on higher timeframes this is due to restriction of how many candles can be shown on the chart. The candles displayed need to go back to either the start of the month of year to be able to calculate their VWAPs.

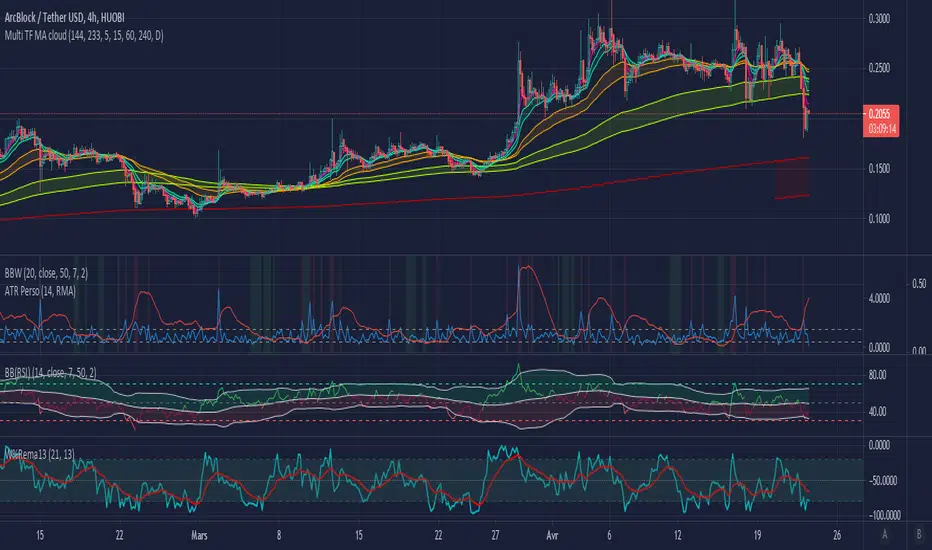
MTF Oscillators [Anan]Hello friends,
This is my own MTF oscillator framework verion.
You can control in everything from indicator settings suck as (Source, Length, OB/OS Zones, Show/Hide Timeframes and all Timeframes are supported).
List of supported oscillators:
RSX
RSI
MFI
CCI

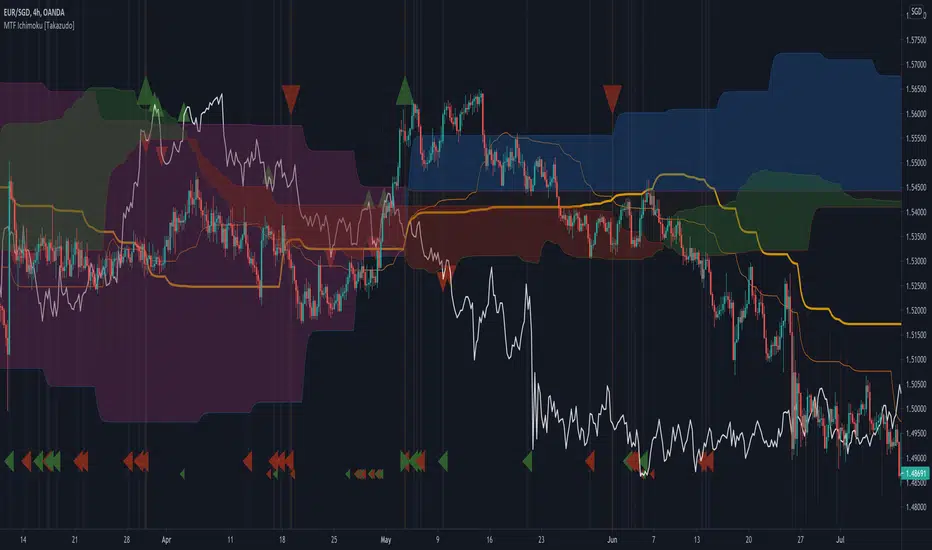
MTF Ichimoku [Takazudo]- A multi time frame Ichimoku with messy hint highlights.
- Most of MTF Ichimoku scripts doesn't handle Chikou-span's place correctly. This script does.
- This script was made to refer the 1day timeframe Ichimoku in lower timeframes.
- I use 1day timeframe mainly. But my entry is always in 4h or 1h timeframe.
OANDA:USDJPY
MM MTF Trend IndicatorMTF Trend Indicator is an indicator that can tell you the trend directions on multiple (4) time frames without having to keep switching between them
you can set 4 different time frames you want to monitor in the settings. time frame 1 is the first bar, 2 on the second bard, 3 on the third bar, and the 4th is last
red= downtrend
green= uptrend
orange= sideways market
Use link below or PM us for access you this indicator. Happy Trading

MTF Ichimoku CloudIchimoku Cloud , Multiple Time Frames, based on the script : MTF Selection Framework functions (PineCoders)
Possible display:
- four differents Ichimoku
- Tenkan, Kijun, Chikou and Kumo (monochrome or not)
- labels : offset from line, color if you change style and with/without abbreviation
Time Frames :
- 1m
- 3m
- 5m
- 15m
- 30m
- 45m
- 1h
- 2h
- 3h
- 4h
- Daily
- Weekly
- Monthly
