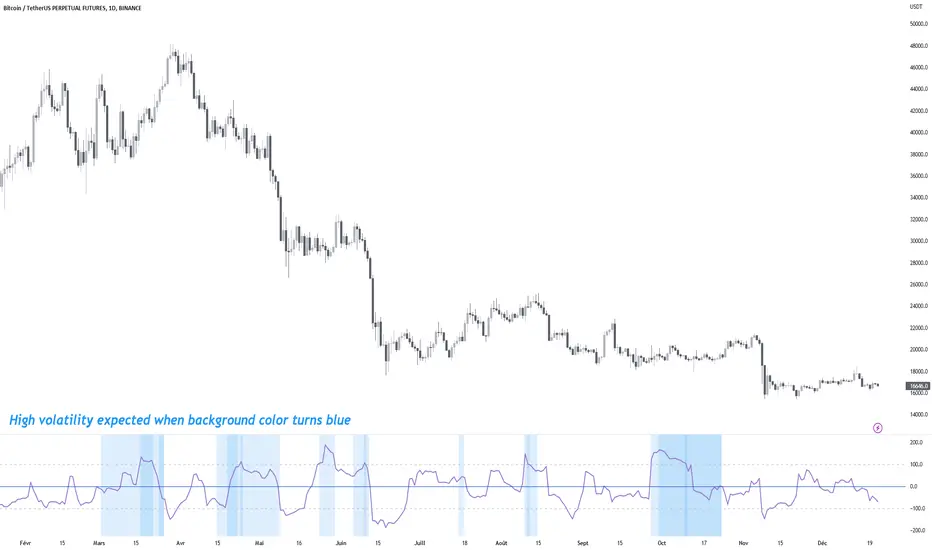
MTF Choppiness IndexMulti Time Frame Choppiness Index
Draw the choppiness index on multiple time frames (maximum 5).
Once a chop is charged on one time frame (above 100), the background will be coloured on the indicator window.
More the background is coloured, more there are charged time frames, and more you can expect high volatility .
A table of charged time frames will appear to indicate which time frame has its chop charged.
By default, the computed time frames will be a factor of your current chart time frame. Go to the Inputs tab in configuration to make them static if you need it.
By default, only the chop line of the current time frame is displayed. Go to the Style tab in configuration to display other time frame lines.
If you are using a lower time frame than your current chart, the line will not be accurate because of missing values.
Made by Trust The Setup 🤖
Cari dalam skrip untuk "mtf"
MTF MA Ribbon and Bands + BB, Gaussian F. and R. VWAP with StDev█ Multi Timeframe Moving Average Ribbon and Bands + Bollinger Bands, Gaussian Filter and Rolling Volume Weighted Average Price with Standard Deviation Bands
Up to 9 moving averages can be independently applied.
The length , type and timeframe of each moving average are configurable .
The lines, colors and background fill are customizable too.
This script can also display:
Moving Average Bands
Bollinger Bands
Gaussian Filter
Rolling VWAP and Standard Deviation Bands
Types of Moving Averages:
Simple Moving Average (SMA)
Exponential Moving Average (EMA)
Smoothed Moving Average (SMMA)
Weighted Moving Average (WMA)
Volume Weighted Moving Average (VWMA)
Least Squares Moving Average (LSMA)
Hull Moving Average (HMA)
Arnaud Legoux Moving Average (ALMA)
█ Moving Average
Moving Averages are price based, lagging (or reactive) indicators that display the average price of a security over a set period of time.
A Moving Average is a good way to gauge momentum as well as to confirm trends, and define areas of support and resistance.
█ Bollinger Bands
Bollinger Bands consist of a band of three lines which are plotted in relation to security prices.
The line in the middle is usually a Simple Moving Average (SMA) set to a period of 20 days (the type of trend line and period can be changed by the trader, a 20 day moving average is by far the most popular).
The SMA then serves as a base for the Upper and Lower Bands which are used as a way to measure volatility by observing the relationship between the Bands and price.
█ Gaussian Filter
Gaussian filter can be used for smoothing.
It rejects high frequencies (fast movements) better than an EMA and has lower lag.
A Gaussian filter is one whose transfer response is described by the familiar Gaussian bell-shaped curve.
In the case of low-pass filters, only the upper half of the curve describes the filter.
The use of gaussian filters is a move toward achieving the dual goal of reducing lag and reducing the lag of high-frequency components relative to the lag of lower-frequency components.
█ Rolling VWAP
The typical VWAP is designed to be used on intraday charts, as it resets at the beginning of the day.
Such VWAPs cannot be used on daily, weekly or monthly charts. Instead, this rolling VWAP uses a time period that automatically adjusts to the chart's timeframe.
You can thus use the rolling VWAP on any chart that includes volume information in its data feed.
Because the rolling VWAP uses a moving window, it does not exhibit the jumpiness of VWAP plots that reset.
Made with the help from scripts of: adam24x, VishvaP, loxx and pmk07.

MTF Stoch RSI + Realtime DivergencesMulti-timeframe Stochastic RSI + Realtime Divergences + Alerts + Pivot lookback periods.
This version of the Stochastic RSI adds the following additional features to the stock UO by Tradingview:
- Optional 3 x Multiple-timeframe overbought and oversold signals, indicating where 3 selected timeframes are all overbought (>80) or all oversold (<20) at the same time, with alert option.
- Optional divergence lines drawn directly onto the oscillator in realtime, with alert options.
- Configurable lookback periods to fine tune the divergences drawn in order to suit different trading styles and timeframes, including the ability to enable automatic adjustment of pivot period per chart timeframe.
- Alternate timeframe feature allows you to configure the oscillator to use data from a different timeframe than the chart it is loaded on.
- Indications where the Stoch RSI is crossing down from above the overbought threshold (<80) and crossing above the oversold threshold (>20) levels on a given user selected timeframe, by printing gold dots on the indicator.
- Also includes standard configurable Stoch RSI options, including k length, d length, RSI length, Stochastic length, and source type (close, hl2, etc)
While this version of the Stochastic RSI has the ability to draw divergences in realtime along with related settings and alerts so you can be notified as divergences occur without spending all day watching the charts, the main purpose of this indicator was to provide the triple multiple-timeframe overbought and oversold confluence signals and alerts, in an attempt to add more confluence, weight and reliability to the single timeframe overbought and oversold states, commonly used for trade entry confluence. It's primary purpose is intended for scalping on lower timeframes, typically between 1-15 minutes. The triple timeframe overbought can often indicate near term reversals to the downside, with the triple timeframe oversold often indicating neartime reversals to the upside. The default timeframes for this confluence are set to check the 1 minute, 5 minute, and 15 minute timeframes, ideal for scalping the < 15 minute charts.
The Stochastic RSI
The popular oscillator has been described as follows:
“The Stochastic RSI is an indicator used in technical analysis that ranges between zero and one (or zero and 100 on some charting platforms) and is created by applying the Stochastic oscillator formula to a set of relative strength index (RSI) values rather than to standard price data. Using RSI values within the Stochastic formula gives traders an idea of whether the current RSI value is overbought or oversold. The Stochastic RSI oscillator was developed to take advantage of both momentum indicators in order to create a more sensitive indicator that is attuned to a specific security's historical performance rather than a generalized analysis of price change.”
How do traders use overbought and oversold levels in their trading?
The oversold level, that is when the Stochastic RSI is above the 80 level is typically interpreted as being 'overbought', and below the 20 level is typically considered 'oversold'. Traders will often use the Stochastic RSI at an overbought level as a confluence for entry into a short position, and the Stochastic RSI at an oversold level as a confluence for an entry into a long position. These levels do not mean that price will necessarily reverse at those levels in a reliable way, however. This is why this version of the Stoch RSI employs the triple timeframe overbought and oversold confluence, in an attempt to add a more confluence and reliability to this usage of the Stoch RSI.
What are divergences?
Divergence is when the price of an asset is moving in the opposite direction of a technical indicator, such as an oscillator, or is moving contrary to other data. Divergence warns that the current price trend may be weakening, and in some cases may lead to the price changing direction.
There are 4 main types of divergence, which are split into 2 categories;
regular divergences and hidden divergences. Regular divergences indicate possible trend reversals, and hidden divergences indicate possible trend continuation.
Regular bullish divergence: An indication of a potential trend reversal, from the current downtrend, to an uptrend.
Regular bearish divergence: An indication of a potential trend reversal, from the current uptrend, to a downtrend.
Hidden bullish divergence: An indication of a potential uptrend continuation.
Hidden bearish divergence: An indication of a potential downtrend continuation.
Setting alerts.
With this indicator you can set alerts to notify you when any/all of the above types of divergences occur, on any chart timeframe you choose, and also when the triple timeframe overbought and oversold confluences occur.
Configurable pivot lookback values.
You can adjust the default pivot lookback values to suit your prefered trading style and timeframe. If you like to trade a shorter time frame, lowering the default lookback values will make the divergences drawn more sensitive to short term price action. By default, this indicator has enabled the automatic adjustment of the pivot periods for 4 configurable timeframes, in a bid to optimise the divergences drawn when the indicator is loaded onto any of the 4 timeframes. These timeframes and the auto adjusted pivot periods on each of them can also be reconfigured within the settings menu.
How do traders use divergences in their trading?
A divergence is considered a leading indicator in technical analysis , meaning it has the ability to indicate a potential price move in the short term future.
Hidden bullish and hidden bearish divergences, which indicate a potential continuation of the current trend are sometimes considered a good place for traders to begin, since trend continuation occurs more frequently than reversals, or trend changes.
When trading regular bullish divergences and regular bearish divergences, which are indications of a trend reversal, the probability of it doing so may increase when these occur at a strong support or resistance level . A common mistake new traders make is to get into a regular divergence trade too early, assuming it will immediately reverse, but these can continue to form for some time before the trend eventually changes, by using forms of support or resistance as an added confluence, such as when price reaches a moving average, the success rate when trading these patterns may increase.
Typically, traders will manually draw lines across the swing highs and swing lows of both the price chart and the oscillator to see whether they appear to present a divergence, this indicator will draw them for you, quickly and clearly, and can notify you when they occur.
Disclaimer: This script includes code from the stock UO by Tradingview as well as the Divergence for Many Indicators v4 by LonesomeTheBlue.

MTF Supertrend [Trading Nerd]Trend Trading Strategy using Supertrends
Backtesting Script that uses a multitimeframeanalysis of the Supertrend Indicator. The trend direction is determind by a higher Timeframe (TF) Supertrend. The entry Signals are given by the Supertrend of the current TF. The script is NOT repainting (the script takes the previous value of the higher TF Supertrend, if the higher TF candle is not confirmed yet).
Strategy Conditions
Longs:
The higher TF Supertrend has to be green
The current TF Supertrend change from red to green
Shorts:
The higher TF Supertrend has to be red
The current TF Supertrend change from green to red
Optional:
Option: If enabled also a trend chage of the higher TF Supertrend is a valid Entry Signal
If enabled Signals are discarded if the ADX is below the value
Take Profit
On default there is no Take Profit. You can activate a Risk Reward Based Take Profit target trough the option. Also a Partial Take Profit is possible.
Stop Loss
The default Stop Loss Strategy is a Trailing Stoploss. As trailing Price the current TF Supertrend is used.
Additional
Time Filter: Only opens trade in the defined Session. Open trades are still being closed outside of the Session.
Start Date/End Date: Limits the backtest for the defined Date Range
Trading Days: Only open Trades on the checked Days
Risk % per Trade: If enabled the Strategy uses X% of the capital (defined in Settings -> Properties -> Initial Capital)
Use Compound Interest: If enabled Capital is recalculated for every trade (initial capital + net Profit)
IMPORTANT: For low Timeframes and Markets with tight SL (like Forex) it requires a lower Margin Percent than default. Go to Settings->Properties and lower the required Long/Short Margin. Otherwise Trades might not be considered because of too less capital/marign. Margins can e.g. set to: 2% (Forex), 10% (Stocks), 20% (Crypto).

MTF Fair Value Gap Indicator ULTRAFVG Fair Value Gap Indicator
FVG's commonly known as Fair Value Gaps are mostly in use for forex trading, however it’s been widely used in price action trading, even on regular large cap stocks. Think of it as an imbalance area where the price of the stock may actually be under/over valued due to many orders being injected in a short amount of time, ie . a gap caused by an impulse created by the speed of the price movement. In essence, the FVG can become a kind of magnet drawing the price back to that level to attempt to balance out the orders (when? we don't know). Please do research to understand the concept of FVG's.
You can look for an opportunity as price approaches the FVG for entry either long/short because after all, it is an "Area of Interest" so the price will either bounce or blow through the area. No indicator works 100% of the time so take in context as just another indicator. It tends work on larger time frames best.
IMPORTANT TV RELATED LIMITATIONS: You should take the time to understand the following. A MAXIMUM of 500 boxes and labels are allowed, thus if you elect to display many different time frames of FVGs and/or select to not auto delete old Daily FVGs, the oldest FVGs will be deleted and not be seen. Additionally if you are on a smaller chart time frame (1 min), you may not see older FVGs such as Daily ones that occurred and still exist from long ago. This is due to TV limitation of 20,000 candles of history in each chart timeframe. Example: A 1 minute chart supports approximately 14 days worth of data so looking for Daily FVGs would only go back that far, whereas if your chart was set to 5 minutes you'd be able to see 5 times as many, ie . 60 days worth of Daily FVG's. Obviously setting your chart and looking for Daily FVG's would support up to 20,000 days worth.
The Indicator Provides many different features:
*Creation of FVG's for all hours or just during market hours. Currently you can enable FVG’s for the following timeframes: Current chart timeframe, 5Min, 10Min, 15Min, 1Hr, 4Hr, 8Hr, Daily, Weekly, Monthly.
*Text label displays overlaying FVG bands including creation timestamps.
* Bands reflecting FVG's in action (created/deleted) for the current chart time frame, 15min, 1hr, 4hr, 8hr and daily time frames. The FVG's will be overlayed on the chart if enabled.
*Mitigation Action - Normal - When FVG is balanced out by price action, the FVG will disappear. Dynamic - The FVG band will decrease as the price movement eats into it thus only showing the remaining imbalance. None - For those that wish to retain FVG's even if they were mitigated. Half - FVG’s disappear when the price intrudes 50% of the overall FVG band zone.
*Mitigation Type - The elimination or balancing of the FVG is caused by either the candle wick or body passing completely through the FVG.
*Maximum FVGs - A maximum number of FVGs are created for each different enabled time frame (be aware setting a large number could impact system performance).
*All FVG band colors can be customized by the user.
* All FVG bands auto extend to the right.
* Intrusion Alerts - Trading View alerts are supported. You can use the indicator settings to enable an alert if the price intrudes into the FVG zone by a certain percentage. This is not related to mitigation or removal of the FVG, just a warning that price has reached the area of interest.

MTF MACD BarOVERVIEW
This indicator shows MACD(Moving Average Convergence/Divergence) is up or down, represented by a bar. This indicator is compatible with MTF.
CONCEPTS
What do you want to know about market analysis?
Do you want a hard analysis? You can look for it.
All I want to know is whether the commonly known technical analysis is 'UP' or 'DOWN'.
All I want to know is whether the current market price is going up or down. Not only for the current, but also for the monthly, weekly, and daily status.
I want to make a decision in a moment. Without even thinking about it.
That is why I created a color-coded bar indicator to show the status.
No need to frown anymore.
DETAILS
You need more information about MACD, click here.
tradingview.com
MACD histogram Green ⇒ Bar is green.
MACD histogramRed ⇒ Bar is red.

Mtf Supertrend Table
english
It is a study of how the supertrend indicator looks on multiple timeframes. You can see the Supertrend direction in Multiple Timeframes by looking at the chart
Türkçe
supertrend indikatörünün çoklu zaman dilimdlerinde nasıl göründüğü yönünde bir çalışmadır. Tabloya bakarak Çoklu Zaman dilimlerinde Supertrend yönünü görebilirsiniz

MTF Heikinashi BarOVERVIEW
This indicator shows whether Heikin Ashi is up or down, represented by a bar. This indicator is compatible with MTF.
CONCEPTS
What do you want to know about market analysis?
Do you want a hard analysis? You can look for it.
All I want to know is whether the commonly known technical analysis is 'UP' or 'DOWN'.
All I want to know is whether the current market price is going up or down. Not only for the current, but also for the monthly, weekly, and daily status.
I want to make a decision in a moment. Without even thinking about it.
That is why I created a color-coded bar indicator to show the status.
No need to frown anymore.
DETAILS
Heikin means average. Ashi means legs. In this case, it means a candle.
Close = (Close + Open + High + Low) / 4
For more information, click here.
tradingview.com
Heikin Ashi Up ⇒ green
Heikin Ashi Down ⇒ red

MTF EMA Ribbon & Bands + BBMulti Timeframe Exponential Moving Average Ribbon & Bands + Boillinger Bands
I used the script "EMA Ribbon - low clutter, configurable " by adam24x, I made some color change and I added a few indicators (Boillinger Bands, EMA on multi timeframe and EMA bands from "34 EMA Bands " by VishvaP).
The script can display various EMA from the chart's timeframe but also EMA from other timeframes.
Bollinger Bands and EMA bands can also be added to the chart.

MTF VWAP & StDev BandsMulti Timeframe Volume Weighted Average Price with Standard Deviation Bands
I used the script "Koalafied VWAP D/W/M/Q/Y" by Koalafied_3 and made some changes, such as adding more standard deviation bands.
The script can display the daily, weekly, monthly, quarterly and yearly VWAP.
Standard deviation bands values can be changed (default values are 0.618, 1, 1.618, 2, 2.618, 3).
Also the previous standard deviation bands can be displayed.

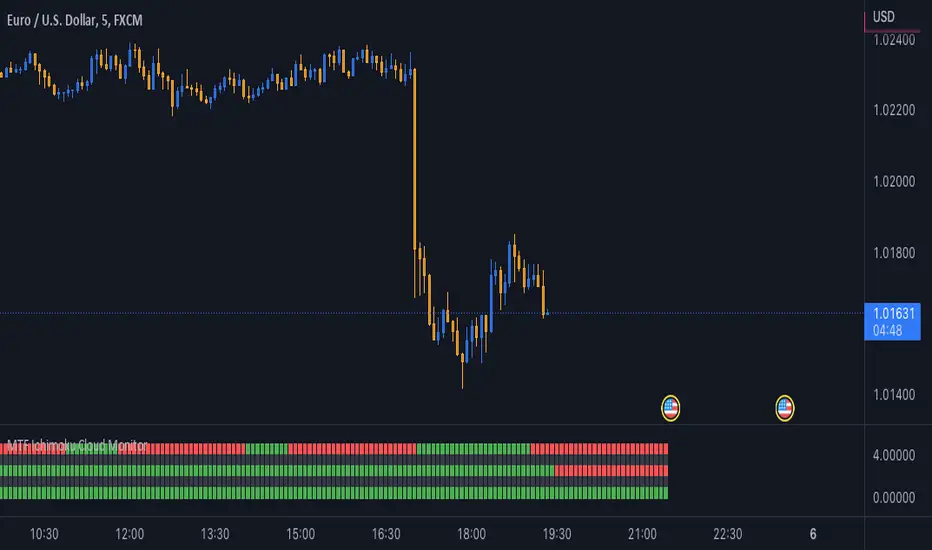
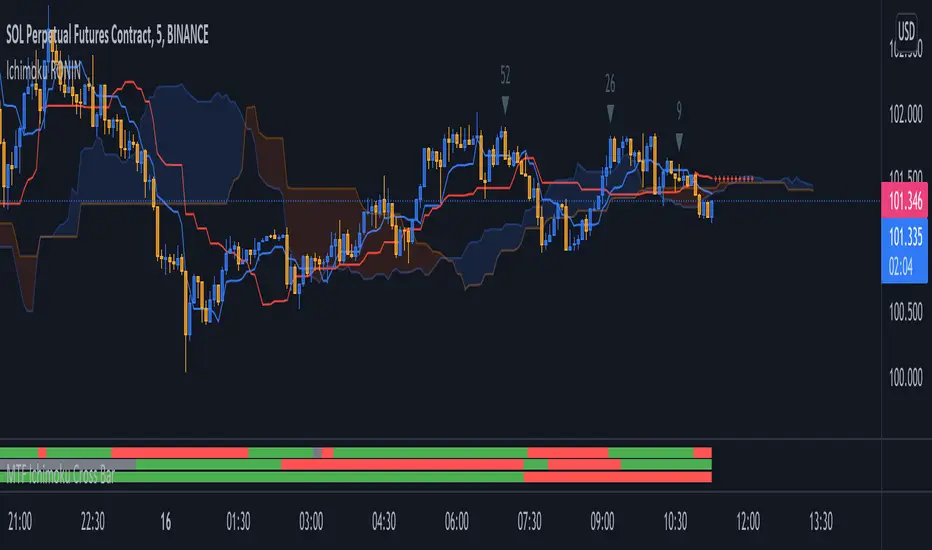
MTF Ichimoku Cloud MonitorIchimoku Kinko Hyo is a technical analysis method that builds on candlestick charting to improve the accuracy of forecast price moves.
his Indicator build for Monitor SenkouSpanA & SenkouSpanB Lines (Kumo Cloud) status and you can watch 3 Time Frames Status on one bar and in one timeframe.
You can select timeframe and set Inputs for lines from Indicator setting.
Good trading to all ...
MTF EMA with Gann square of nineThis indicator can display Exponential Moving Average 200 (last point) at different timeframe simultaneously.
The default timeframe of EMA200 is 5min, 15min, 30min, 1H, 2H, 4H, 1D and 1W.
In addition, this script come with Gann square of nine nearest level.

MTF CCI BarOVERVIEW
This indicator shows whether Commodity Channel Index (CCI) is above or below 0, represented by a bar. This indicator is compatible with MTF.
CONCEPTS
What do you want to know about market analysis?
Do you want a hard analysis? You can look for it.
All I want to know is whether the commonly known technical analysis is 'UP' or 'DOWN'.
All I want to know is whether the current market price is going up or down. Not only for the current, but also for the monthly, weekly, and daily status.
I want to make a decision in a moment. Without even thinking about it.
That is why I created a color-coded bar indicator to show the status.
No need to frown anymore.
DETAILS
CCI is a momentum oscillator used in technical analysis primarily to identify overbought and oversold levels by measuring an instrument's variations away from its statistical mean. For this indicator, I have removed the concept of overbought and oversold.
0 <= CCI green
0 > CCI red
However, with future upgrades, I would like to color-code it for overbought and oversold conditions as well.

MTF EMASMulti time frame EMA
This script will plot the configured EMAS on the current time frame (CTF) and also the same EMAS on a higher time frame (HTF).
Hard coded according:
* 5m EMAS will be plotted on TF bellow 5m
* Daily EMA will be plotted on TF above 5m and bellow 1D
* Weekly EMA will be plotted on daily TF
* Monthly EMA will be plotted on weekly TF
This configuration give us the opportunity to watch EMA support/resistance from HTF on the CTF

MTF High LowThis is a Multi-Time Frame High Low Indicator that plots the highest and lowest price levels of the chart timeframe and a user selected higher timeframe.
The length can be optimized by the user from settings (default value is 6 candles) and table position can also be adjusted.
The calculation does not takes into account the last candle price data to form a view using the current close price as described below:
If Close > mid value of High + Low, view is Bullish
If Close < mid value of High + Low, view is Bearish
The above is also calculated for the higher timeframe and view for both timeframe is updated in the chart.
The color coding is dynamic based upon the current close price levels and comparisons with High, Low and Mid values.
The mid values level plot is hidden by default and can be enabled and saved as default if the user likes so.

MTF RSI Guppy [Moto]Hi traders,
Special thanks to abdomi for posting the original script referenced
I'm not a fan of using moving averages. but I am a big fan of the RSI. The plotted lines of this guppy show where price of the observed asset has to be to close above or below the 50 midline of a standard 14 period RSI across multiple timeframes.
For example, if BTCUSDT closes above the 'D' plot of the guppy, it will be closing above the 50 midline of the RSI on a daily time frame.
Each plot is timeframe dependant and can be changed in the settings. I've included a optional fill color across the plots for directional bias. These plots, like most moving averages give a hint towards moving support and resistance structures. Plotshapes and barcolors have been included to indicate when price crosses over multiple specific plots simultaneously.
Also 'On' by default is a view of 'Overbought' and 'Oversold' areas with independant resolution setting, daily by default.
Current time frames include:
4 hour
12 Hour
Daily
3 Day
Weekly
Monthly
Quarterly
Users can change the asset being referenced, and the resolutions, but labels are currently hard coded. One can also change the label distance from plot and size.
Thanks

MTF 24-hour Volume [Anan]█ OVERVIEW
Tradingview added a new 24-hour Volume indicator to Pine. It’s designed to calculate the volume of daily trading turnover in a particular currency.
It works in the same way as the well-known Volume indicator does. The difference is that 24-hour Volume is a metric used to track the total value of all transactions within a 24-hour period. It can be used to measure market interest in a specific currency over the past day and night. You can read more about how the 24-hour Volume indicator works in Help Center .
█ FEATURES
- Multi Time Frames up to four customizable slots.
- Volume Change by "quote" currency.
- Volume Change %.
- Volume MA Change %.
- Control table colors/position as you like.
**Designed to work with Crypto pairs**

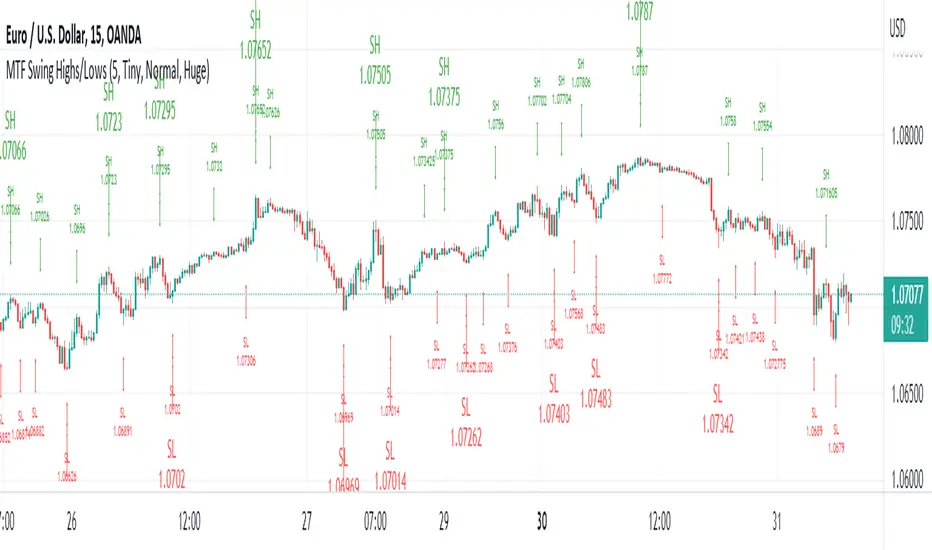
MTF Swing Highs/LowsI designed this indicator out of necessity for the Market structure/Price action trading strategy I use.
I thought I'd share. :)
This indicator displays Swing Highs and Lows an 3 timeframes based on the Chart timeframe, as follows:
Chart TF Higher TF Highest TF
1m 5m 15m
5m 15m 60m
15m 60m 240m
60m 240m Daily
You can change the font size of the labels as you'd prefer.
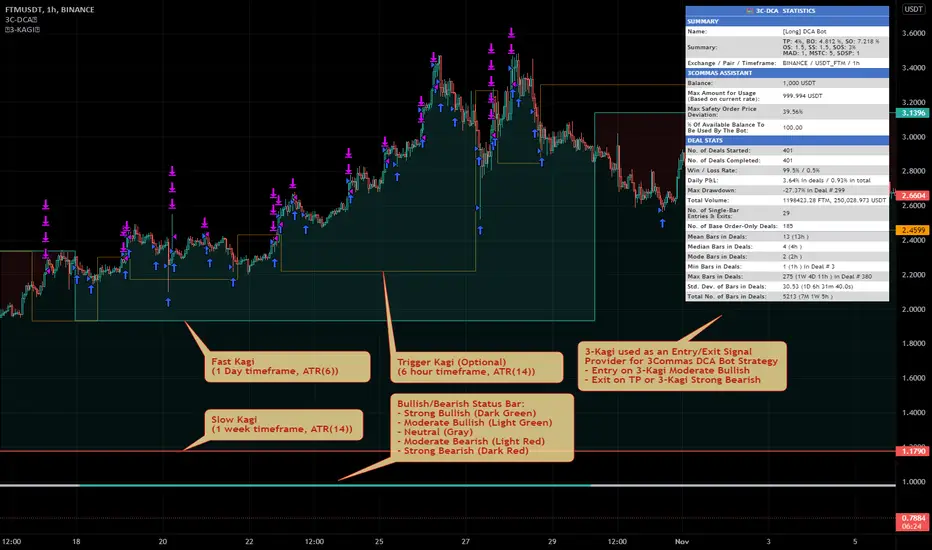
MTF Triple Kagi Indicator v1.0Introduction
The indicator attempts to implement three (3) time-based, multi-timeframe, non-repainting Kagi lines as an overlay to your chart and applying a trend bullish/bearish trend strength evaluation based on the position of the Kagi close prices between the Fast Kagi and Slow Kagi.
How is it original and useful?
This indicator is unique in that it combines a Fast and Slow Kagi timeframes and applies the following trend analysis to determine bullish/bearish strength:
Strong Bullish = when both Fast and Slow Kagi are below the current price and Slow is less than or equal to Fast Kagi.
Moderate Bullish = when both Fast and Slow Kagi are below the current price and Slow is greater than Fast Kagi.
Neutral = when current price is between the Fast and Slow Kagi.
Moderate Bearish = when both Fast and Slow Kagi are above the current price and Slow is less than Fast Kagi.
Strong Bearish = when both Fast and Slow Kagi are above the current price and Slow greater than or equal to Fast Kagi.
In addition, the indicator adds a Trigger Kagi that you can optionally use as a faster Kagi to see more confirmation of trend within the Fast/Slow Kagi combination. It is not used in the bullish/bearish comparison analysis but is simply informative in confirming the trend with a smaller timeframe than the Fast Kagi.
How does it compare to other scripts in the Public Library?
This indicator makes use of the security() function and applies the best-practices as provided by the PineCoders' script called `security()` revisited so that the indicator will not repaint when you refresh the chart or re-open it at a later date. In addition, at the time of initial publishing, this indicator is the only publicly available indicator that combines multiple time-based Kagi lines to offer a simple trend analysis status for short-term or long-term traders.
What does it do and how does it do it?
When applied to the chart for the first time, the default settings will work to produce Kagi lines from the beginning of the chart history up to the real-time bar. All three Kagi lines will default to the current chart's timeframe, therefore it is expected that you open the settings and adjust the Fast and Slow Kagi settings to provide the full effects of the indicator's features. The example chart above is using a 1-Hour chart with a Fast Kagi of 1 day (ATR(6)), a Slow Kagi of 1-Week (ATR(6)) and a Trigger Kagi of 6-Hours (ATR(14)). These settings are not universal for all markets; thus, it will require trial and error adjustments to tune the indicator to the specific market you are evaluating.
Lastly, the example chart above is illustrating how this indicator could be used with the 3Commas DCA Bot Strategy to provide entry and exit signals to simulate a bot's performance using the powerful Strategy Tester within TradingView to further evaluate the indicators influence on hypothetical trading conditions. The indicator provides a plot data point called "Kagi Bullish/Bearish Signal" that can be used in other chart strategies as a signal provider. The following is the meaning of the numeric signal value for this data point:
Strong Bullish = 2
Moderate Bullish = 1
Neutral = 0
Moderate Bearish = -1
Strong Bearish = -2
Enjoy! 😊👍
MTF Kagi Indicator v1.0Introduction
The indicator attempts to implement a time-based, multi-timeframe, non-repainting Kagi lines as an overlay to your chart using traditional candlesticks.
How is it original and useful?
This indicator is unique in that it allows you to choose from among three different methods to define the reversal amount. They are:
ATR (Average True Range): After each Kagi line is drawn, the latest ATR value from the selected timeframe will be used until a new vertical Kagi line is drawn. At this point, the latest ATR value will be used for the reversal amount until it changes again. This means that the reversal amount will adjust as price action volatility changes.
Fixed Amount: This method will be useful if you desire to fix the reversal amount, like the normal Kagi Chart. Thus, use this option if you desire to mimic the same Kagi Chart on TradingView.
Percent of Price: This method, like the ATR, will produce the reversal amount using the latest close price against the given percentage value.
In addition, the indicator will allow you to define the Up and Down line colors and width. You can even elect to have a Kagi line drawn on the real-time bar or not.
How does it compare to other scripts in the Public Library?
This indicator makes use of the security() function and applies the best-practices as provided by the PineCoders' script called " `security()` revisited " so that the indicator will not repaint when you refresh the chart or re-open it at a later date. In addition, the indicator provides three possible alerts for Alert Conditions or Any Alert() Function Call. They are:
"Break Shoulder" - this alert will trigger (Once Per Bar) when the close price crosses above the shoulder (higher) of the previous Kagi line.
"Break Waist" - this alert will trigger (Once Per Bar) when the close price crosses below the waist (lower) of the previous Kagi line.
"New Kagi Line" - this alert will trigger (Once Per Bar) when the indicator draws a new vertical Kagi line and continues to monitor the next trend change.
When using the "Any alert() function call" option in creating alerts, the following placeholders are supported in the alert message: {{shoulder_price}}, {{waist_price}}, and {{kagi_close_price}}
What does it do and how does it do it?
When applied to the chart for the first time, the default settings will work to produce Kagi lines from the beginning of the chart history up to the real-time bar. The Kagi line width will have a width of 1 pixel and the colors will match the normal color schemes that TradingView charts have for rising and falling colors. The reversal method will default to ATR with a period length of 14 so that it can provide a visually appealing Kagi lines where the reversal amount will be adaptive for all price charts. The default timeframe will be the chart's timeframe, but it can be changed to any higher timeframe. Using a timeframe that is lower than the current chart will not disable the indicator, but the lines will not be accurate since lower timeframe prices are being grouped to fit the current timeframe.
Enjoy! 😊👍

MTF Ichimoku Cross MonitorIchimoku Kinko Hyo is a technical analysis method that builds on candlestick charting to improve the accuracy of forecast price moves and Crossing TenkanSen ((HH + LL)/2 for the last 9 periods) & KijunSen (HH + LL)/2 for the last 26 periods) is One of major strategies on Ichimoku.
This Indicator build for Monitor Tenkansen & Kijunsen Lines status and you can watch 3 Time Frames Status on one bar and in one timeframe.
You can select timeframe and set Inputs for lines from Indicator setting.
Good trading to all ...
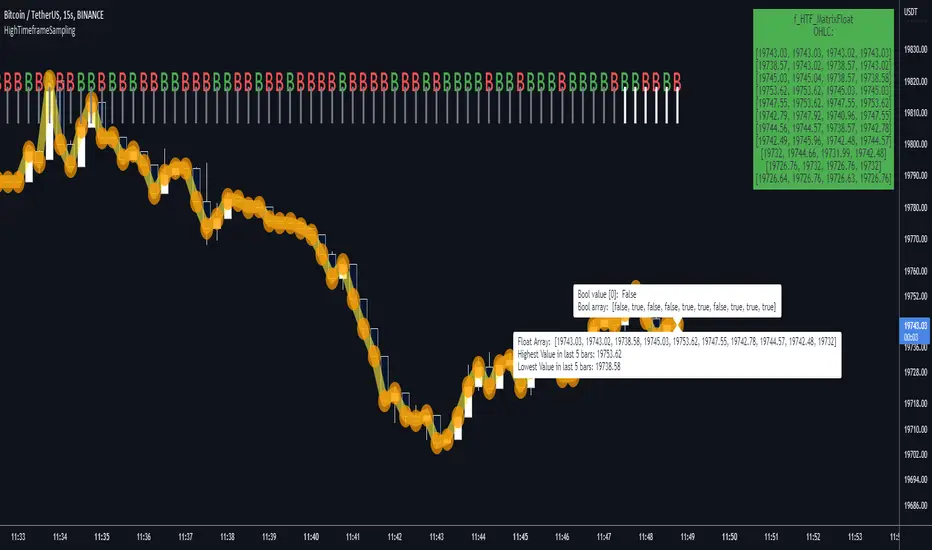
HighTimeframeSamplingLibrary "HighTimeframeSampling"
Library for sampling high timeframe (HTF) data. Returns an array of historical values, an arbitrary historical value, or the highest/lowest value in a range, spending a single security() call.
An optional pass-through for the chart timeframe is included. Other than that case, the data is fixed and does not alter over the course of the HTF bar. It behaves consistently on historical and elapsed realtime bars.
The first version returns floating-point numbers only. I might extend it if there's interest.
🙏 Credits: This library is (yet another) attempt at a solution of the problems in using HTF data that were laid out by Pinecoders - to whom, especially to Luc F, many thanks are due - in "security() revisited" - which I recommend you consult first. Go ahead, I'll wait.
All code is my own.
~~~~~~~~~~~~~~~~~~~~~~~~~~~~~~~~~~~~~~~~~~~~~~~~~~~~~~~~~~~~~~~~~~~~
WHAT'S THE PROBLEM? OR, WHY NOT JUST USE SECURITY()
~~~~~~~~~~~~~~~~~~~~~~~~~~~~~~~~~~~~~~~~~~~~~~~~~~~~~~~~~~~~~~~~~~~~
There are many difficulties with using HTF data, and many potential solutions. It's not really possible to convey it only in words: you need to see it on a chart.
Before using this library, please refer to my other HTF library, HighTimeframeTiming: which explains it extensively, compares many different solutions, and demonstrates (what I think are) the advantages of using this very library, namely, that it's stable, accurate, versatile and inexpensive. Then if you agree, come back here and choose your function.
~~~~~~~~~~~~~~~~~~~~~~~~~~~~~~~~~~~~~~~~~~~~~~~~~~~~~~~~~~~~~~~~~~~~
MOAR EXPLANATION
~~~~~~~~~~~~~~~~~~~~~~~~~~~~~~~~~~~~~~~~~~~~~~~~~~~~~~~~~~~~~~~~~~~~
🧹 Housekeeping: To see which plot is which, turn line labels on: Settings > Scales > Indicator Name Label. Vertical lines at the top of the chart show the open of a HTF bar: grey for historical and white for real-time bars.
‼ LIMITATIONS: To avoid strange behaviour, use this library on liquid assets and at chart timeframes high enough to reliably produce updates at least once per bar period.
A more conventional and universal limitation is that the library does not offer an unlimited view of historical bars. You need to define upfront how many HTF bars you want to store. Very large numbers might conceivably run into data or performance issues.
~~~~~~~~~~~~~~~~~~~~~~~~~~~~~~~~~~~~~~~~~~~~~~~~~~~~~~~~~~~~~~~~~~~~
BRING ON THE FUNCTIONS
~~~~~~~~~~~~~~~~~~~~~~~~~~~~~~~~~~~~~~~~~~~~~~~~~~~~~~~~~~~~~~~~~~~~
@function f_HTF_Value(string _HTF, float _source, int _arrayLength, int _HTF_Offset, bool _useLiveDataOnChartTF=false)
Returns a floating-point number from a higher timeframe, with a historical operator within an abitrary (but limited) number of bars.
@param string _HTF is the string that represents the higher timeframe. It must be in a format that the request.security() function recognises. The input timeframe cannot be lower than the chart timeframe or an error is thrown.
@param float _source is the source value that you want to sample, e.g. close, open, etc., or you can use any floating-point number.
@param int _arrayLength is the number of HTF bars you want to store and must be greater than zero. You can't go back further in history than this number of bars (minus one, because the current/most recent available bar is also stored).
@param int _HTF_Offset is the historical operator for the value you want to return. E.g., if you want the most recent fixed close, _source=close and _HTF_Offset = 0. If you want the one before that, _HTF_Offset=1, etc.
The number of HTF bars to look back must be zero or more, and must be one less than the number of bars stored.
@param bool _useLiveDataOnChartTF uses live data on the chart timeframe.
If the higher timeframe is the same as the chart timeframe, store the live value (i.e., from this very bar). For all truly higher timeframes, store the fixed value (i.e., from the previous bar).
The default is to use live data for the chart timeframe, so that this function works intuitively, that is, it does not fix data unless it has to (i.e., because the data is from a higher timeframe).
This means that on default settings, on the chart timeframe, it matches the raw source values from security(){0}.
You can override this behaviour by passing _useLiveDataOnChartTF as false. Then it will fix all data for all timeframes.
@returns a floating-point value that you requested from the higher timeframe.
@function f_HTF_Array(string _HTF, float _source, int _arrayLength, bool _useLiveDataOnChartTF=false, int _startIn, int _endIn)
Returns an array of historical values from a higher timeframe, starting with the current bar. Optionally, returns a slice of the array. The array is in reverse chronological order, i.e., index 0 contains the most recent value.
@param string _HTF is the string that represents the higher timeframe. It must be in a format that the request.security() function recognises. The input timeframe cannot be lower than the chart timeframe or an error is thrown.
@param float _source is the source value that you want to sample, e.g. close, open, etc., or you can use any floating-point number.
@param int _arrayLength is the number of HTF bars you want to keep in the array.
@param bool _useLiveDataOnChartTF uses live data on the chart timeframe.
If the higher timeframe is the same as the chart timeframe, store the live value (i.e., from this very bar). For all truly higher timeframes, store the fixed value (i.e., from the previous bar).
The default is to use live data for the chart timeframe, so that this function works intuitively, that is, it does not fix data unless it has to (i.e., because the data is from a higher timeframe).
This means that on default settings, on the chart timeframe, it matches raw source values from security().
You can override this behaviour by passing _useLiveDataOnChartTF as false. Then it will fix all data for all timeframes.
@param int _startIn is the array index to begin taking a slice. Must be at least one less than the length of the array; if out of bounds it is corrected to 0.
@param int _endIn is the array index BEFORE WHICH to end the slice. If the ending index of the array slice would take the slice past the end of the array, it is corrected to the end of the array. The ending index of the array slice must be greater than or equal to the starting index. If the end is less than the start, the whole array is returned. If the starting index is the same as the ending index, an empty array is returned. If either the starting or ending index is negative, the entire array is returned (which is the default behaviour; this is effectively a switch to bypass the slicing without taking up an extra parameter).
@returns an array of HTF values.
@function f_HTF_Highest(string _HTF="", float _source, int _arrayLength, bool _useLiveDataOnChartTF=true, int _rangeIn)
Returns the highest value within a range consisting of a given number of bars back from the most recent bar.
@param string _HTF is the string that represents the higher timeframe. It must be in a format that the request.security() function recognises. The input timeframe cannot be lower than the chart timeframe or an error is thrown.
@param float _source is the source value that you want to sample, e.g. close, open, etc., or you can use any floating-point number.
@param int _arrayLength is the number of HTF bars you want to store and must be greater than zero. You can't have a range greater than this number.
@param bool _useLiveDataOnChartTF uses live data on the chart timeframe.
If the higher timeframe is the same as the chart timeframe, store the live value (i.e., from this very bar). For all truly higher timeframes, store the fixed value (i.e., from the previous bar).
The default is to use live data for the chart timeframe, so that this function works intuitively, that is, it does not fix data unless it has to (i.e., because the data is from a higher timeframe).
This means that on default settings, on the chart timeframe, it matches raw source values from security().
You can override this behaviour by passing _useLiveDataOnChartTF as false. Then it will fix all data for all timeframes.
@param _rangeIn is the number of bars to include in the range of bars from which we want to find the highest value. It is NOT the historical operator of the last bar in the range. The range always starts at the current bar. A value of 1 doesn't make much sense but the function will generously return the only value it can anyway. A value less than 1 doesn't make sense and will return an error. A value that is higher than the number of stored values will be corrected to equal the number of stored values.
@returns a floating-point number representing the highest value in the range.
@function f_HTF_Lowest(string _HTF="", float _source, int _arrayLength, bool _useLiveDataOnChartTF=true, int _rangeIn)
Returns the lowest value within a range consisting of a given number of bars back from the most recent bar.
@param string _HTF is the string that represents the higher timeframe. It must be in a format that the request.security() function recognises. The input timeframe cannot be lower than the chart timeframe or an error is thrown.
@param float _source is the source value that you want to sample, e.g. close, open, etc., or you can use any floating-point number.
@param int _arrayLength is the number of HTF bars you want to store and must be greater than zero. You can't go back further in history than this number of bars (minus one, because the current/most recent available bar is also stored).
@param bool _useLiveDataOnChartTF uses live data on the chart timeframe.
If the higher timeframe is the same as the chart timeframe, store the live value (i.e., from this very bar). For all truly higher timeframes, store the fixed value (i.e., from the previous bar).
The default is to use live data for the chart timeframe, so that this function works intuitively, that is, it does not fix data unless it has to (i.e., because the data is from a higher timeframe).
This means that on default settings, on the chart timeframe, it matches raw source values from security().
You can override this behaviour by passing _useLiveDataOnChartTF as false. Then it will fix all data for all timeframes.
@param _rangeIn is the number of bars to include in the range of bars from which we want to find the highest value. It is NOT the historical operator of the last bar in the range. The range always starts at the current bar. A value of 1 doesn't make much sense but the function will generously return the only value it can anyway. A value less than 1 doesn't make sense and will return an error. A value that is higher than the number of stored values will be corrected to equal the number of stored values.
@returns a floating-point number representing the lowest value in the range.
MTF Pivots Zones [tanayroy]Dear Fellow Traders,
I only publish scripts that I use and found good for my trading. Pivots are my favorite indicator. I use daily, weekly, monthly, quarterly, and yearly pivots levels. multiple pivot zones are very strong levels and I like to watch these levels for possible price action.
But when I include all pivots levels at a time, my charts get too clumsy. To see price action properly, you need a clean chart. And when we trade we want to see only important levels within the price horizon.
To resolve this, I created this script, which shows important levels within my display option. I control the display option with 14 periods ATR and a multiplier to adjust the display levels.
The following chart displays levels within 14 ATR * 0.5 multipliers. As the price progress, it will automatically add levels and delete levels that do not come within this option.
What levels are included?
I have used traditional pivot calculation and included Daily, Weekly, Monthly, Quarterly, and Yearly pivots with high and low.
What options are available?
You can replace the yearly timeframe with your desired time frame and can adjust the ATR multiplier to increase or decrease display levels.
Use this in 5m, 15m, or 1H chart or any timeframe below Daily.
Please like, share, and comment.
