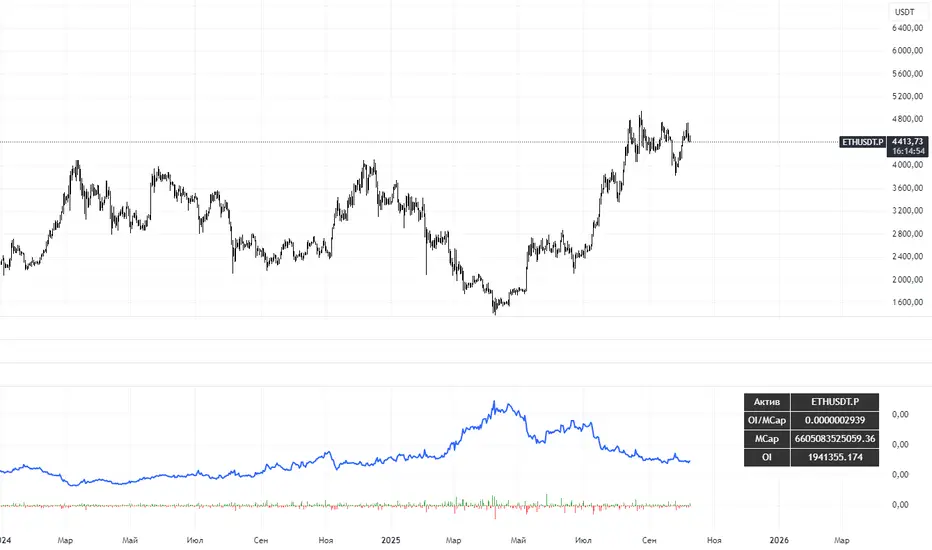
VSTrade OMCThe indicator calculates the ratio of Open Interest (OI) of a futures contract to the market capitalization (Market Cap) of the spot asset. OI is the number of open (unclosed) futures positions in the market, expressed in contracts. Market Cap is the total value of the asset (price * circulating supply). The ratio shows how "overheated" or "interesting" the futures market is relative to the size of the asset.This is not a direct trading signal, but a tool for analyzing liquidity, speculation, and market sentiment.
Индикатор рассчитывает отношение Open Interest (OI) фьючерсного контракта к рыночной капитализации (Market Cap) спотового актива. OI — это количество открытых (незакрытых) фьючерсных позиций на рынке, выраженное в контрактах. Market Cap — общая стоимость актива (цена * circulating supply). Отношение (ratio) показывает, насколько "перегрет" или "интересен" рынок фьючерсов относительно размера актива.
Это не прямой торговый сигнал, а инструмент для анализа ликвидности, спекуляции и рыночных настроений.
Cari dalam skrip untuk "open interest"
Request█ OVERVIEW
This library is a tool for Pine Script™ programmers that consolidates access to a wide range of lesser-known data feeds available on TradingView, including metrics from the FRED database, FINRA short sale volume, open interest, and COT data. The functions in this library simplify requests for these data feeds, making them easier to retrieve and use in custom scripts.
█ CONCEPTS
Federal Reserve Economic Data (FRED)
FRED (Federal Reserve Economic Data) is a comprehensive online database curated by the Federal Reserve Bank of St. Louis. It provides free access to extensive economic and financial data from U.S. and international sources. FRED includes numerous economic indicators such as GDP, inflation, employment, and interest rates. Additionally, it provides financial market data, regional statistics, and international metrics such as exchange rates and trade balances.
Sourced from reputable organizations, including U.S. government agencies, international institutions, and other public and private entities, FRED enables users to analyze over 825,000 time series, download their data in various formats, and integrate their information into analytical tools and programming workflows.
On TradingView, FRED data is available from ticker identifiers with the "FRED:" prefix. Users can search for FRED symbols in the "Symbol Search" window, and Pine scripts can retrieve data for these symbols via `request.*()` function calls.
FINRA Short Sale Volume
FINRA (the Financial Industry Regulatory Authority) is a non-governmental organization that supervises and regulates U.S. broker-dealers and securities professionals. Its primary aim is to protect investors and ensure integrity and transparency in financial markets.
FINRA's Short Sale Volume data provides detailed information about daily short-selling activity across U.S. equity markets. This data tracks the volume of short sales reported to FINRA's trade reporting facilities (TRFs), including shares sold on FINRA-regulated Alternative Trading Systems (ATSs) and over-the-counter (OTC) markets, offering transparent access to short-selling information not typically available from exchanges. This data helps market participants, researchers, and regulators monitor trends in short-selling and gain insights into bearish sentiment, hedging strategies, and potential market manipulation. Investors often use this data alongside other metrics to assess stock performance, liquidity, and overall trading activity.
It is important to note that FINRA's Short Sale Volume data does not consolidate short sale information from public exchanges and excludes trading activity that is not publicly disseminated.
TradingView provides ticker identifiers for requesting Short Sale Volume data with the format "FINRA:_SHORT_VOLUME", where "" is a supported U.S. equities symbol (e.g., "AAPL").
Open Interest (OI)
Open interest is a cornerstone indicator of market activity and sentiment in derivatives markets such as options or futures. In contrast to volume, which measures the number of contracts opened or closed within a period, OI measures the number of outstanding contracts that are not yet settled. This distinction makes OI a more robust indicator of how money flows through derivatives, offering meaningful insights into liquidity, market interest, and trends. Many traders and investors analyze OI alongside volume and price action to gain an enhanced perspective on market dynamics and reinforce trading decisions.
TradingView offers many ticker identifiers for requesting OI data with the format "_OI", where "" represents a derivative instrument's ticker ID (e.g., "COMEX:GC1!").
Commitment of Traders (COT)
Commitment of Traders data provides an informative weekly breakdown of the aggregate positions held by various market participants, including commercial hedgers, non-commercial speculators, and small traders, in the U.S. derivative markets. Tallied and managed by the Commodity Futures Trading Commission (CFTC) , these reports provide traders and analysts with detailed insight into an asset's open interest and help them assess the actions of various market players. COT data is valuable for gaining a deeper understanding of market dynamics, sentiment, trends, and liquidity, which helps traders develop informed trading strategies.
TradingView has numerous ticker identifiers that provide access to time series containing data for various COT metrics. To learn about COT ticker IDs and how they work, see our LibraryCOT publication.
█ USING THE LIBRARY
Common function characteristics
• This library's functions construct ticker IDs with valid formats based on their specified parameters, then use them as the `symbol` argument in request.security() to retrieve data from the specified context.
• Most of these functions automatically select the timeframe of a data request because the data feeds are not available for all timeframes.
• All the functions have two overloads. The first overload of each function uses values with the "simple" qualifier to define the requested context, meaning the context does not change after the first script execution. The second accepts "series" values, meaning it can request data from different contexts across executions.
• The `gaps` parameter in most of these functions specifies whether the returned data is `na` when a new value is unavailable for request. By default, its value is `false`, meaning the call returns the last retrieved data when no new data is available.
• The `repaint` parameter in applicable functions determines whether the request can fetch the latest unconfirmed values from a higher timeframe on realtime bars, which might repaint after the script restarts. If `false`, the function only returns confirmed higher-timeframe values to avoid repainting. The default value is `true`.
`fred()`
The `fred()` function retrieves the most recent value of a specified series from the Federal Reserve Economic Data (FRED) database. With this function, programmers can easily fetch macroeconomic indicators, such as GDP and unemployment rates, and use them directly in their scripts.
How it works
The function's `fredCode` parameter accepts a "string" representing the unique identifier of a specific FRED series. Examples include "GDP" for the "Gross Domestic Product" series and "UNRATE" for the "Unemployment Rate" series. Over 825,000 codes are available. To access codes for available series, search the FRED website .
The function adds the "FRED:" prefix to the specified `fredCode` to construct a valid FRED ticker ID (e.g., "FRED:GDP"), which it uses in request.security() to retrieve the series data.
Example Usage
This line of code requests the latest value from the Gross Domestic Product series and assigns the returned value to a `gdpValue` variable:
float gdpValue = fred("GDP")
`finraShortSaleVolume()`
The `finraShortSaleVolume()` function retrieves EOD data from a FINRA Short Sale Volume series. Programmers can call this function to retrieve short-selling information for equities listed on supported exchanges, namely NASDAQ, NYSE, and NYSE ARCA.
How it works
The `symbol` parameter determines which symbol's short sale volume information is retrieved by the function. If the value is na , the function requests short sale volume data for the chart's symbol. The argument can be the name of the symbol from a supported exchange (e.g., "AAPL") or a ticker ID with an exchange prefix ("NASDAQ:AAPL"). If the `symbol` contains an exchange prefix, it must be one of the following: "NASDAQ", "NYSE", "AMEX", or "BATS".
The function constructs a ticker ID in the format "FINRA:ticker_SHORT_VOLUME", where "ticker" is the symbol name without the exchange prefix (e.g., "AAPL"). It then uses the ticker ID in request.security() to retrieve the available data.
Example Usage
This line of code retrieves short sale volume for the chart's symbol and assigns the result to a `shortVolume` variable:
float shortVolume = finraShortSaleVolume(syminfo.tickerid)
This example requests short sale volume for the "NASDAQ:AAPL" symbol, irrespective of the current chart:
float shortVolume = finraShortSaleVolume("NASDAQ:AAPL")
`openInterestFutures()` and `openInterestCrypto()`
The `openInterestFutures()` function retrieves EOD open interest (OI) data for futures contracts. The `openInterestCrypto()` function provides more granular OI data for cryptocurrency contracts.
How they work
The `openInterestFutures()` function retrieves EOD closing OI information. Its design is focused primarily on retrieving OI data for futures, as only EOD OI data is available for these instruments. If the chart uses an intraday timeframe, the function requests data from the "1D" timeframe. Otherwise, it uses the chart's timeframe.
The `openInterestCrypto()` function retrieves opening, high, low, and closing OI data for a cryptocurrency contract on a specified timeframe. Unlike `openInterest()`, this function can also retrieve granular data from intraday timeframes.
Both functions contain a `symbol` parameter that determines the symbol for which the calls request OI data. The functions construct a valid OI ticker ID from the chosen symbol by appending "_OI" to the end (e.g., "CME:ES1!_OI").
The `openInterestFutures()` function requests and returns a two-element tuple containing the futures instrument's EOD closing OI and a "bool" condition indicating whether OI is rising.
The `openInterestCrypto()` function requests and returns a five-element tuple containing the cryptocurrency contract's opening, high, low, and closing OI, and a "bool" condition indicating whether OI is rising.
Example usage
This code line calls `openInterest()` to retrieve EOD OI and the OI rising condition for a futures symbol on the chart, assigning the values to two variables in a tuple:
= openInterestFutures(syminfo.tickerid)
This line retrieves the EOD OI data for "CME:ES1!", irrespective of the current chart's symbol:
= openInterestFutures("CME:ES1!")
This example uses `openInterestCrypto()` to retrieve OHLC OI data and the OI rising condition for a cryptocurrency contract on the chart, sampled at the chart's timeframe. It assigns the returned values to five variables in a tuple:
= openInterestCrypto(syminfo.tickerid, timeframe.period)
This call retrieves OI OHLC and rising information for "BINANCE:BTCUSDT.P" on the "1D" timeframe:
= openInterestCrypto("BINANCE:BTCUSDT.P", "1D")
`commitmentOfTraders()`
The `commitmentOfTraders()` function retrieves data from the Commitment of Traders (COT) reports published by the Commodity Futures Trading Commission (CFTC). This function significantly simplifies the COT request process, making it easier for programmers to access and utilize the available data.
How It Works
This function's parameters determine different parts of a valid ticker ID for retrieving COT data, offering a streamlined alternative to constructing complex COT ticker IDs manually. The `metricName`, `metricDirection`, and `includeOptions` parameters are required. They specify the name of the reported metric, the direction, and whether it includes information from options contracts.
The function also includes several optional parameters. The `CFTCCode` parameter allows programmers to request data for a specific report code. If unspecified, the function requests data based on the chart symbol's root prefix, base currency, or quoted currency, depending on the `mode` argument. The call can specify the report type ("Legacy", "Disaggregated", or "Financial") and metric type ("All", "Old", or "Other") with the `typeCOT` and `metricType` parameters.
Explore the CFTC website to find valid report codes for specific assets. To find detailed information about the metrics included in the reports and their meanings, see the CFTC's Explanatory Notes .
View the function's documentation below for detailed explanations of its parameters. For in-depth information about COT ticker IDs and more advanced functionality, refer to our previously published COT library .
Available metrics
Different COT report types provide different metrics . The tables below list all available metrics for each type and their applicable directions:
+------------------------------+------------------------+
| Legacy (COT) Metric Names | Directions |
+------------------------------+------------------------+
| Open Interest | No direction |
| Noncommercial Positions | Long, Short, Spreading |
| Commercial Positions | Long, Short |
| Total Reportable Positions | Long, Short |
| Nonreportable Positions | Long, Short |
| Traders Total | No direction |
| Traders Noncommercial | Long, Short, Spreading |
| Traders Commercial | Long, Short |
| Traders Total Reportable | Long, Short |
| Concentration Gross LT 4 TDR | Long, Short |
| Concentration Gross LT 8 TDR | Long, Short |
| Concentration Net LT 4 TDR | Long, Short |
| Concentration Net LT 8 TDR | Long, Short |
+------------------------------+------------------------+
+-----------------------------------+------------------------+
| Disaggregated (COT2) Metric Names | Directions |
+-----------------------------------+------------------------+
| Open Interest | No Direction |
| Producer Merchant Positions | Long, Short |
| Swap Positions | Long, Short, Spreading |
| Managed Money Positions | Long, Short, Spreading |
| Other Reportable Positions | Long, Short, Spreading |
| Total Reportable Positions | Long, Short |
| Nonreportable Positions | Long, Short |
| Traders Total | No Direction |
| Traders Producer Merchant | Long, Short |
| Traders Swap | Long, Short, Spreading |
| Traders Managed Money | Long, Short, Spreading |
| Traders Other Reportable | Long, Short, Spreading |
| Traders Total Reportable | Long, Short |
| Concentration Gross LE 4 TDR | Long, Short |
| Concentration Gross LE 8 TDR | Long, Short |
| Concentration Net LE 4 TDR | Long, Short |
| Concentration Net LE 8 TDR | Long, Short |
+-----------------------------------+------------------------+
+-------------------------------+------------------------+
| Financial (COT3) Metric Names | Directions |
+-------------------------------+------------------------+
| Open Interest | No Direction |
| Dealer Positions | Long, Short, Spreading |
| Asset Manager Positions | Long, Short, Spreading |
| Leveraged Funds Positions | Long, Short, Spreading |
| Other Reportable Positions | Long, Short, Spreading |
| Total Reportable Positions | Long, Short |
| Nonreportable Positions | Long, Short |
| Traders Total | No Direction |
| Traders Dealer | Long, Short, Spreading |
| Traders Asset Manager | Long, Short, Spreading |
| Traders Leveraged Funds | Long, Short, Spreading |
| Traders Other Reportable | Long, Short, Spreading |
| Traders Total Reportable | Long, Short |
| Concentration Gross LE 4 TDR | Long, Short |
| Concentration Gross LE 8 TDR | Long, Short |
| Concentration Net LE 4 TDR | Long, Short |
| Concentration Net LE 8 TDR | Long, Short |
+-------------------------------+------------------------+
Example usage
This code line retrieves "Noncommercial Positions (Long)" data, without options information, from the "Legacy" report for the chart symbol's root, base currency, or quote currency:
float nonCommercialLong = commitmentOfTraders("Noncommercial Positions", "Long", false)
This example retrieves "Managed Money Positions (Short)" data, with options included, from the "Disaggregated" report:
float disaggregatedData = commitmentOfTraders("Managed Money Positions", "Short", true, "", "Disaggregated")
█ NOTES
• This library uses dynamic requests , allowing dynamic ("series") arguments for the parameters defining the context (ticker ID, timeframe, etc.) of a `request.*()` function call. With this feature, a single `request.*()` call instance can flexibly retrieve data from different feeds across historical executions. Additionally, scripts can use such calls in the local scopes of loops, conditional structures, and even exported library functions, as demonstrated in this script. All scripts coded in Pine Script™ v6 have dynamic requests enabled by default. To learn more about the behaviors and limitations of this feature, see the Dynamic requests section of the Pine Script™ User Manual.
• The library's example code offers a simple demonstration of the exported functions. The script retrieves available data using the function specified by the "Series type" input. The code requests a FRED series or COT (Legacy), FINRA Short Sale Volume, or Open Interest series for the chart's symbol with specific parameters, then plots the retrieved data as a step-line with diamond markers.
Look first. Then leap.
█ EXPORTED FUNCTIONS
This library exports the following functions:
fred(fredCode, gaps)
Requests a value from a specified Federal Reserve Economic Data (FRED) series. FRED is a comprehensive source that hosts numerous U.S. economic datasets. To explore available FRED datasets and codes, search for specific categories or keywords at fred.stlouisfed.org Calls to this function count toward a script's `request.*()` call limit.
Parameters:
fredCode (series string) : The unique identifier of the FRED series. The function uses the value to create a valid ticker ID for retrieving FRED data in the format `"FRED:fredCode"`. For example, `"GDP"` refers to the "Gross Domestic Product" series ("FRED:GDP"), and `"GFDEBTN"` refers to the "Federal Debt: Total Public Debt" series ("FRED:GFDEBTN").
gaps (simple bool) : Optional. If `true`, the function returns a non-na value only when a new value is available from the requested context. If `false`, the function returns the latest retrieved value when new data is unavailable. The default is `false`.
Returns: (float) The value from the requested FRED series.
finraShortSaleVolume(symbol, gaps, repaint)
Requests FINRA daily short sale volume data for a specified symbol from one of the following exchanges: NASDAQ, NYSE, NYSE ARCA. If the chart uses an intraday timeframe, the function requests data from the "1D" timeframe. Otherwise, it uses the chart's timeframe. Calls to this function count toward a script's `request.*()` call limit.
Parameters:
symbol (series string) : The symbol for which to request short sale volume data. If the specified value contains an exchange prefix, it must be one of the following: "NASDAQ", "NYSE", "AMEX", "BATS".
gaps (simple bool) : Optional. If `true`, the function returns a non-na value only when a new value is available from the requested context. If `false`, the function returns the latest retrieved value when new data is unavailable. The default is `false`.
repaint (simple bool) : Optional. If `true` and the chart's timeframe is intraday, the value requested on realtime bars may change its time offset after the script restarts its executions. If `false`, the function returns the last confirmed period's values to avoid repainting. The default is `true`.
Returns: (float) The short sale volume for the specified symbol or the chart's symbol.
openInterestFutures(symbol, gaps, repaint)
Requests EOD open interest (OI) and OI rising information for a valid futures symbol. If the chart uses an intraday timeframe, the function requests data from the "1D" timeframe. Otherwise, it uses the chart's timeframe. Calls to this function count toward a script's `request.*()` call limit.
Parameters:
symbol (series string) : The symbol for which to request open interest data.
gaps (simple bool) : Optional. If `true`, the function returns non-na values only when new values are available from the requested context. If `false`, the function returns the latest retrieved values when new data is unavailable. The default is `false`.
repaint (simple bool) : Optional. If `true` and the chart's timeframe is intraday, the value requested on realtime bars may change its time offset after the script restarts its executions. If `false`, the function returns the last confirmed period's values to avoid repainting. The default is `true`.
Returns: ( ) A tuple containing the following values:
- The closing OI value for the symbol.
- `true` if the closing OI is above the previous period's value, `false` otherwise.
openInterestCrypto(symbol, timeframe, gaps, repaint)
Requests opening, high, low, and closing open interest (OI) data and OI rising information for a valid cryptocurrency contract on a specified timeframe. Calls to this function count toward a script's `request.*()` call limit.
Parameters:
symbol (series string) : The symbol for which to request open interest data.
timeframe (series string) : The timeframe of the data request. If the timeframe is lower than the chart's timeframe, it causes a runtime error.
gaps (simple bool) : Optional. If `true`, the function returns non-na values only when new values are available from the requested context. If `false`, the function returns the latest retrieved values when new data is unavailable. The default is `false`.
repaint (simple bool) : Optional. If `true` and the `timeframe` represents a higher timeframe, the function returns unconfirmed values from the timeframe on realtime bars, which repaint when the script restarts its executions. If `false`, it returns only confirmed higher-timeframe values to avoid repainting. The default is `true`.
Returns: ( ) A tuple containing the following values:
- The opening, high, low, and closing OI values for the symbol, respectively.
- `true` if the closing OI is above the previous period's value, `false` otherwise.
commitmentOfTraders(metricName, metricDirection, includeOptions, CFTCCode, typeCOT, mode, metricType)
Requests Commitment of Traders (COT) data with specified parameters. This function provides a simplified way to access CFTC COT data available on TradingView. Calls to this function count toward a script's `request.*()` call limit. For more advanced tools and detailed information about COT data, see TradingView's LibraryCOT library.
Parameters:
metricName (series string) : One of the valid metric names listed in the library's documentation and source code.
metricDirection (series string) : Metric direction. Possible values are: "Long", "Short", "Spreading", and "No direction". Consult the library's documentation or code to see which direction values apply to the specified metric.
includeOptions (series bool) : If `true`, the COT symbol includes options information. Otherwise, it does not.
CFTCCode (series string) : Optional. The CFTC code for the asset. For example, wheat futures (root "ZW") have the code "001602". If one is not specified, the function will attempt to get a valid code for the chart symbol's root, base currency, or main currency.
typeCOT (series string) : Optional. The type of report to request. Possible values are: "Legacy", "Disaggregated", "Financial". The default is "Legacy".
mode (series string) : Optional. Specifies the information the function extracts from a symbol. Possible modes are:
- "Root": The function extracts the futures symbol's root prefix information (e.g., "ES" for "ESH2020").
- "Base currency": The function extracts the first currency from a currency pair (e.g., "EUR" for "EURUSD").
- "Currency": The function extracts the currency of the symbol's quoted values (e.g., "JPY" for "TSE:9984" or "USDJPY").
- "Auto": The function tries the first three modes (Root -> Base currency -> Currency) until it finds a match.
The default is "Auto". If the specified mode is not available for the symbol, it causes a runtime error.
metricType (series string) : Optional. The metric type. Possible values are: "All", "Old", "Other". The default is "All".
Returns: (float) The specified Commitment of Traders data series. If no data is available, it causes a runtime error.

Bar Statistics - DELTA/OI/TOTAL/BUY/SELL/LONGS/SHORTSBar Statistics - Advanced Volume & Open Interest Analysis
Overview
The Bar Statistics indicator is a comprehensive analytical tool designed to provide traders with detailed insights into market microstructure through advanced volume analysis, open interest tracking, and market flow detection. This indicator transforms complex market data into easily digestible visual information, displaying six key metrics in customizable colored boxes that update in real-time.
Unlike traditional volume indicators that only show basic volume data, this indicator combines multiple data sources to reveal the underlying forces driving price movement, including volume delta calculations from lower timeframes, open interest changes, and estimated market positioning.
What Makes This Indicator Unique
1. Multi-Timeframe Volume Delta Precision
The indicator utilizes lower timeframe data (default 1-second) to calculate highly accurate volume delta measurements, providing much more precise buy/sell pressure analysis than standard timeframe-based calculations. This approach captures intraday volume dynamics that are often missed by conventional indicators.
2. Real-Time Updates
Unlike many indicators that only update on bar completion, this tool provides live updates for the developing candle, allowing traders to see evolving market conditions as they happen.
3. Market Flow Analysis
The unique "L/S" (Long/Short) metric combines open interest changes with price/volume direction to estimate net market positioning, helping identify when participants are accumulating or distributing positions.
4. Adaptive Visual Intensity
The gradient color system automatically adjusts based on historical context, making it easy to identify when current values are significant relative to recent market activity.
5. Complete Customization
Every aspect of the display can be customized, from the order of metrics to individual color schemes, allowing traders to adapt the tool to their specific analysis needs.
6.All In One Solution
6 Metrics in one indicator no more using 5 different indicators.
Core Features Explained
DELTA (Volume Delta)
What it shows: Net difference between aggressive buy volume and aggressive sell volume
Calculation: Uses lower timeframe data to determine whether each trade was initiated by buyers or sellers
Interpretation:
Positive values indicate aggressive buying pressure
Negative values indicate aggressive selling pressure
Magnitude indicates the strength of directional pressure
OI Δ (Open Interest Change)
What it shows: Change in open interest from the previous bar
Data source: Fetches open interest data using the "_OI" symbol suffix
Interpretation:
Positive values indicate new positions entering the market
Negative values indicate positions being closed
Combined with price direction, reveals market participant behavior
L/S (Net Long/Short Bias)
What it shows: Estimated net change in long vs short market positions
Calculation method: Combines open interest changes with price/volume direction using configurable logic
Scenarios analyzed:
New Longs: Rising OI + Rising Price/Volume = Long position accumulation
Liquidated Longs: Falling OI + Falling Price/Volume = Long position exits
New Shorts: Rising OI + Falling Price/Volume = Short position accumulation
Covered Shorts: Falling OI + Rising Price/Volume = Short position exits
Result: Net bias toward long (positive) or short (negative) market sentiment
TOTAL (Total Volume)
What it shows: Standard volume for the current bar
Purpose: Provides context for other metrics and baseline activity measurement
Enhanced display: Uses gradient intensity based on recent volume history
BUY (Estimated Buy Volume)
What it shows: Estimated aggressive buy volume
Calculation: (Total Volume + Delta) / 2
Use case: Helps quantify the actual buying pressure in monetary/contract terms
SELL (Estimated Sell Volume)
What it shows: Estimated aggressive sell volume
Calculation: (Total Volume - Delta) / 2
Use case: Helps quantify the actual selling pressure in monetary/contract terms
Configuration Options
Timeframe Settings
Custom Timeframe Toggle: Enable/disable custom lower timeframe selection
Timeframe Selection: Choose the precision level for volume delta calculations
Auto-Selection Logic: Automatically selects optimal timeframe based on chart timeframe
Net Positions Calculation
Direction Method: Choose between Price-based or Volume Delta-based direction determination
Value Method: Select between Open Interest Change or Volume for position size calculations
Display Customization
Row Order: Completely customize which metrics appear and in what order (6 positions available)
Color Schemes: Individual color selection for positive/negative values of each metric
Gradient Intensity: Configurable lookback period (10-200 bars) for relative intensity calculations
Visual Elements
Box Format: Clean, professional box display with clear labels
Color Coding: Intuitive color schemes with customizable transparency gradients
Real-time Updates: Live updating for developing candles with historical stability
How to Use This Indicator
For Day Traders
Volume Confirmation: Use DELTA to confirm breakout validity - strong directional moves should show corresponding volume delta
Entry Timing: Watch for volume delta divergences at key levels to time entries
Exit Signals: Monitor when aggressive volume shifts against your position
For Swing Traders
Market Flow: Focus on the L/S metric to identify when participants are accumulating or distributing
Open Interest Analysis: Use OI Δ to confirm whether moves are backed by new money or position adjustments
Trend Validation: Combine multiple metrics to validate trend strength and sustainability
For Scalpers
Real-time Edge: Utilize the live updates to see developing imbalances before bar completion
Quick Decision Making: Focus on DELTA and BUY/SELL for immediate market pressure assessment
Volume Profile: Use TOTAL volume context for optimal entry/exit sizing
Setup Recommendations
Futures Markets: Enable OI tracking and use Volume Delta direction method
Crypto Markets: Focus on DELTA and volume metrics; OI may not be available
Stock Markets: Use Price direction method with volume value calculations
High-Frequency Analysis: Set lower timeframe to 1S for maximum precision
Technical Implementation
Data Accuracy
Utilizes TradingView's ta.requestVolumeDelta() function for precise buy/sell classification
Implements error checking for data availability
Handles missing data gracefully with fallback calculations
Performance Optimization
Efficient array management with configurable lookback periods
Smart box creation and deletion to prevent memory issues
Optimized real-time updates without historical data corruption
Compatibility
Works on all timeframes from seconds to daily
Compatible with futures, forex, crypto, and stock markets
Automatically adjusts calculation methods based on available data
Risk Disclaimers
This indicator is designed for educational and analytical purposes. It provides statistical analysis of market data but does not guarantee trading success. Users should:
Combine with other forms of analysis
Practice proper risk management
Understand that past performance doesn't predict future results
Be aware that volume delta and open interest data quality varies by market and data provider
Conclusion
The Bar Statistics indicator represents a significant advancement in retail trader access to professional-grade market analysis tools. By combining multiple data sources into a single, customizable display, it provides the depth of analysis needed for comprehensive market microstructure understanding while maintaining the simplicity required for effective decision-making.

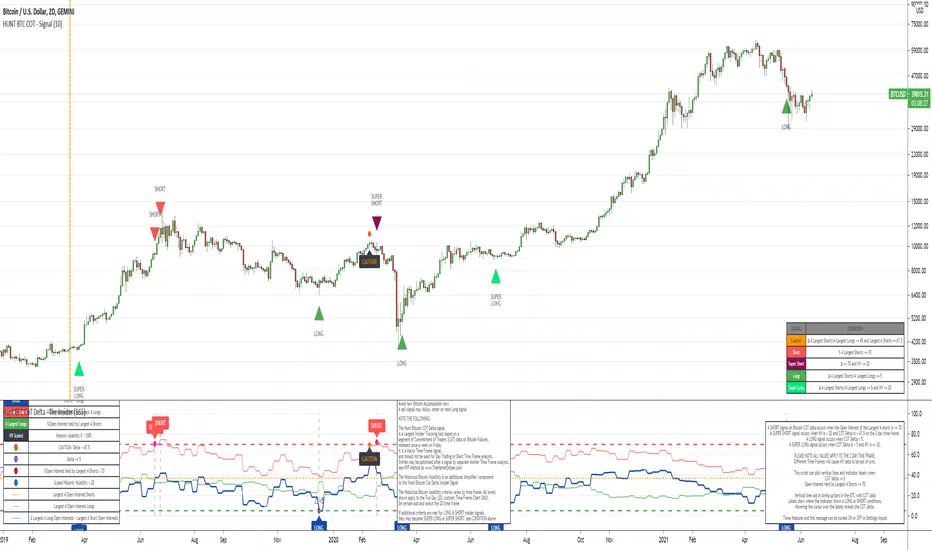
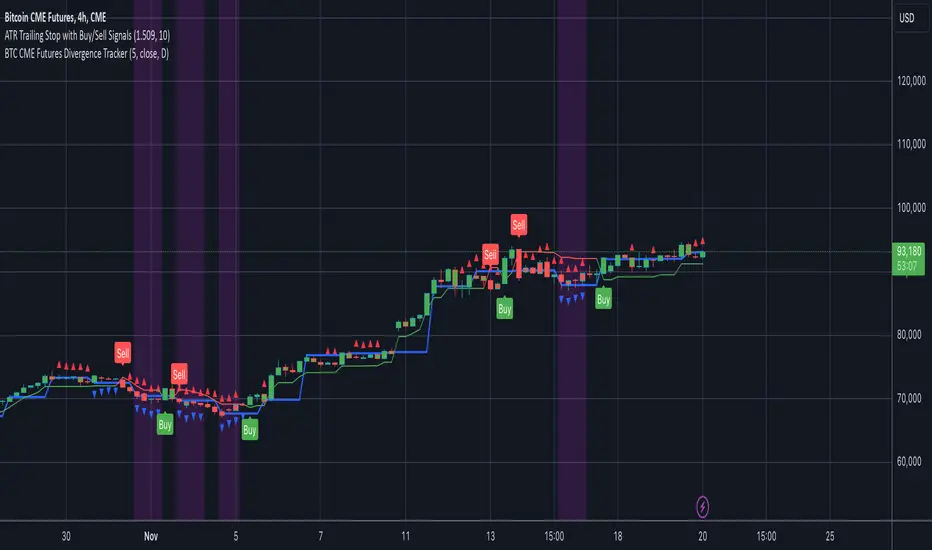
BTC CME Futures Divergence TrackerThis script tracks divergences between price action and open interest for the BTC CME Futures contract (symbol "BTC1!") using the following components:
Key Features:
1. Price Analysis: Identifies lower highs in the price over a specified lookback period. Marks these points with red upward-facing triangles above the bars.
2. Open Interest Analysis: Retrieves open interest (OI) data for the BTC CME Futures contract via request.security. Detects lower highs in open interest over the same lookback period. Highlights these points with blue downward-facing triangles below the bars.
3. Divergence Detection: A divergence is identified when both price and open interest form lower highs simultaneously. Highlights such occurrences with a purple background, indicating potential bearish sentiment or weakening momentum.
4. Alerts: If divergences are detected, an alert is triggered (if enabled), notifying the trader to take action.
5. Visualization: Open interest is plotted as a blue line in a separate pane for added context. Red and blue markers highlight significant points in price and open interest trends.
Use Cases:
- Spot Weakening Trends: Divergences between price and open interest may indicate a loss of momentum or bearish sentiment, allowing traders to preemptively adjust their strategies.
- Monitor Institutional Activity: Open interest changes reflect shifts in market participation, especially in derivative markets like CME Futures.
- Set Alerts for Key Signals: With automated alerts, traders can stay informed of potential divergence signals without constant monitoring.
Customization Options:
- Lookback Period: Adjust the number of bars used to detect lower highs.
- Timeframe: Choose the timeframe for fetching open interest data (e.g., daily, hourly).
- Alert Activation: Enable or disable alerts for divergences.
This tool combines price action with open interest dynamics to provide a robust method for identifying market trends and potential reversals in BTC CME Futures.
Long / Short OI Build Up ntroduction
The "Long / Short OI Build Up" script is designed to identify potential long or short build-up opportunities based on changes in open interest (OI) and price movements. Open interest refers to the total number of outstanding contracts for a financial asset, such as futures or options, that have not been settled. This script provides insights into whether there is a build-up of long positions (bullish sentiment) or short positions (bearish sentiment) in the market.
Script Overview
Indicator Overlay: This script functions as an overlay indicator, meaning it plots its output on the price chart.
Input Customization: Users can customize the symbol for which they want to analyze open interest data. Additionally, they can adjust parameters like the percentage change in open interest and price to define build-up conditions.
Dashboard Display: The script includes a dashboard feature that displays the build-up analysis at a chosen location on the chart.
Build-Up Analysis: Based on the defined criteria, the script identifies whether there is a long build-up (bullish) or short build-up (bearish) scenario. It calculates the change in open interest and price and compares them against user-defined thresholds.
Table Visualization: The results of the analysis are presented in a table format, showing the build-up type, percentage change in open interest, and percentage change in price.
Usage
Override Symbol: Users can choose to override the default symbol for analysis by selecting this option and entering the desired symbol.
Price Change Percentage: Set the percentage change in price that should trigger a build-up signal.
OI Change Percentage: Define the percentage change in open interest necessary to signal a build-up scenario.
Dashboard Location: Choose the location on the chart where the build-up analysis table will be displayed (options include Top Right, Bottom Right, and Bottom Left).
Interpretation
Build Up: Indicates whether there is a long build-up (green) or short build-up (red) based on the defined criteria.
OI Change: Shows the percentage change in open interest relative to the previous value. Positive values are highlighted in green, indicating an increase, while negative values are highlighted in red, indicating a decrease.
Price Change: Displays the percentage change in price relative to the previous close. Positive values are highlighted in green for price increase, while negative values are highlighted in red for price decrease.
Conclusion
The "Long / Short OI Build Up" script provides traders with valuable insights into potential bullish or bearish build-up scenarios based on changes in open interest and price movements. By customizing parameters and visualizing the analysis on a chart dashboard, traders can make more informed decisions regarding their trading strategies.

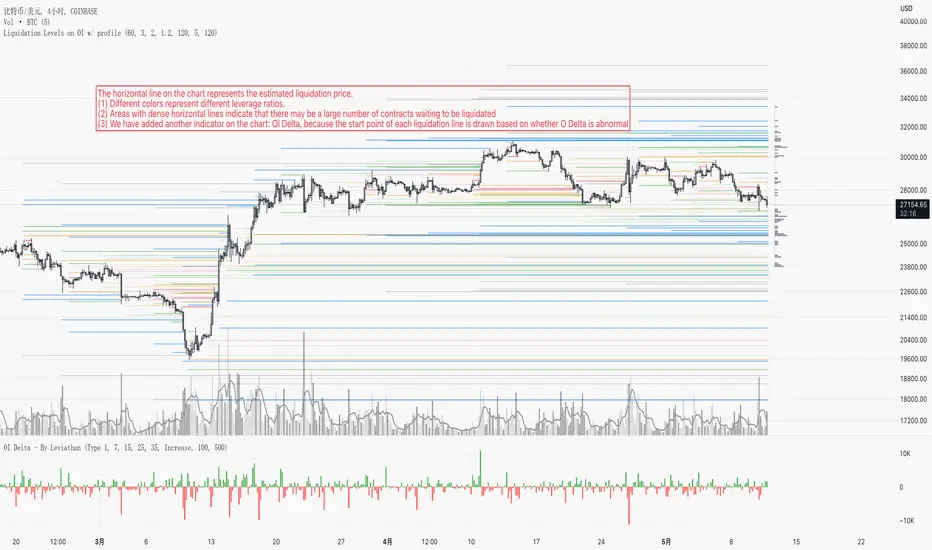
Liquidation Levels on OIThis indicator is used to display estimated contract liquidation prices. When there are dense liquidation areas on the chart, it indicates that there may be a lot of liquidity at that price level. The horizontal lines of different colors on the chart represent different leverage ratios. See below for details.
Let me introduce the principle behind this indicator:
1. When position trading volume increases or decreases significantly higher than usual levels in a specific candlestick chart, it indicates that a large number of contracts were opened during that period. We use the 60-day moving average change as a benchmark line. If the position trading volume changes more than 1.2x, 2x or 3x its MA60 value, it is considered small, medium or large abnormal increase or decrease.
2. This indicator takes an approximate average between high, open, low and close prices of that candlestick as opening price.
3. Since contracts involve liquidity provided by both buyers and sellers with equal amounts of long and short positions corresponding to each contract respectively; since we cannot determine actual settlement prices for contract positions; therefore this indicator estimates settlement prices instead which marks five times (5x), ten times (10x), twenty-five times (25x), fifty times (50x) and one hundred times (100x) long/short settlement prices corresponding to each candlestick chart generating liquidation lines with different colors representing different leverage levels.
4. We can view areas where dense liquidation lines appear as potential liquidation zones which will have high liquidity.
5. We can adjust orders based on predicted liquidation areas because most patterns in these areas will be quickly broken.
6. We provide a density histogram to display the liquidation density of each price range.
Special thanks to the following TradingView community members for providing open-source indicators and contributing to the development of this indicator!
Liquidation - @Mysterysauce
Open Interest Delta - By Leviathan - @LeviathanCapital
Regarding the relationship with the above-mentioned open source indicators:
1. Indicator Liquidation - @Mysterysauce can also draw a liquidation line in the chart, but:
(1) Our indicator generates a liquidation line based on abnormal changes in open interest; their indicator generates a liquidation line based on trading volume.
(2) Our indicator will generate both long and short liquidation lines at the same time; their indicator will only generate a liquidation line in a single direction.
We refer to their method of drawing liquidation lines when drawing our own.
2. Indicator Open Interest Delta - By Leviathan - @LeviathanCapital obtained OI data for Binance USDT perpetual contracts in the code. We refer to their method of obtaining OI data in our code.
============= 中文版本 =============
此指标用于显示估计合约清算价格。当图表上有密集的清算区域时,表示该价格水平可能存在大量流动性。图表上不同颜色的水平线代表不同杠杆比率。详情请参见下面的说明。
让我介绍一下这个指标背后的原理:
1. 当特定蜡烛图对应的合约仓位增加量(OI Delta)显著高于通常水平时,表示在那段时间有大量合约开仓。我们使用OI Delta的60日移动均线作为基准线。如果OI Delta超过其MA60值的1.2倍、2倍或3倍,则认为是小型、中型或大型的异常OI Delta。
2. 该指标将上述蜡烛图高、开、低和收盘价的平均值作为近似的合约开仓价。
3. 由于合约涉及买方和卖方之间相互提供流动性,每个合约对应相等数量的多头和空头头寸。由于我们无法确定合约头寸的实际清算价格,因此该指标估计了清算价格。它标记了与该蜡烛图相对应的多头和空头5倍、10倍、25倍、50倍和100倍的清算价格,生成清算线。不同杠杆水平用不同颜色表示。
4. 我们可以将出现密集清算线的区域视为潜在的清算区域。这些区域将具有高流动性。
5. 我们可以根据预测到的清算区域调整自己的订单,因为根据规律,这些清算区域大部分都会很快被击穿。
6. 我们提供了密度直方图来显示每个价格范围的清算密度
特别感谢以下TradingView社区成员提供开源指标并为该指标的开发做出贡献!
Liquidation - @Mysterysauce
Open Interest Delta - By Leviathan - @LeviathanCapital
与上述开源指标的关系:
1. 指标Liquidation - @Mysterysauce也可以在图中绘制清算线,但是:
(1)我们的指标是基于open interest的异常变化生成的清算线;他们的指标是基于成交量生成的清算线
(2)我们的指标会同时生成多头和空头清算线;他们的指标仅会在单一方向生成清算线
我们的指标在绘制清算线上参考了他们绘制清算线的方式
2. 指标Open Interest Delta - By Leviathan - @LeviathanCapital在代码中获取了Binance USDT永续合约的OI数据。我们在代码中参考他们获取OI数据的方式
Net Positions (Net Longs & Net Shorts) - By LeviathanThis script is an experimental indicator that visualizes the entering and exiting of long and short positions in the market. It also includes other useful tools, such as NL/NS Profile, NL/NS Delta, NL/NS Ratio, Volume Heatmap, Divergence finder, Relative Strength Index of Net Longs and Net Shorts, EMAs and VWMAs and more.
To avoid misinterpretation, it's important to understand some basics. The “real” ratio between net long and net short positions in a given market is always 1:1. A futures contract is an agreement between two parties to buy or sell an underlying asset at an agreed-upon price. Each contract has a long side and a short side, with one party agreeing to buy (long) and the other party agreeing to sell (short) the asset at the agreed-upon price. The long position holder anticipates that the asset's price will rise, while the short position holder expects it to fall. Because every futures contract involves both a buyer and a seller, it is impossible to have more net longs than net shorts or vice versa (in terms of the net value). For every long position opened, there must be a corresponding short position taken by another market participant (and vice versa), thus maintaining the 1:1 ratio between longs and shorts. While there can be an imbalance in the number of traders/accounts holding long and short contracts, the net value of positions held on each side remains 1 to 1.
Open Interest (OI) is a metric that tracks the number of open (unsettled) contracts in a given market. For example, Open Interest of 100 BTC means that there are currently 100 BTC worth of longs and 100 BTC worth of shorts open in the market. There may be more traders on one side holding smaller positions, and fewer traders on the other side holding larger positions, but the net value of positions on one side is equal to the net value of positions on the other side → 100 BTC in longs and 100 BTC in shorts (1:1). Consider a scenario in which a trader decides to open a long position for 1 BTC at a price of HKEX:30 ,000. For this long order to be executed, a counterparty must take the opposite side of the contract by placing an order to short 1 BTC at the same price of HKEX:30 ,000. When both the long and short orders are matched and executed, the open interest increases by 1 BTC, reflecting the addition of this new contract to the market.
Changes in Open Interest essentially tell us 3 things:
- OI Increase - new positions entered the market (both longs and shorts!)
- OI Decrease - positions exited the market (both longs and shorts!)
- OI Flat - no change in open positions due to low activity or simply lots of transfers of contracts
However, different concepts can be used to analyze sentiment, aggressiveness, and activity in the market by analyzing data such as Open Interest, price, volume, etc. This indicator combines Open Interest data and price action to simplify the visualization of positions entering and exiting the market. It is based on the following concept:
Increase in Open Interest + Increase in price = Longs Opening
Decrease in Open Interest + Decrease in price = Longs Closing
Increase in Open Interest + Decrease in price = Shorts Opening
Decrease in Open Interest + Increase in price = Shorts Closing
When "Longs Opening" occurs, the OI Delta value is added to the running total of Net Longs, and when "Longs Closing" occurs, the OI Delta value is subtracted from the running total of Net Longs.
When "Shorts Opening" occurs, the OI Delta value is added to the running total of Net Shorts, and when "Shorts Closing" occurs, the OI Delta value is subtracted from the running total of Net Shorts.
To summarize:
Net Longs: Cumulative value of Longs Opening and Longs Closing (LO - LC)
Net Shorts: Cumulative value of Shorts Opening and Shorts Closing (SO - SC)
Net Delta: Net Longs - Net Shorts
Net Ratio: Net Longs / Net Shorts
This is the fundamental logic of how this script functions, but it also includes several other tools and options. Here is an overview of the settings:
Type:
- Net Positions (display values of Net Longs, Net Shorts, Net Delta, Net Ratio as described above)
- Relative Strength (display Net Longs, Net Shorts, Net Delta, Net Ratio in the form of a momentum oscillator that measures the speed and change of movements. Same logic as RSI for price)
Display as:
- Candles (display the data in the form of candlesticks)
- Lines (display the data in the form of candlesticks)
- Columns (display the data in the form of columns)
Cumulation:
- Visible Range (data is cumulated from the first visible bar on your chart)
- Full Data (data is cumulated from the beginning)
Quoted in:
- Base Currency (all data is presented in the pair’s base currency eg. BTC)
- Quote Currency (all data is presented in the pair’s quote currency eg USDT)
OI Sources
- Pick the sources from where the data is collected (if available).
Net Positions:
- NET LONGS (show/hide Net Longs plot, choose candle colors, choose line color)
- NET SHORTS (show/hide Net Shorts plot, choose candle colors, choose line color)
- NET DELTA (show/hide Net Delta plot, choose candle colors, choose line color)
- NET RATIO (show/hide Net Ratio plot, choose candle colors, choose line color)
Moving Averages:
- Type (choose between EMA and Volume Weighted Moving Average)
- NET LONGS (show/hide NL moving average plot, choose length, choose color)
- NET SHORTS (show/hide NS moving average plot, choose length, choose color)
- NET DELTA (show/hide ND moving average plot, choose length, choose color)
- NET RATIO (show/hide NR moving average plot, choose length, choose color)
Profile:
- Profile Data (choose the source data of the profile)
- Value Area % (set the percentage width of profile’s value area)
- Positions (set the position of the profile to left or right of the visible range)
- Node Size (set the relative size of nodes to make them appear smaller or larger)
- Rows (select the amount of rows displayed by the profile to control granularity)
- POC (show/hide POC- Point Of Control and select its color)
- VA (show/hide VA- Value Area and select its color)
Divergence finder
- Source (choose the source data used by the script to compare it with price pivot points)
- Maximum distance (the maximum distance between two divergent pivot points)
- Lookback Bars Left (the number of bars to the left of the current bar that the function will consider when looking for a pivot point)
- Lookback Bars Right (the number of bars to the right of the current bar that the function will consider when looking for a pivot point)
Stats:
- Show/Hide the Stats table
- Bars Back (choose the length of data analyzed for stats in number of bars)
- Position (choose the position of the Stats table)
- Select Data you want to display in the Stats table
Additional Settings:
- Volume Heatmap (show/hide volume heatmap and select its color)
- Label Offset (select how much the plot label is shifted to the right
- Position Relative Strength Length (select the length used in the calculation)
- Value Label (show/hide OI Delta values when candles are displayed)
- Plot Labels (show/hide the labels next to the plot)
- Wicks (show/hide wick when candles are displayed)
Code used for generating profiles is taken from @KioseffTrading's "Profile Any Indicator" script (used with author's permission)

Herrick Payoff Index for Quandl DataUpdate to my previous Herrick Payoff Index script. This script pulls Quandl futures data with daily open interest. The prior version only used the weekly Commitment of Traders open interest data so could only be used on weekly bars. Note: Must use Quandl Symbol methodology in chart (i.e. enter symbol as QUANDL:CHRIS/CME_FC2, QUANDL:CME/FCX2016, ect.). Unfortunately, I haven't been able to program this to pull from the embedded futures data.
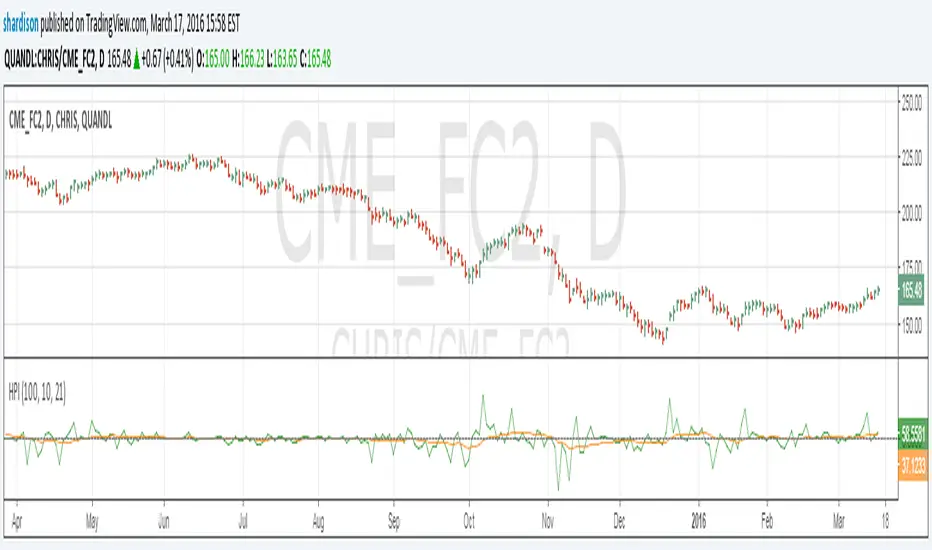
Herrick Payoff IndexThe Herrick Payoff Index is designed to show the amount of money flowing into or out of a futures contract. The Index uses open interest during its calculations, therefore, the security being analyzed must contain open interest.
The Herrick Payoff Index was developed by John Herrick.When the Herrick Payoff Index is above zero, it shows that money is flowing into the futures contract (which is bullish). When the Index is below zero, it shows that money is flowing out of the futures contract (which is bearish).
The interpretation of the Herrick Payoff Index involves looking for divergences between the Index and prices.

nOI + Funding + CVD • strategynOI + Funding + CVD Strategy
Overview
This strategy is designed for cryptocurrency trading on platforms like TradingView, focusing on perpetual futures markets. It combines three key indicators—Normalized Open Interest (nOI), Funding Rate, and Cumulative Volume Delta (CVD)—to generate buy and sell signals for long and short positions. The strategy aims to capitalize on market imbalances, such as overextended open interest, funding rate extremes, and volume deltas, which often signal potential reversals or continuations in trending markets.
The script supports pyramiding (up to 10 positions), uses percentage-based position sizing (default 10% of equity per trade), and allows customization of trade directions (longs and shorts can be enabled/disabled independently). It includes multiple signal systems for entries, various exit mechanisms (including stop-loss, take-profit, time-based exits, and conditional closes based on indicators), a Martingale add-on system for averaging positions during drawdowns, and handling of opposite signals (ignore, close, or reverse).
This strategy is not financial advice; backtest thoroughly and use at your own risk. It requires data sources for Open Interest (OI) and Funding Rates, which are fetched via TradingView's security functions (e.g., from Binance for funding premiums).
Key Indicators
1. Normalized Open Interest (nOI)
Group: Open Interest
Purpose: Measures the relative level of open interest over a lookback window to identify overbought (high OI) or oversold (low OI) conditions, which can indicate potential exhaustion in trends.
Calculation:
Fetches OI data (close) from the symbol's standard ticker (e.g., "{symbol}_OI").
Normalizes OI within a user-defined window (default: 500 bars) using min-max scaling: (OI - min_OI) / (max_OI - min_OI) * 100.
Upper threshold (default: 70%): Signals potential short opportunities when crossed from above.
Lower threshold (default: 30%): Signals potential long opportunities when crossed from below.
Visualization: Plotted as a line (teal above upper, red below lower, gray in between). Horizontal lines at upper, mid (50%), lower, and a separator at 102%.
Notes: Handles non-crypto symbols by adjusting timeframe to daily if intraday. Errors if no OI data available.
2. Funding Rate
Group: Funding Rate
Purpose: Tracks the average funding rate (premium index) to detect market sentiment extremes. Positive funding suggests bull bias (longs pay shorts), negative suggests bear bias.
Calculation:
Fetches premium index data from Binance (e.g., "binance:{base}usdt_premium").
Supports lower timeframe aggregation (default: enabled, using 1-min TF) for smoother data.
Averages open and close premiums, clamps values, and scales/shifts for plotting (base: 150, scale: 1000x).
Upper threshold (default: 1.0%): Overheat for shorts.
Lower threshold (default: 1.0%): Overcool for longs.
Ultra level (default: 1.8%): Extreme for additional short signals.
Smoothing: Uses inverse weighted moving average (IWMA) or lower-TF aggregation to reduce noise.
Visualization: Shifted plot (green positive, red negative) with filled areas. Horizontal lines for overheat, overcool, base (0%), and ultra.
Notes: Custom ticker option for non-standard symbols.
3. Cumulative Volume Delta (CVD)
Group: CVD (Cumulative Volume Delta)
Purpose: Measures net buying/selling pressure via volume delta, normalized to identify divergences or confirmations with price.
Calculation:
Delta: +volume if close > open, -volume if close < open.
Cumulative: Rolling cumsum over a window (default: 500 bars), smoothed with EMA (default: 20).
Normalized: Scaled by absolute max in window (-1 to 1 range).
Scaled/shifted for plotting (base: 300 or 0 if anchored, scale: 120x).
Upper threshold (default: 1.0%): Over for shorts.
Lower threshold (default: 1.0%): Under for longs.
Visualization: Shifted plot (aqua positive, purple negative) with filled areas. Horizontal lines for over, under, and separator (default: 252).
Filter Options (for Signal A):
Enable filter (default: false).
Require sign match (Long ≥0, Short ≤0).
Require extreme zones.
Require momentum (rising/falling over N bars, default: 3).
Signal Logics for Entries
Entries are triggered by buy/sell signals from multiple systems (A, B, C, D), filtered by direction toggles and entry conditions.
Signal System A: OI + Funding (with optional CVD filter)
Enabled: Default true.
Sell (Short): nOI > upper threshold, falling over N bars (default: 3), delta ≥ threshold (default: 3%), funding > overheat, and CVD filter OK.
Buy (Long): nOI < lower threshold, rising over N bars (default: 3), delta ≥ threshold (default: 3%), funding < overcool, and CVD filter OK.
Signal System B: Short - Funding Crossunder + Filters
Enabled: Default true.
Sell (Short): Funding crosses under overheat level, optional: CVD > over, nOI < upper.
Signal System C: Short - Ultra Funding
Enabled: Default false.
Sell (Short): Funding crosses ultra level (up or down, both default true).
Signal System D: Long - Funding Crossover + Filters
Enabled: Default true.
Buy (Long): Funding crosses over overcool level, optional: CVD < under, nOI > lower.
Combined: Sell if A/B/C active; Buy if A/D active.
Entry Filters
Cooldown: Optional pause between entries (default: false, 3 bars).
Max Entries: Limit pyramiding (default: true, 6 max).
Entries only if both filters pass and direction allowed.
Opposite Signal Handling
Mode: Ignore (default), Reverse (close and enter opposite), or Close (exit only).
Processed before regular entries.
Position Management
Martingale (3 Steps):
Enabled per step (default: all true).
Triggers add-ons at loss levels (defaults: 5%, 8%, 11%) by adding % to position (default: 100% each).
Resets on position close.
Break Even:
Enabled (default: true).
Activates at profit threshold (default: 5%), sets SL better by offset (default: 0.1%).
Exit Systems
Multiple exits checked in sequence.
Exit 1: SL/TP
Enabled: Separate for long/short (default: true).
SL: % from avg price (defaults: 1% long/short).
TP: % from avg price (defaults: 2% long/short).
Exit 2: Funding
Enabled: Separate for long (up) / short (down) (default: true).
Long Exit: Funding > upper exit threshold (default: 0.8%).
Short Exit: Funding < lower exit threshold (default: 0.8%).
Exit 3: nOI
Enabled: Separate for long (up) / short (down) (default: true).
Long Exit: nOI > upper exit (default: 85%).
Short Exit: nOI < lower exit (default: 15%).
Exit 4: Global SL
Enabled: Default true.
Exit: If position loss ≥ % (default: 7%).
Exit 5: Break Even (integrated in position block)
Exit 6: Time Limit
Enabled: Separate for long/short (default: true).
Exit: After N bars in trade (defaults: 30 each).
Timer updates on add-ons if enabled (default: true).
Visual Elements
Buy/Sell Labels: Small labels ("BUY"/"SELL") on bars with signals, limited to last 30.
All indicators plotted on a separate pane (overlay=false).
Usage Notes
Backtesting: Adjust parameters based on asset/timeframe. Test on historical data.
Data Requirements: Works best on crypto perps with OI and funding data.
Risk Management: Incorporates SL/TP and global SL; monitor drawdowns with Martingale.
Customization: All thresholds, enables, and scales are inputs for fine-tuning.
Version: Pine Script v6.
For questions or improvements, contact the author. Happy trading!

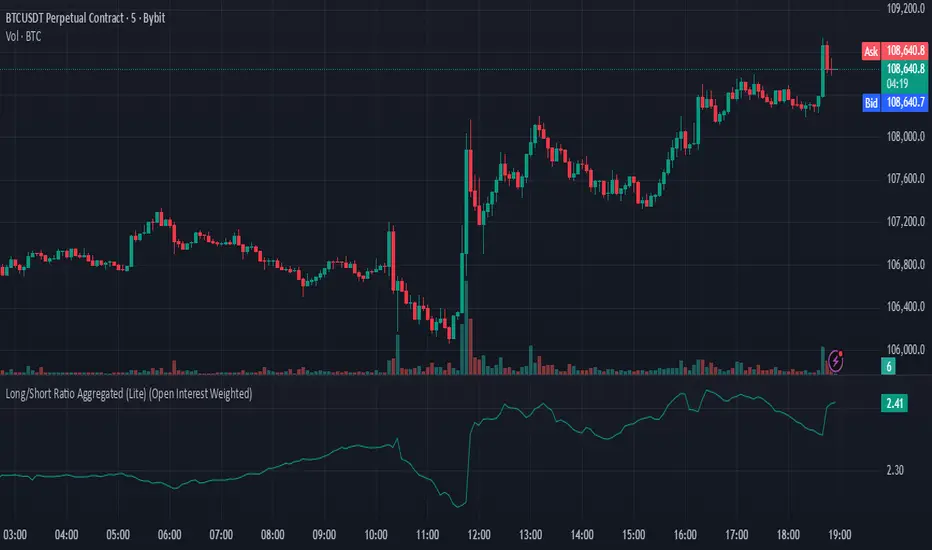
Long/Short Ratio Aggregated (Lite)Description — Long/Short Ratio Aggregated (Lite)
This indicator provides a cross-exchange, open-interest-weighted aggregation of the Long/Short Ratio (LSR) for the cryptocurrency asset currently on your chart. It is designed to unify fragmented derivatives positioning data from multiple major exchanges into a single normalized signal that more accurately reflects real market sentiment and positioning bias across platforms.
Concept and Originality
Traditional Long/Short Ratio indicators are exchange-specific. They show how many traders are long versus short, but only within the scope of one venue (e.g., Binance or Bybit). This makes them incomplete and often misleading for directional bias analysis, since different exchanges host different participant profiles, levels of leverage, and quote-currency exposures.
This script addresses that limitation by:
Aggregating LSR data across multiple exchanges (Binance and Bybit).
Weighting each ratio by Open Interest (OI) — ensuring exchanges with higher open positions contribute proportionally more to the overall sentiment.
Normalizing all contract types (USDT, USDC, and USD-margined) into a consistent base-currency format.
This step corrects for structural differences between coin- and stablecoin-margined instruments, producing a true like-for-like comparison.
The result is a globalized Long/Short Ratio, normalized by exposure and liquidity, suitable for multi-venue orderflow estimation and directional bias assessment.
Note for moderators: I know there are already other scripts out there, but they may not support Open Interest Weighting or the same number of pairs. They also might not support proper normalization like in my script.
Calculation Methodology
For each supported exchange and contract type:
The script retrieves the latest Long/Short Ratio (LSR) and Open Interest (OI) values.
OI is used as the weighting factor, creating a proportional representation of positioning volume.
Values denominated in USD are normalized into base currency using close-price adjustment.
The final value is computed as:
Weighted LSR = (Σ (LSRᵢ × OIᵢ)) / (Σ OIᵢ)
This ensures that if, for example, Binance has twice the open interest of Bybit, its LSR contributes twice as much to the total weighted sentiment.
Interpretation
Value > 1.0 → Market participants are net-long (bullish bias).
Value < 1.0 → Market participants are net-short (bearish bias).
Strength of deviation from 1.0 indicates positioning imbalance magnitude.
Because the ratio is OI-weighted, large players or heavily margined exchanges influence the output proportionally more than smaller, low-volume venues — making this metric a better reflection of true market positioning rather than isolated retail sentiment.
Usage and Applications
Use this indicator as a component in:
Orderflow and sentiment confirmation, alongside price action and volume.
Funding rate correlation studies.
Intraday reversals or exhaustion zones, when combined with volatility or OI delta metrics.
Overlaying or combining this indicator with open interest change, cumulative volume delta, or funding rate divergence allows traders to build a high-resolution understanding of positioning shifts and crowd behavior.
Notes
The “Lite” version is optimized for execution and accessibility, focusing on accuracy while staying within Pine Script’s computational limits.
Exchange data availability may vary by symbol; unsupported pairs automatically return na and are automatically not included in the weighted calculation.
In summary:
This indicator transforms fragmented, exchange-specific Long/Short Ratio into a unified, OI-weighted global sentiment measure — a foundational tool for traders seeking to quantify derivative-side orderflow bias with cross-venue accuracy.
Options Max Pain Calculator [BackQuant]Options Max Pain Calculator
A visualization tool that models option expiry dynamics by calculating "max pain" levels, displaying synthetic open interest curves, gamma exposure profiles, and pin-risk zones to help identify where market makers have the least payout exposure.
What is Max Pain?
Max Pain is the theoretical expiration price where the total dollar value of outstanding options would be minimized. At this price level, option holders collectively experience maximum losses while option writers (typically market makers) have minimal payout obligations. This creates a natural gravitational pull as expiration approaches.
Core Features
Visual Analysis Components:
Max Pain Line: Horizontal line showing the calculated minimum pain level
Strike Level Grid: Major support and resistance levels at key option strikes
Pin Zone: Highlighted area around max pain where price may gravitate
Pain Heatmap: Color-coded visualization showing pain distribution across prices
Gamma Exposure Profile: Bar chart displaying net gamma at each strike level
Real-time Dashboard: Summary statistics and risk metrics
Synthetic Market Modeling**
Since Pine Script cannot access live options data, the indicator creates realistic synthetic open interest distributions based on configurable market parameters including volume patterns, put/call ratios, and market maker positioning.
How It Works
Strike Generation:
The tool creates a grid of option strikes centered around the current price. You can control the range, density, and whether strikes snap to realistic market increments.
Open Interest Modeling:
Using your inputs for average volume, put/call ratios, and market maker behavior, the indicator generates synthetic open interest that mirrors real market dynamics:
Higher volume at-the-money with decay as strikes move further out
Adjustable put/call bias to reflect current market sentiment
Market maker inventory effects and typical short-gamma positioning
Weekly options boost for near-term expirations
Pain Calculation:
For each potential expiry price, the tool calculates total option payouts:
Call options contribute pain when finishing in-the-money
Put options contribute pain when finishing in-the-money
The strike with minimum total pain becomes the Max Pain level
Gamma Analysis:
Net gamma exposure is calculated at each strike using standard option pricing models, showing where hedging flows may be most intense. Positive gamma creates price support while negative gamma can amplify moves.
Key Settings
Basic Configuration:
Number of Strikes: Controls grid density (recommended: 15-25)
Days to Expiration: Time until option expiry
Strike Range: Price range around current level (recommended: 8-15%)
Strike Increment: Spacing between strikes
Market Parameters:
Average Daily Volume: Baseline for synthetic open interest
Put/Call Volume Ratio: Market sentiment bias (>1.0 = bearish, <1.0 = bullish) It does not work if set to 1.0
Implied Volatility: Current option volatility estimate
Market Maker Factors: Dealer positioning and hedging intensity
Display Options:
Model Complexity: Simple (line only), Standard (+ zones), Advanced (+ heatmap/gamma)
Visual Elements: Toggle individual components on/off
Theme: Dark/Light mode
Update Frequency: Real-time or daily calculation
Reading the Display
Dashboard Table (Top Right):
Current Price vs Max Pain Level
Distance to Pain: Percentage gap (smaller = higher pin risk)
Pin Risk Assessment: HIGH/MEDIUM/LOW based on proximity and time
Days to Expiry and Strike Count
Model complexity level
Visual Elements:
Red Line: Max Pain level where payout is minimized
Colored Zone: Pin risk area around max pain
Dotted Lines: Major strike levels (green = support, orange = resistance)
Color Bar: Pain heatmap (blue = high pain, red = low pain/max pain zones)
Horizontal Bars: Gamma exposure (green = positive, red = negative)
Yellow Dotted Line: Gamma flip level where hedging behavior changes
Trading Applications
Expiration Pinning:
When price is near max pain with limited time remaining, there's increased probability of gravitating toward that level as market makers hedge their positions.
Support and Resistance:
High open interest strikes often act as magnets, with max pain representing the strongest gravitational pull.
Volatility Expectations:
Above gamma flip: Expect dampened volatility (long gamma environment)
Below gamma flip: Expect amplified moves (short gamma environment)
Risk Assessment:
The pin risk indicator helps gauge likelihood of price manipulation near expiry, with HIGH risk suggesting potential range-bound action.
Best Practices
Setup Recommendations
Start with Model Complexity set to "Standard"
Use realistic strike ranges (8-12% for most assets)
Set put/call ratio based on current market sentiment
Adjust implied volatility to match current levels
Interpretation Guidelines:
Small distance to pain + short time = high pin probability
Large gamma bars indicate key hedging levels to monitor
Heatmap intensity shows strength of pain concentration
Multiple nearby strikes can create wider pin zones
Update Strategy:
Use "Daily" updates for cleaner visuals during trading hours
Switch to "Every Bar" for real-time analysis near expiration
Monitor changes in max pain level as new options activity emerges
Important Disclaimers
This is a modeling tool using synthetic data, not live market information. While the calculations are mathematically sound and the modeling realistic, actual market dynamics involve numerous factors not captured in any single indicator.
Max pain represents theoretical minimum payout levels and suggests where natural market forces may create gravitational pull, but it does not guarantee price movement or predict exact expiration levels. Market gaps, news events, and changing volatility can override these dynamics.
Use this tool as additional context for your analysis, not as a standalone trading signal. The synthetic nature of the data makes it most valuable for understanding market structure and potential zones of interest rather than precise price prediction.
Technical Notes
The indicator uses established option pricing principles with simplified implementations optimized for Pine Script performance. Gamma calculations use standard financial models while pain calculations follow the industry-standard definition of minimized option payouts.
All visual elements use fixed positioning to prevent movement when scrolling charts, and the tool includes performance optimizations to handle real-time calculation without timeout errors.

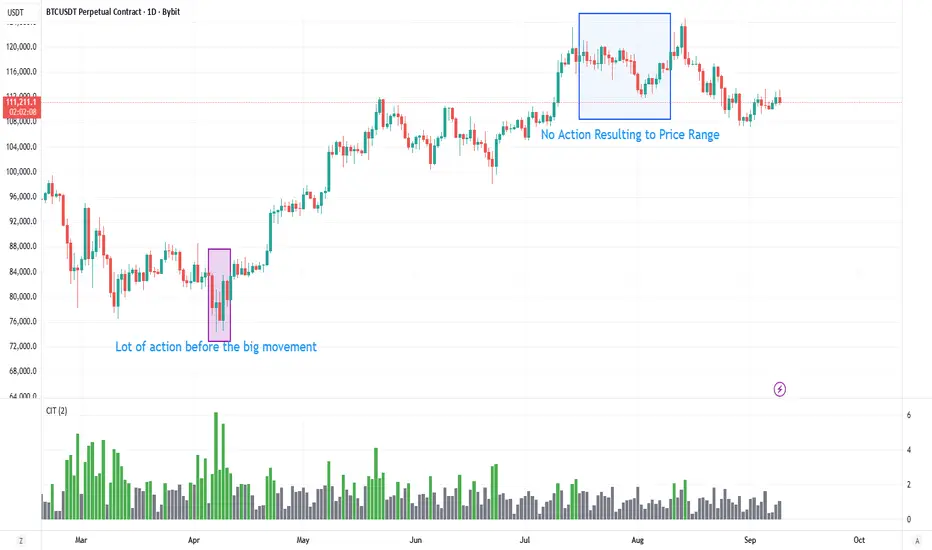
Contract Interest Turnover T3 [T69]Overview
--------
Contract Interest Turnover (CIT) estimates how “churny” a crypto derivatives market is by comparing the amount traded in a bar to the base stock of outstanding contracts (open interest). It normalizes both Volume and Open Interest (OI) by Price (Close), then plots a Turnover Rate = (Volume/Close) ÷ (OI/Close) as colored columns. Higher values = faster contract recycling (strong momentum / hype potential).
Features
--------
- Auto-fetch OI: Pulls OI via request.security(_OI, …) when the exchange/symbol exposes an OI stream on TradingView.
- Price-normalized comparison: Converts both Volume and OI into comparable notional terms by dividing each by Close.
- Turnover columns with threshold: Color the columns green once Turnover ≥ your set threshold; gray otherwise.
- Status-line readouts: Displays normalized Volume and OI values for quick sanity checks.
- Crypto-aware timeframe: Uses chart TF for crypto; forces daily OI when not crypto to avoid noisy intraday pulls.
How to Use
----------
1. Add the script on a perpetual/futures symbol that has OI on TradingView (e.g., BTC perps where an _OI feed exists).
2. Watch the Turnover Rate bars: spikes above your threshold flag sessions where contracts are actively flipping.
3. Interpret spikes as a signal of movement or activity — it does not specify price direction, only that the market is engaged and contracts are being traded more intensely than usual.
Configuration
-------------
- Interest Turnover Threshold (default 1.0): colors columns green when Turnover ≥ threshold. Tune per market’s typical churn profile.
Under the Hood (Formulas & Logic)
---------------------------------
- Fetch OI
oiClose ← request.security(ticker.standard(syminfo.tickerid) + "_OI", timeframe, close) with ignore_invalid_symbol = true.
If none is found, the script throws a clear runtime error.
- Normalize to price
vol_norm = volume / close
oi_norm = oiClose / close
This converts both to a common notional basis so their ratio is meaningful even as price changes.
- Turnover Rate
turnover = vol_norm / oi_norm
Interpretation: fraction/multiples of the outstanding contract base traded in the bar. Color = green if turnover ≥ threshold.
Why Open Interest ≈ “Float” Proxy
---------------------------------
In stocks, float ≈ shares the public can trade. In derivatives, there are no “shares,” so Open Interest acts as the live stock of active contracts. It’s the best proxy for “what’s available in play” because it counts open positions that persist across bars. Using Volume ÷ OI mirrors stock float-turnover logic: how fast the tradable base is being recycled each period.
Why Normalize by Price
----------------------
Derivatives volume and OI may be reported in contracts, not notional value. One contract’s economic weight changes with price (especially on inverse contracts). Dividing both Volume and OI by Close:
- Puts them on a comparable notional footing.
- Prevents false spikes purely from price moves.
- Makes Turnover comparable across time even as price trends.
Advanced Tips
-------------
- Calibrate threshold: Start from the 80th–90th percentile of the last 60–90 bars of Turnover; set the threshold a touch below that to surface early heat.
- Add OI-delta: Layer an OI change histogram (current − prior) to separate new positioning from pure churn.
- Linear vs inverse: For linear (USDT-margined) contracts, the normalization still works and keeps visuals consistent; for inverse, it’s essential.
Limitations
-----------
- Data availability: Works only if your symbol exposes an _OI feed on TradingView; otherwise it errors out.
- Exchange conventions: Volume units differ by venue (contracts, coin, notional). Normalization mitigates, but cross-symbol comparisons still need caution.
- Intrabar gaps: OI is typically end-of-bar; rapid intrabar shifts won’t appear until the bar closes.
Notes
-----
- Designed primarily for crypto derivatives. For non-crypto, the script blanks OI to avoid misleading plots and uses a daily TF when needed.
Credit
------
- Concept & data: Built for TradingView data feeds.
- Acknowledgment: Credit to TradingView default indicator as requested.
- Source: This write-up reflects the logic present in your uploaded script.
Disclaimer
----------
Markets move; indicators simplify. Use with position sizing, hard stops, and catalyst awareness. The Turnover Rate flags activity, not direction.
Crypto OI AgregatedCrypto OI Aggregated — Open Interest Aggregator for Crypto Exchanges
General Description
The indicator is designed for comprehensive analysis of Open Interest (OI) across major cryptocurrency exchanges. It consolidates data from multiple platforms, visualizes it as candlestick charts or deltas, and builds tables with breakdowns by exchange and contract type. This allows traders to quickly understand where market interest is concentrated and how the market structure is shifting.
Unlike standard tools that only show data from a single exchange, this indicator provides a full market overview and makes it easy to compare dynamics across different platforms.
⸻
Key Features
• Aggregation of OI data from exchanges: Binance, Bybit, OKX, Bitget, Kraken, HTX, Deribit (feel free to leave a comment if you’d like me to add other exchanges that provide open interest data)
• Support for contract types: USDT.P, USD.P, USDC.P, USD.PM
• Automatic normalization of various OI data formats from different providers
• Display modes:
• OI candlestick chart (total aggregated OI)
• OI Delta (change in OI per bar)
• Full table with detailed data by exchange and contract type
• Short summary table with totals in USD and base assets
• Support for USD or COIN denomination
• Convenient formatting for large numbers
• Customizable colors
⸻
How to Use the Indicator
1. Select Exchanges
In the settings, enable or disable specific exchanges. It is recommended to activate only the ones you need for analysis — this will make the indicator faster.
2. Choose Data Type
• OI — aggregated open interest from selected exchanges.
• OI delta — delta (change in OI compared to the previous bar).
3. Denomination
• USD — values are converted into USD equivalents.
• COIN — values are shown in the base asset (BTC, ETH, etc.).
4. Reading the Chart
• OI candlesticks show the overall OI dynamics.
• Delta histogram highlights how much OI has grown or decreased per bar.
• Colors are fully customizable.
5. Tables
• Enabled via the Show table option.
• Full Table → Rows = exchanges, Columns = contract types. Cells contain OI values in either USD or the base asset, depending on settings. Quickly shows where the main interest is concentrated.
• Short Table → Displays only the total OI values in USD and the base asset.
⸻
Important Notes
• For better readability of large values, two custom formatting functions were implemented. They work similarly to format.volume, but with improved digit grouping and adjustable decimal precision. In the tables, the top row is formatted using format.volume, while the bottom row uses the improved formatting functions for clearer representation.
str(d, n, s) =>
str.substring(d, 0, str.length(d) - n) + '.' + str.substring(d, str.length(d) - n, str.length(d) - (n - 2)) + s
format(_r) =>
d = str.tostring(math.round(_r))
str.length(d) > 9 ? str(d, 9, " B") : str.length(d) > 6 ? str(d, 6, " M") : str.length(d) > 3 ? str(d, 3, " K") : d
⸻
Conclusion: Crypto OI Aggregated is a convenient and powerful tool for cryptocurrency derivatives traders. It enables tracking of OI dynamics across multiple exchanges simultaneously, detecting imbalances between contracts, and identifying signals that are not visible when analyzing a single exchange.

Advanced Liquidity Trap & Squeeze Detector [MazzaropiYoussef]DESCRIPTION:
The "Advanced Liquidity Trap & Squeeze Detector" is designed to identify potential liquidity traps, short and long squeezes, and market manipulation based on open interest, funding rates, and aggressive order flow.
KEY FEATURES:
- **Relative Open Interest Normalization**: Avoids scale discrepancies across different timeframes.
- **Liquidity Trap Detection**: Identifies potential bull and bear traps based on open interest and funding imbalances.
- **Squeeze Identification**: Highlights conditions where aggressive buyers or sellers are trapped before a reversal.
- **Volume Surge Confirmation**: Alerts when abnormal volume activity supports liquidity events.
- **Customizable Parameters**: Adjust thresholds to fine-tune detection sensitivity.
HOW IT WORKS:
- **Long Squeeze**: Triggered when relative open interest is high, funding is negative, and aggressive selling occurs.
- **Short Squeeze**: Triggered when relative open interest is high, funding is positive, and aggressive buying occurs.
- **Bull Trap**: Triggered when relative open interest is high, funding is positive, and price crosses above the trend line but fails.
- **Bear Trap**: Triggered when relative open interest is high, funding is negative, and price crosses below the trend line but fails.
USAGE:
- This indicator is useful for traders looking to anticipate reversals and avoid being caught in market manipulation events.
- Works best in combination with order book analysis and volume profile tools.
- Can be applied to crypto, forex, and other leveraged markets.
**/

OI RSI - WuJianDAOOI RSI (Open Interest Relative Strength Index)
Overview: OI RSI is a technical indicator that applies the RSI concept to open interest data.
Key Features:
Traditional vs. OI RSI:
Traditional RSI measures price movements to identify overbought or oversold conditions.
OI RSI computes the relative strength of open interest over a specified period.
Purpose:
Provides insights into market participation and sentiment by evaluating open interest levels.
Application:
Assists traders in detecting potential reversals or confirming trends based on open interest dynamics.

Ethereum COT [SAKANE]#Overview
Ethereum COT is an indicator that visualizes Ethereum futures market positions based on the Commitment of Traders (COT) report provided by the CFTC (Commodity Futures Trading Commission).
This indicator stands out from similar tools with the following features:
- **Flexible Data Switching**: Supports multiple COT report types, including "Financial," "Legacy," "OpenInterest," and "Force All."
- **Position Direction Selection**: Easily switch between long, short, and net positions. Net positions are automatically calculated.
- **Open Interest Integration**: View the overall trading volume in the market at a glance.
- **Comparison and Customization**: Toggle individual trader types (Dealer, Asset Manager, Commercials, etc.) on and off, with visually distinct color-coded graphs.
- **Force All Mode**: Simultaneously display data from different report types, enabling comprehensive market analysis.
These features make it a powerful tool for both beginners and advanced traders to deeply analyze the Ethereum futures market.
#Use Cases
1. **Analyzing Trader Sentiment**
- Compare net positions of various trader types (Dealer, Asset Manager, Commercials, etc.) to understand market sentiment.
2. **Identifying Trend Reversals**
- Detect early signs of trend reversals from sudden increases or decreases in long and short positions.
3. **Utilizing Open Interest**
- Monitor the overall trading volume represented by open interest to evaluate entry points or changes in volatility.
4. **Tracking Position Structures**
- Compare positions of leveraged funds and asset managers to analyze risk-on or risk-off environments.
#Key Features
1. **Report Type Selection**
- Financial (Financial Traders)
- Legacy (Legacy Report)
- Open Interest
- Force All (Display all data)
2. **Position Direction Selection**
- Long
- Short
- Net
3. **Visualization of Major Trader Types**
- Financial Traders: Dealer, Asset Manager, Leveraged Funds, Other Reportable
- Legacy: Commercials, Non-Commercials, Small Speculators
4. **Open Interest Visualization**
- Monitor the total open positions in the market.
5. **Flexible Customization**
- Toggle individual trader types on and off.
- Intuitive settings with tooltips for better usability.
#How to Use
1. Add the indicator to your chart and click the settings icon in the top-right corner.
2. Select the desired report type in the "Report Type" field.
3. Choose the position direction (Long/Short/Net) in the "Direction" field.
4. Toggle the visibility of trader types as needed.
#Notes
- Data is provided by the CFTC and is updated weekly. It is not real-time.
- Changes to the settings may take a few seconds to reflect.
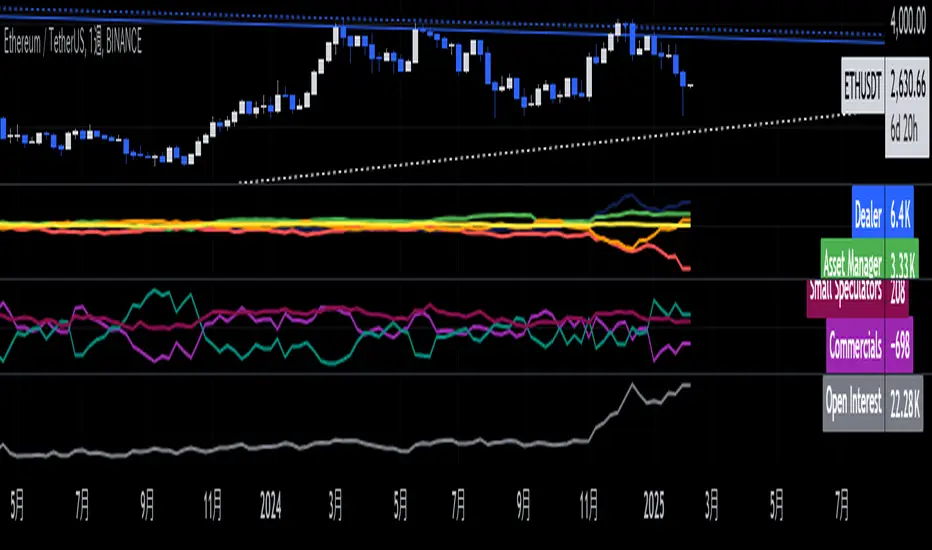
Bitcoin COT [SAKANE]#Overview
Bitcoin COT is an indicator that visualizes Bitcoin futures market positions based on the Commitment of Traders (COT) report provided by the CFTC (Commodity Futures Trading Commission).
This indicator stands out from similar tools with the following features:
- Flexible Data Switching: Supports multiple COT report types, including "Financial," "Legacy," "OpenInterest," and "Force All."
- Position Direction Selection: Easily switch between long, short, and net positions. Net positions are automatically calculated.
- Open Interest Integration: View the overall trading volume in the market at a glance.
- Comparison and Customization: Toggle individual trader types (Dealer, Asset Manager, Commercials, etc.) on and off, with visually distinct color-coded graphs.
- Force All Mode: Simultaneously display data from different report types, enabling comprehensive market analysis.
These features make it a powerful tool for both beginners and advanced traders to deeply analyze the Bitcoin futures market.
#Use Cases
1. Analyzing Trader Sentiment
- Compare net positions of various trader types (Dealer, Asset Manager, Commercials, etc.) to understand market sentiment.
2. Identifying Trend Reversals
- Detect early signs of trend reversals from sudden increases or decreases in long and short positions.
3. Utilizing Open Interest
- Monitor the overall trading volume represented by open interest to evaluate entry points or changes in volatility.
4. Tracking Position Structures
- Compare positions of leveraged funds and asset managers to analyze risk-on or risk-off environments.
#Key Features
1. Report Type Selection
- Financial (Financial Traders)
- Legacy (Legacy Report)
- Open Interest
- Force All (Display all data)
2. Position Direction Selection
- Long
- Short
- Net
3. Visualization of Major Trader Types
- Financial Traders: Dealer, Asset Manager, Leveraged Funds, Other Reportable
- Legacy: Commercials, Non-Commercials, Small Speculators
4. Open Interest Visualization
- Monitor the total open positions in the market.
5. Flexible Customization
- Toggle individual trader types on and off.
- Intuitive settings with tooltips for better usability.
#How to Use
1. Add the indicator to your chart and click the settings icon in the top-right corner.
2. Select the desired report type in the "Report Type" field.
3. Choose the position direction (Long/Short/Net) in the "Direction" field.
4. Toggle the visibility of trader types as needed.
#Notes
- Data is provided by the CFTC and is updated weekly. It is not real-time.
- Changes to the settings may take a few seconds to reflect.

Range Analysis - By LeviathanThe Interactive Range Analysis script is an essential tool for analyzing price ranges. It automatically draws important range levels, generates a Volume Profile or Open Interest profile and horizontal/vertical heatmaps, plots the anchored VWAP, draws Fibonacci levels, and much more.
How to use the indicator:
1. The script will prompt you to select the "Start Time" and "End Time" using Tradingview's interactive interface. These two points will determine the length of the range.
2. Once you have selected the range, the script will automatically anchor the range highs and lows to the highest and lowest close/wick/hlc3/ohlc4 (whichever you prefer).
3. You can then begin exploring different tools and options such as Quarters, Eighths, Fibonacci, Outer Levels, VWAP, Horizontal Volume/OI Heatmap, Vertical Volume/OI Heatmap, Fixed Range Volume Profile, Open Interest Profile, Value Area, VAH, VAL, and POC.
4. You can adjust the range by dragging the Start Time and End Time anchors or by removing/reapplying the script.
Tool overview
Range Levels
After selecting your preferred time range, the script will identify and draw a range high level and a range low level, which serve as a base for other important levels. “Half” is the level halfway between the range high and range low. “Quarters” will, as the name suggests, split the range into four equal zones (quarters) and “Eighths” will split the range into eight equal zones (eighths).
”Fibonacci” option allows you to display Fibonacci retracement levels (0.786, 0.618, 0.382, 0.236). “VWAP” will plot a Volume Weighted Average Price, anchored to the start of the range. “Direction” input lets you choose whether your range is UP or DOWN trending in order to make sure that the Fibonacci levels and labels are generated and assigned correctly. With “Outer” turned ON, the script will also generate active levels (quarters/eighths/Fibonacci) above and below the selected price range. “Extend Right” will extend all levels to the right indefinitely, while “Extend (+Bars)” lets you choose how far right the levels get extended. “Diagonal Line” is drawn from the bottom left of the range to the top right of the range or from the top left of the range to the bottom right of the range, depending on the “Direction” input.
Volume Profile / Open Interest Profile
After selecting the “Data Type”, Volume Profile or OI Profile can be generated by turning ON the “Volume/OI Profile” option.
“Resolution” input defines the amount of nodes/rows in the range that are used in profile/heatmap generation for distributing the data. While you can increase the “Resolution” to get better, more granular profiles, you should keep in mind that you might need to lower the resolution when generating profiles for larger ranges.
”Node Type” offers you two options when it comes to the representation of data: Up/Down - divides a node in two sections for up volume/OI and down volume/OI, Total - one node for total volume/OI and Delta - net difference in up volume/OI and down volume/OI.
”Profile Position” lets you choose whether the profile is positioned on the left side of the range or on the right side of the range.
“Profile Direction” determines whether the profile nodes are facing right or left.
“Profile Type” enables you to visualize the nodes in a classic way (Type 1) or in a way where down volume/negative OI are positioned on the left side of the y axis and up volume/positive OI on the right side of the y axis.
“Node Size (%)” defines how much space in the range can be taken by the profile’s nodes. Eg. 50% will allow the largest node to extend to the middle of the range (and others scaled accordingly), 100% will allow the largest node to extend the max right point of the range (and others scaled accordingly).
”Value Area (%)” defines the VA zone, which represents the area where the most volume occured (usually 70% or 68%).
”Horizontal Heatmap” will display a heatmap-like overlay, that will help you identify the price levels where most volume/open interest action occurred.
”Vertical Heatmap” will display a heatmap-like overlay, that will help you identify the points in time where most volume/open interest action occurred.
A more detailed description of this indicator is coming in the next few days.
Important:
* If volume or OI profile does not get generated, try lowering the resolution.
* Once in a while, the script will disappear from your chart. Just remove and reapply.
* Open Interest data is only avaiable on Binance Perpetual Futures pairs
To learn more, read the tooltips in the indicator’s settings and stay tuned for upcoming additions (Range Market Structure, Liquidation Levels, Range Statistics,…)

[PlayBit]Correlation-Co _OI Correlation-Co _OI
This Indicator uses a Correlation Coefficient to compare a Crypto Currency to the Binance Open Interest feed if the data is provided
A move in the same direction is indicated with a positive value (the indicator will move up)
A move in the opposite direction the indicator will indicate with a negative value (the indicator will move down)
If both are moving in the same direction and are converging or diverging this will be shown by larger values for divergence and smaller for convergence but will be a positive value
Negative values are shown when price and _OI are moving opposite each other
You can toggle the auto Open Interest option in the settings to use something other than Open Interest if you would like
I still need to add a visual showing when longs are unwinding or opening and when shorts are covering or opening
This is a concept that I made for @Johnny a while back and I'm republishing public from private
This can be useful when comparing a Asset with its Open Interest
The main bit of code was taken from:
by @mortdiggiddy
Let me know if you have any Ideas or suggestions or if I overlooked something
Hope you enjoy,
@FFriZz | @FrizLabz
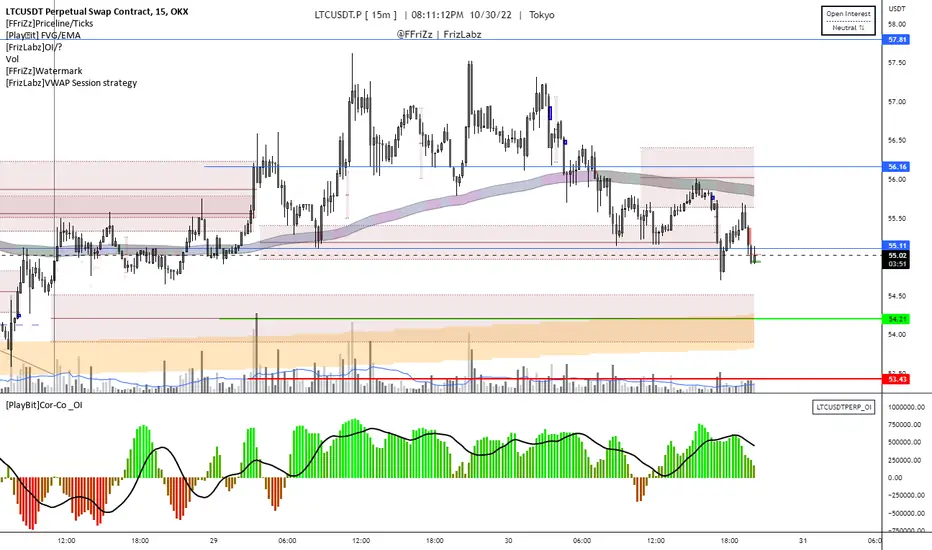
Crypto Terminal [Kioseff Trading]Hello!
Introducing Crypto Terminal (:
The indicator makes use of cryptocurrency data provided by vendor INTOTHEBLOCK.
NOTE: The cryptocurrency on your chart must be paired with USD or USDT. Data won't load otherwise - possibly transient. For instance, BTCUSD or BTCUSDT, ETHUSD or ETHUSDT.
Provided datasets:
Twitter Sentiment Data
Telegram Sentiment Data
Whale Data (i.e. % of Asset Belonging to Whales)
$100,000+ Transactions
Bulls/Bears (Bulls Buying | Bears Selling)
Current Position PnL (Currently Open Positions for the Coin are Retrieved and Plotted. Data is Split into Currently Profitable Positions, Losing Positions, and B/E Positions)
Average Balance
Holders/Traders Percentage (Addresses are Retrieved and Classified as Holding Accounts or Trader Accounts)
Correlation
Futures OI
Perpetual OI
Zero Balance Addresses
Flow (Money Inflow & Outflow)
Active Addresses
Average Transaction Time
Realized PnL (Addresses with Realized Profits, Realized Losses, and B/E)
Cruisers
A few more data points are provided.
Additionally, you can plot the values of any dataset in a pane below price.
Below are images of plottable data; different cryptocurrencies will be shown for each example (:
Twitter sentiment data.
Assess this data lightly; difficult to confirm accuracy.
Telegram sentiment data.
Assess this data lightly; difficult to confirm accuracy.
Percentage of asset belonging to whales.
$100,000+ transactions (volume oriented)
Bulls buying; bears selling.
Current positions at profit; current positions at loss; current positions at breakeven.
Average balance.
Percentage of asset belonging to traders; percentage of asset belonging to holders.
Asset's 30-interval correlation to BTC.
Perpetual open interest.
Zero-balance addresses.
Flows.
Active addresses.
Average transaction time.
Addresses at realized profit; addresses at realized loss; addresses at breakeven.
Cruiser data.
Futures open interest.
Naturally, this data isn't provided for every cryptocurrency; NaN values are returned in some instances.
Table 1
I provided three data tables, which load independently, so you don't have to change plotted data to access values.
Table 2
Lastly, you can create a 10-asset crypto index and run calculations against it.
The image shows an example.
I'll update this script with additional calculations/data in the near future. If you've any suggestions - please let me know!
Enjoy (:

LibraryCOT█ OVERVIEW
This library is a Pine programmer's tool that provides functions to access Commitment of Traders (COT) data for futures. Four of our scripts use it:
• Commitment of Traders: Legacy Metrics
• Commitment of Traders: Disaggregated Metrics
• Commitment of Traders: Financial Metrics
• Commitment of Traders: Total
If you do not program in Pine and want to use COT data, please see the indicators linked above.
█ CONCEPTS
Commitment of Traders (COT) data is tallied by the Commodity Futures Trading Commission (CFTC) , a US federal agency that oversees the trading of derivative markets such as futures in the US. It is weekly data that provides traders with information about open interest for an asset. The CFTC oversees derivative markets traded on different exchanges, so COT data is available for assets that can be traded on CBOT, CME, NYMEX, COMEX, and ICEUS.
Accessing COT data from a Pine script requires the generation of a ticker ID string for use with request.security() . The ticker string must be encoded in a special format that includes both CFTC and TradingView-specific content. The format of the ticker IDs is somewhat complex; this library's functions make their generation easier. Note that if you know the COT ticker ID string for specific data, you can enter it from the chart's "Symbol Search" dialog box.
A ticker for COT data in Pine has the following structure:
COT:__<_metricDirection><_metricType>
where an underscore prefixing a component name inside <> is only included if the component is not a null string, and:
Is a digit representing the type of the COT report the data comes from: "" for legacy COT data, "2" for disaggregated data and "3" for financial data.
Is a six digit code that represents a commodity. Example: wheat futures (root "ZW") have the code "001602".
Is either "F" if the report data should exclude Options data, or "FO" if such data is included.
Is the TradingView code of the metric. This library's `metricNameAndDirectionToTicker()` function creates both
the and components of a COT ticker from the metric names and directions listed in the above chart.
The different metrics are explained in the CFTC's Explanatory Notes .
Is the direction of the metric: "Long", "Short", "Spreading" or "No direction".
Not all directions are applicable to all metrics. The valid ones are listed next to each metric in the above chart.
Is the type of the metric, possible values are "All", "Old" and "Other".
The difference between the types is explained in the "Old and Other Futures" section of the CFTC's Explanatory Notes .
As an example, the Legacy report Open Interest data for ZW futures (options included) in the old standard has the ticker "COT:001602_FO_OI_OLD". The same data using the current standard without futures has the ticker "COT:001602_F_OI".
█ USING THE LIBRARY
The first functions in the library are helper functions that generate components of a COT ticker ID. The last function, `COTTickerid()`, is the one that generates the full ticker ID string by calling some of the helper functions. We use it like this in our example:
exampleTicker = COTTickerid(
COTType = "Legacy",
CFTCCode = convertRootToCOTCode("Auto"),
includeOptions = false,
metricName = "Open Interest",
metricDirection = "No direction",
metricType = "All")
This library's chart displays the valid values for the `metricName` and `metricDirection` arguments. They vary for each of the three types of COT data (the `COTType` argument). The chart also displays the COT ticker ID string in the `exampleTicker` variable.
Look first. Then leap.
The library's functions are:
rootToCFTCCode(root)
Accepts a futures root and returns the relevant CFTC code.
Parameters:
root : Root prefix of the future's symbol, e.g. "ZC" for "ZC1!"" or "ZCU2021".
Returns: The part of a COT ticker corresponding to `root`, or "" if no CFTC code exists for the `root`.
currencyToCFTCCode(curr)
Converts a currency string to its corresponding CFTC code.
Parameters:
curr : Currency code, e.g., "USD" for US Dollar.
Returns: The corresponding to the currency, if one exists.
optionsToTicker(includeOptions)
Returns the part of a COT ticker using the `includeOptions` value supplied, which determines whether options data is to be included.
Parameters:
includeOptions : A "bool" value: 'true' if the symbol should include options and 'false' otherwise.
Returns: The part of a COT ticker: "FO" for data that includes options and "F" for data that doesn't.
metricNameAndDirectionToTicker(metricName, metricDirection)
Returns a string corresponding to a metric name and direction, which is one component required to build a valid COT ticker ID.
Parameters:
metricName : One of the metric names listed in this library's chart. Invalid values will cause a runtime error.
metricDirection : Metric direction. Possible values are: "Long", "Short", "Spreading", and "No direction".
Valid values vary with metrics. Invalid values will cause a runtime error.
Returns: The part of a COT ticker ID string, e.g., "OI_OLD" for "Open Interest" and "No direction",
or "TC_L" for "Traders Commercial" and "Long".
typeToTicker(metricType)
Converts a metric type into one component required to build a valid COT ticker ID.
See the "Old and Other Futures" section of the CFTC's Explanatory Notes for details on types.
Parameters:
metricType : Metric type. Accepted values are: "All", "Old", "Other".
Returns: The part of a COT ticker.
convertRootToCOTCode(mode, convertToCOT)
Depending on the `mode`, returns a CFTC code using the chart's symbol or its currency information when `convertToCOT = true`.
Otherwise, returns the symbol's root or currency information. If no COT data exists, a runtime error is generated.
Parameters:
mode : A string determining how the function will work. Valid values are:
"Root": the function extracts the futures symbol root (e.g. "ES" in "ESH2020") and looks for its CFTC code.
"Base currency": the function extracts the first currency in a pair (e.g. "EUR" in "EURUSD") and looks for its CFTC code.
"Currency": the function extracts the quote currency ("JPY" for "TSE:9984" or "USDJPY") and looks for its CFTC code.
"Auto": the function tries the first three modes (Root -> Base Currency -> Currency) until a match is found.
convertToCOT : "bool" value that, when `true`, causes the function to return a CFTC code.
Otherwise, the root or currency information is returned. Optional. The default is `true`.
Returns: If `convertToCOT` is `true`, the part of a COT ticker ID string.
If `convertToCOT` is `false`, the root or currency extracted from the current symbol.
COTTickerid(COTType, CTFCCode, includeOptions, metricName, metricDirection, metricType)
Returns a valid TradingView ticker for the COT symbol with specified parameters.
Parameters:
COTType : A string with the type of the report requested with the ticker, one of the following: "Legacy", "Disaggregated", "Financial".
CTFCCode : The for the asset, e.g., wheat futures (root "ZW") have the code "001602".
includeOptions : A boolean value. 'true' if the symbol should include options and 'false' otherwise.
metricName : One of the metric names listed in this library's chart.
metricDirection : Direction of the metric, one of the following: "Long", "Short", "Spreading", "No direction".
metricType : Type of the metric. Possible values: "All", "Old", and "Other".
Returns: A ticker ID string usable with `request.security()` to fetch the specified Commitment of Traders data.
█ AVAILABLE METRICS
Different COT types provide different metrics. The table of all metrics available for each of the types can be found below.
+------------------------------+------------------------+
| Legacy (COT) Metric Names | Directions |
+------------------------------+------------------------+
| Open Interest | No direction |
| Noncommercial Positions | Long, Short, Spreading |
| Commercial Positions | Long, Short |
| Total Reportable Positions | Long, Short |
| Nonreportable Positions | Long, Short |
| Traders Total | No direction |
| Traders Noncommercial | Long, Short, Spreading |
| Traders Commercial | Long, Short |
| Traders Total Reportable | Long, Short |
| Concentration Gross LT 4 TDR | Long, Short |
| Concentration Gross LT 8 TDR | Long, Short |
| Concentration Net LT 4 TDR | Long, Short |
| Concentration Net LT 8 TDR | Long, Short |
+------------------------------+------------------------+
+-----------------------------------+------------------------+
| Disaggregated (COT2) Metric Names | Directions |
+-----------------------------------+------------------------+
| Open Interest | No Direction |
| Producer Merchant Positions | Long, Short |
| Swap Positions | Long, Short, Spreading |
| Managed Money Positions | Long, Short, Spreading |
| Other Reportable Positions | Long, Short, Spreading |
| Total Reportable Positions | Long, Short |
| Nonreportable Positions | Long, Short |
| Traders Total | No Direction |
| Traders Producer Merchant | Long, Short |
| Traders Swap | Long, Short, Spreading |
| Traders Managed Money | Long, Short, Spreading |
| Traders Other Reportable | Long, Short, Spreading |
| Traders Total Reportable | Long, Short |
| Concentration Gross LE 4 TDR | Long, Short |
| Concentration Gross LE 8 TDR | Long, Short |
| Concentration Net LE 4 TDR | Long, Short |
| Concentration Net LE 8 TDR | Long, Short |
+-----------------------------------+------------------------+
+-------------------------------+------------------------+
| Financial (COT3) Metric Names | Directions |
+-------------------------------+------------------------+
| Open Interest | No Direction |
| Dealer Positions | Long, Short, Spreading |
| Asset Manager Positions | Long, Short, Spreading |
| Leveraged Funds Positions | Long, Short, Spreading |
| Other Reportable Positions | Long, Short, Spreading |
| Total Reportable Positions | Long, Short |
| Nonreportable Positions | Long, Short |
| Traders Total | No Direction |
| Traders Dealer | Long, Short, Spreading |
| Traders Asset Manager | Long, Short, Spreading |
| Traders Leveraged Funds | Long, Short, Spreading |
| Traders Other Reportable | Long, Short, Spreading |
| Traders Total Reportable | Long, Short |
| Concentration Gross LE 4 TDR | Long, Short |
| Concentration Gross LE 8 TDR | Long, Short |
| Concentration Net LE 4 TDR | Long, Short |
| Concentration Net LE 8 TDR | Long, Short |
+-------------------------------+------------------------+
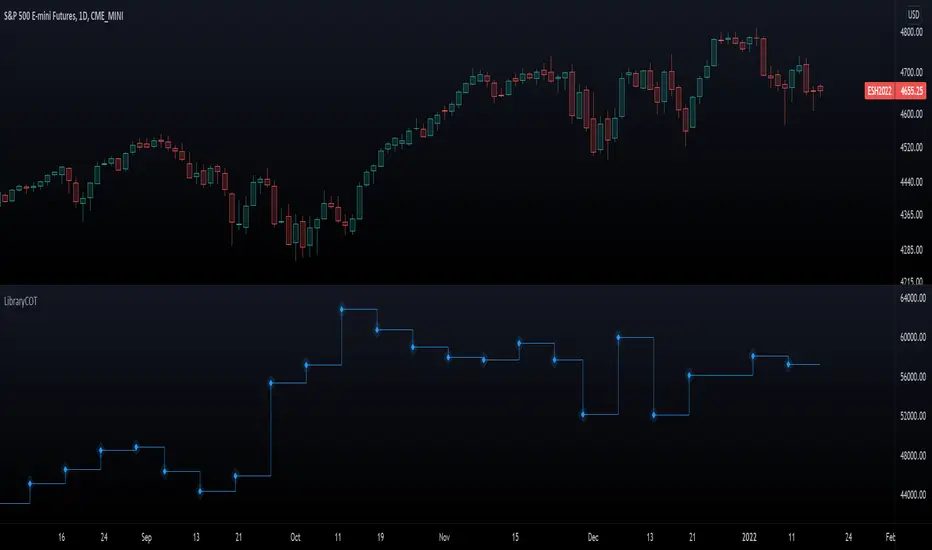
The Insider - Hunt Bitcoin CoT DeltaThe Insider - Hunt Bitcoin CoT Delta
The gift of the Squeeze in the Largest 4 open Interest Shorts vs Longs.
Why Bother another CoT signal?
Its different & focused on the Insider's.
Performance -
This Indicator provided a
1. Signal 1 = 26th March 2019 = SUPER LONG at $4,500 that saw a near $14,000 run up
2. Signal 2 = 18th & 24th June 2019 = SHORT at the second & final level $11,700 after repeated attempts & failure in the $13K range, the mini Echo Bitcoin Bull of 2019
3. Signal 3 = 17th December 2019 = LONG $6,900, Bitcoin rallied to Mid $10,500's
4. Signal 4 = 18th Feb 2020 = SUPER SHORT from $9,700's to a final extreme Low of $3,000, calling the CV-19 collapse
5. Signal 5 = 17th March 2020 = LONG from $5,400 no closure point yet
6. Signal 6 = 29th June 2020 = SUPER LONG reiterate from $10,700 no closure sell signal yet
7. Signal 7 = 17th May 2020 = LONG another accumulate LONG with no sell signal yet generated at Post H&S's low of $33,000
Note - This indicator only commences March 2019, as Bitcoin futures were a recent introduction and needed to settle for 6 months in both use and data, no signals were meaningful prior & data was light.
What is Provided. - Please note the need to also add the Hunt Bitcoin Historical Volatility Indicator for full understanding.
We provide 3 things with the 3 indicators.
'Insider' indications from Largest players in the futures market.
1. Bitcoin Macro Buy Signals.
a) The Bitcoin Commitment of Traders results see us focus solely on Largest 4 Short Open Interest & Largest 4 Long Open Interest aspects of the CoT Release data.
When the difference - is tight, a kind of pinch, these have been great Buy signals in Bitcoin.
We call this difference the Delta & When Delta is 5% or less Bitcoin is a Buy.
2. Bitcoin Macro Sells.
a) A sell signal is Triggered in Bitcoin at any point the Largest 4 short OI > or = to 70
3. AMPLIFIER Trade signals 'Super' Longs or Shorts -
Extreme low volatility events leads to highly impulsive & volatile subsequent moves, if either of 1 or 2 above occur, combined with extreme low volatility
a 'Super Long' or 'SUPER SELL' is generated. In the case of the short side, given Bitcoins general expansive and MACRO Bull trend since inception, we seek an additional component
that is an extreme differential/Delta reading between 4 biggest Longs & Shorts OI.
Namely CoT Delta also must be > 47.5%
We also have a Cautionary level, where it is not necessarily a good idea to accumulate Bitcon, as a better opportunity lower may avail itself, see conditions below.
So the required logic explicitly stated below for all Signals.
1. Long - Hunt Bitcoin CoT Delta < or = 5
2. SUPER Long - Hunt Bitcoin CoT Delta < or = 5; and 2 Day Historical Bitcoin Volatility = or < 20
3. Short - Largest 4 Sellers OI = or > 70
4. SUPER Short - Largest 4 Sellers OI = or > 70; AND..
Hunt Bitcoin CoT Delta = or > 47.5 AND 2 Day Historical BTC Volatility = or < 20
5. Caution - Largest 4 Sellers OI = or > 67.5 AND Hunt Bitcoin CoT Delta = or > 45
WARNING SEE Notes Below
Note 1 - = Largest 4 Open Interest Shorts
Note 2 - = Largest 4 Open Interest Longs
Note 3 - = Hunt Cot Delta = (Largest 4 sellers OI) -( Largest 4 Buyers OI)
Caution = Avoid new Bitcoin Accumulation Right Now, A sell signal might follow Enter on next Long
Note 4 - The Hunt Bitcoin COT Delta signal is a Largest 'Insider' Tracking tool based on a segment of Commitment of Traders data on Bitcoin Futures, released once a week on a Friday.
It is a Macro Timeframe signal , and should not be used for Day trading and Short Timeframe analysis , Entries may be optimised after a Hunt Bitcoin CoT Signal is generated by separate shorter Timeframe analysis.
Note 5 - The Historical Bitcoin Volatility is an additional 'Amplifier' component to the 'Hunt Bitcoin Cot Delta' Insider Signal
Note 6 - The Historical Bitcoin Volatility criteria varies by timeframe, the above levels are those applying on a Two Day TF Chart, select this custom timeframe in Trading View.
if additional criteria are met for LONG & SHORT insider signals, they may become 'Super Longs/Shorts', see conditions box above.