TAS Boxes + TAS Vega + TAS Compass [TASMarketProfile]This bundle of 3 TAS Market Profile indicators provides a shaded background that reveals directional bias, colored price bars show clearly when breakout conditions are bullish (green) or bearish (red) as well as 3 real-time dotted lines that show developing commercial balance areas known as “value areas.” These TAS Boxes 3 lines are calculated in real-time and leveraged to identify trade entry zones, trailing stops and targets. The 3 indicators can be activated and applied to a chart simultaneously (as shown) or individually in the Inputs settings tab. This description contains descriptions for all 3 indicators in the order of TAS Boxes, TAS Vega and TAS Compass so you’ll need to scroll below to get to the one you want insight.
∟ ABOUT TAS BOXES:
TAS Boxes (also known as TAS Dynamic Profile) offers a dynamic representation of developing commercial balance areas known as “value areas” and are depicted with 3 colored horizontal dotted lines. Note that the thickness of the dotted lines may be adjusted in the Style settings.
Red Line- Supply / High Value Area (HVA) / Resistance
Cyan Line- Point of Control (POC)
Green Line- Demand / Low Value Area (LVA) / Support
The TAS Boxes calculate and display in real-time intrabar and are finalized at the close of the bar. The levels may dynamically update intrabar and move and this is viewed as foreshadowing of where new value areas may be attempting to appear next. When the market is between the top and bottom lines, the market is considered “in value” or “in balance.” When the market closes outside the top or bottom lines, the market is considered out of value/unbalanced and in breakout mode in that direction.
INPUT SETTINGS FOR TAS BOXES:
There are 3 inputs for TAS Boxes and below you’ll find the default settings:
MinSignal_123: 2 (only options are 1, 2, or 3)
Length: 7
MapLength: 7
MinSignal_123 -- Measures how established the commercial interest creating the balance area must be to create a new TAS Box. In other words, this input is a measure of the strength of the box.
Length –- Takes into consideration the relative “momentum” behind the move and how extended the move must be before the formation of new TAS Box levels.
MapLength –- Specifies the number of bars of data used to create the parameters of the TAS Box.
In summary, the first two inputs determine how often a new TAS Box will appear. The higher the input numbers the less often and harder it is to establish a new TAS Box, and vice versa. The last input simply determines how much data is included in the calculation of the new TAS Box.
While we recommend the default 2-7-7 as standard inputs for most traders as they work well with any tradable instrument with sufficient liquidity, other input combinations can be explored per the user’s preferences for varying sensitivity to market conditions and how recent of market conditions. Other settings to consider are 2-14-7 or 3-4-50. We invite the user to explore the cause and effect of changing the settings but doing so only after they have mastered an understanding of the strategy deployment with the defaults. The vast majority of users do not change the default settings.
WHAT MARKETS AND TIMEFRAMES CAN BE TRADED?
TAS Boxes can be displayed on Stocks, ETFs, futures, Forex and digital currencies. TAS Boxes can be applied to a chart of any time frame (e.g. 1-minute, 5-minute, 20-minute, daily, weekly, etc.) and will also function with many other style charts such as Range and Renko. Boxes displayed on longer time frames designate more significant balance areas and can be used to locate higher probability entries. Boxes on shorter time frames can be used to identify if the tradable instrument is currently in balance or breaking out, and pinpoint entries accordingly.
INTERPRETATION AND BASIC RULES:
HEIGHT OF BOXES: The height of the TAS Boxes from top line to bottom line is a measure of volatility. When taller Boxes are present and subsequent Boxes expand, this means the volatility of the market has increased. When the height of the Boxes is smaller or contracting, then we are experiencing a market in decreasing volatility or consolidating.
WIDTH OF BOXES: The width of the TAS Boxes are a measure of significance. The longer TAS Boxes have remained at the same levels, the higher the impact they will generally have as support or resistance levels, and in the instances they are breached the market may experience fast and vertical movement.
The TAS Boxes are used to identify high-probability zones for trading both inside the range of the Boxes and also when in breakout mode outside the Boxes:
>>> When price is trading within the boundaries of a normal to wide range commercial
balance area, we can consider trades within the range of the Boxes and should look for entries around the support (green line) or resistance (red line) areas with profit targets around the POC (cyan line) or opposite boundary.
>>> When taking trades near both the upper and lower boundaries, we like to see the POC
near the middle of the box’s range. This is known as a “symmetrical box” as pictured below.
>>> If the POC is plotted tightly close to or at the same price level as the green or red line, we refer to this as forming a “wall” or "plywood" and anticipate stronger commercial interest providing support or resistance in those areas.
>>> When trading above or below the current box, price is said to be in breakout/breakdown mode. During these modes, one should be getting out of any opposing positions that are not in the direction of the breakout. Not all breakout/breakdowns are created equal. Moves outside of TAS Boxes when the vertical distance from Top to Bottom is minimal will tend to have more powerful moves, especially in instances when there are recent long-range bars in the direction of the break.
>>> When markets are breaking out or down outside of Boxes, if there is sizeable space before you encounter recent historal TAS Boxes levels that is favorable for good follow through of the move. Prior TAS Boxes levels do serve as as areas the market may encounter friction and go sideways for a period of time.
MANAGING RISK WITH STOP LOSSES:
We highly recommend the use of stop losses when trading. You can place stop losses outside of the 3 lines of TAS Boxes and trail them behind the market as new Boxes appear in the direction of the trade. You may also move trailing stops among the 3 levels to suit your risk tolerance (e.g. when market is in breakout mode, trailing it from out the Boxes to outside the POC level or opposing level). You can start your initial stop outside the opposite of all 3 lines or on the other side of the POC for lower risk.
∟ ABOUT TAS VEGA:
TAS Vega changes the coloring of the price bars to provide a more meaningful interpretation of when markets are in balance (based on TAS Boxes) or in bullish/bearish breakout mode. There are four colors generated for TAS Vega:
GREEN – Bullish breakout / Don’t be short
RED – Bearish breakdown / Don’t be long
ORANGE – 1st bar back inside TAS Boxes after prior move outside.
GRAY – Balanced, each subsequent bar after the 1st bar closes inside Boxes.
INTERPRETATION AND BASIC RULES:
WHEN VEGA IS GREEN:
Don’t be short.
Consider longs only or retain existing long positions.
Entering on the bar close above the Boxes is higher probability than intrabar entry.
Many consecutive bar closes above Boxes increases probability of eventual move higher.
WHEN VEGA IS RED:
Don’t be long.
Consider shorts only or retain existing short positions.
Entering on the bar close below the Boxes is higher probability than intrabar entry.
Many consecutive bar closes below Boxes increases probability of eventual move lower.
WHEN VEGA IS ORANGE:
If orange due to closing back inside Boxes of your initial entry Box, hold.
If orange due to closing inside a new Box appearing in the direction of your trade (higher Boxes for longs, lower Boxes for short) consider this a potential 1st tier profit-taking opportunity for multi-lot/shares positions. If single units, exit is at the trader's discretion contingent on the extent of the move.
It is prudent risk management to also use the appearance of orange closed bars as a reminder to trail your stop loss behind the new TAS Boxes levels.
Many times you may see many orange bars over a series of bars (not consecutive, however) and this means the market continues to explore both sides of TAS Boxes and is indecisive about intentions. Be cautious at these times.
WHEN VEGA IS GRAY:
Gray bars simply means the bar has closed in balance within the value area of TAS Boxes.
Gray bars are not a cue to exit a position necessarily. It is just a visual that the bar has closed in the value area. Often a trending move will have many periods that the market closes back inside new Boxes that are appearing in the direction of the trend and your largest trades will require that you simply adjust your trailing stop rather than exit with gray bars.
It is prudent risk management to also use the appearance of orange closed bars as a reminder to trail your stop loss behind the new TAS Boxes levels.
Many times you may see many orange bars over a series of bars (not consecutive, however) and this means the market continues to explore both sides of TAS Boxes and is indecisive about intentions. Be cautious at these times.
The user can adjust the coloring of the TAS Vega bars in Style settings.
∟ ABOUT TAS COMPASS:
TAS Compass changes the background color of the chart to reveal the directional bias of the market. It may be applied to charts in any timeframe for stocks, ETFs, futures, Forex and digital currencies.
There are two colors generated for TAS Compass:
GREEN – Bullish directional bias
RED – Bearish directional bias
INTERPRETATION AND BASIC RULES:
The directional bias is established (or changes) when a bar closes outside of TAS Boxes levels. When a market closes above the TAS Boxes, it will establish a bullish bias (green background) and this will remain intact until there is a close below the TAS Boxes. At the time there is a bar close below the TAS Boxes, then the TAS Compass bias changes to bearish bias (red background). This sequence continues back and forth indefinitely. When using TAS Compass, one should still follow the prudent rules and best practices of TAS Boxes as there may be opportunities to exit a losing position sooner by doing so even in the instance a TAS Compass directional bias has not changed.
TAS Compass can be used as a stand-alone visual cue on a chart, but will have accentuated value when used in conjunction with TAS Boxes and TAS Vega indicators included within this bundle.
Below is an example showing TAS Compass with TAS Boxes in order to show how the closes outside of TAS Boxes is the trigger to the background color change logic.
Trade Well My Friends,
Cari dalam skrip untuk "poc"

Realtime Delta Volume Action [LucF]█ OVERVIEW
This indicator displays on-chart, realtime, delta volume and delta ticks information for each bar. It aims to provide traders who trade price action on small timeframes with volume and tick information gathered as updates come in the chart's feed. It builds its own candles, which are optimized to display volume delta information. It only works in realtime.
█ WARNING
This script is intended for traders who can already profitably trade discretionary on small timeframes. The high cost in fees and the excitement of trading at small timeframes have ruined many newcomers to trading. While trading at small timeframes can work magic for adrenaline junkies in search of thrills rather than profits, I DO NOT recommend it to most traders. Only seasoned discretionary traders able to factor in the relatively high cost of such a trading practice can ever hope to take money out of markets in that type of environment, and I would venture they account for an infinitesimal percentage of traders. If you are a newcomer to trading, AVOID THIS TOOL AT ALL COSTS — unless you are interested in experimenting with the interpretation of volume delta combined with price action. No tool currently available on TradingView provides this type of close monitoring of volume delta information, but if you are not already trading small timeframes profitably, please do not let yourself become convinced that it is the missing piece you needed. Avoid becoming a sucker who only contributes by providing liquidity to markets.
The information calculated by the indicator cannot be saved on charts, nor can it be recalculated from historical bars.
If you refresh the chart or restart the script, the accumulated information will be lost.
█ FEATURES
Key values
The script displays the following key values:
• Above the bar: ticks delta (DT), the total ticks for the bar, the percentage of total ticks that DT represents (DT%)
• Below the bar: volume delta (DV), the total volume for the bar, the percentage of total volume that DV represents (DV%).
Candles
Candles are composed of four components:
1. A top shaped like this: ┴, and a bottom shaped like this: ┬ (picture a normal Japanese candle without a body outline; the values used are the same).
2. The candle bodies are filled with the bull/bear color representing the polarity of DV. The intensity of the body's color is determined by the DV% value.
When DV% is 100, the intensity of the fill is brightest. This plays well in interpreting the body colors, as the smaller, less significant DV% values will produce less vivid colors.
3. The bright-colored borders of the candle bodies occur on "strong bars", i.e., bars meeting the criteria selected in the script's inputs, which you can configure.
4. The POC line is a small horizontal line that appears to the left of the candle. It is the volume-weighted average of all price updates during the bar.
Calculations
This script monitors each realtime update of the chart's feed. It first determines if price has moved up or down since the last update. The polarity of the price change, in turn, determines the polarity of the volume and tick for that specific update. If price does not move between consecutive updates, then the last known polarity is used. Using this method, we can calculate a running volume delta and ticks delta for the bar, which becomes the bar's final delta values when the bar closes (you can inspect values of elapsed realtime bars in the Data Window or the indicator's values). Note that these values will all reset if the script re-executes because of a change in inputs or a chart refresh.
While this method of calculating is not perfect, it is by far the most precise way of calculating volume delta available on TradingView at the moment. Calculating more precise results would require scripts to have access to tick data from any chart timeframe. Charts at seconds timeframes do use exchange/broker ticks when the feeds you are using allow for it, and this indicator will run on them, but tick data is not yet available from higher timeframes. Also, note that the method used in this script is far superior to the intrabar inspection technique used on historical bars in my other "Delta Volume" indicators. This is because volume and ticks delta here are calculated from many more realtime updates than the available intrabars in history. Unfortunately, the calculation method used here cannot be used on historical bars, where intrabar inspection remains, in my opinion, the optimal method.
Inputs
The script's inputs provide many ways to personalize all the components: what is displayed, the colors used to display the information, and the marker conditions. Tooltips provide details for many of the inputs; I leave their exploration to you.
Markers
Markers provide a way for you to identify the points of interest of your choice on the chart. You control the set of conditions that trigger each of the five available markers.
You select conditions by entering, in the field for each marker, the number of each condition you want to include, separated by a comma. The conditions are:
1 — The bar's polarity is up/dn.
2 — `close` rises/falls ("rises" means it is higher than its value on the previous bar).
3 — DV's polarity is +/–.
4 — DV% rises (↕).
5 — POC rises/falls.
6 — The quantity of realtime updates rises (↕).
7 — DV > limit (You specify the limit in the inputs. Since DV can be +/–, DV– must be less than `–limit` for a short marker).
8 — DV% > limit (↕).
9 — DV+ rises for a long marker, DV– falls for a short.
10 — Consecutive DV+/DV– on two bars.
11 — Total volume rises (↕).
12 — DT's polarity is +/–.
13 — DT% rises (↕).
14 — DT+ rises for a long marker, DT– falls for a short.
Conditions showing the (↕) symbol do not have symmetrical states; they act more like filters. If you only include condition 4 in a marker's setup, for example, both long and short markers will trigger on bars where DV% rises. To trigger only long or short markers, you must add a condition providing directional differentiation, such as conditions 1 or 2. Accordingly, you would enter "1,4" or "2,4".
For a marker to trigger, ALL the conditions you specified for it must be met. Long markers appear on the chart as "Mx▲" signs under the values displayed below candles. Short markers display "Mx▼" over the number of updates displayed above candles. The marker's number will replace the "x" in "Mx▲". The script loads with five markers that will not trigger because no conditions are associated with them. To activate markers, you will need to select and enter the set of conditions you require for each one.
Alerts
You can configure alerts on this script. They will trigger whenever one of the configured markers triggers. Alerts do not repaint, so they trigger at the bar's close—which is also when the markers will appear.
█ HOW TO USE IT
As a rule, I do not prescribe expected use of my indicators, as traders have proved to be much more creative than me in using them. Additionally, I tend to think that if you expect detailed recommendations from me to be able to use my indicators, it's a sign you are in a precarious situation and should go back to the drawing board and master the necessary basics that will allow you to explore and decide for yourself if my indicators can be useful to you, and how you will use them. I will make an exception for this thing, as it presents fairly novel information. I will use simple logic to surmise potential uses, as contrary to most of my other indicators, I have NOT used this one to actually trade. Markets have a way of throwing wrenches in our seemingly bullet-proof rationalizing, so drive cautiously and please forgive me if the pointers I share here don't pan out.
The first thing to do is to disable your normal bars. You can do this by clicking on the eye icon that appears when you hover over the symbol's name in the upper-left corner of your chart.
The absolute value and polarity of DV mean little without perspective; that's why I include both total volume for the bar and the percentage that DV represents of that total volume. I interpret a low DV% value as indecision. If you share that opinion, you could, let's say, configure one of the markers on "DV% > 80%", for example (to do so you would enter "8" in the condition field of any marker, and "80" in the limit field for condition 8, below the marker conditions).
I also like to analyze price action on the bar with DV%. Small DV% values should often produce small candle bodies. If a small DV% value occurs on a bar with much movement and high volume, I'm thinking "tough battle with potential explosive power when one side wins". Conversely, large bodies with high DV% mean that large volume is breaching through multiple levels, or that nobody is suddenly willing to take the other side of a normal volume of trades.
I find the POC lines really interesting. First, they tell us the price point where the most significant action (taking into account both price occurrences AND volume) during the bar occurred. Second, they can be useful when compared against past values. Third, their color helps us in figuring out which ones are the most significant. Unsurprisingly, bunches of orange POCs tend to appear in consolidation zones, in pauses, and before reversals. It may be useful to often focus more on POC progression than on `close` values. This is not to say that OHLC values are not useful; looking, as is customary, for higher highs or lower lows, or for repeated tests of precise levels can of course still be useful. I do like how POCs add another dimension to chart readings.
What should you do with the ticks delta above bars? Old-time ticker tape readers paid attention to the sounds coming from it (the "ticker" moniker actually comes from the sound they made). They knew activity was picking up when the frequency of the "ticks" increased. My thinking is that the total number of ticks will help you in the same way, since increasing updates usually mean growing interest—and thus perhaps price movement, as increasing volatility or volume would lead us to surmise. Ticks delta can help you figure out when proportionally large, random orders come in from traders with other perspectives than the short-term price action you are typically working with when you use this tool. Just as volume delta, ticks delta are one more informational component that can help you confirm convergence when building your opinions on price action.
What are strong bars? They are an attempt to identify significance. They are like a default marker, except that instead of displaying "Mx▲/▼" below/above the bar, the candle's body is outlined in bright bull/bear color when one is detected. Strong bars require a respectable amount of conditions to be met (you can see and re-configure them in the inputs). Think of them as pushes rather than indications of an upcoming, strong and multi-bar move. Pushes do, for sure, often occur at the beginning of strong trends. You will often see a few strong bars occur at 2-3 bar intervals at the beginning or middle of trends. But they also tend to occur at tops/bottoms, which makes their interpretation problematic. Another pattern that you will see quite frequently is a final strong bar in the direction of the trend, followed a few bars later by another strong bar in the reverse direction. My summary analyses seemed to indicate these were perhaps good points where one could make a bet on an early, risky reversal entry.
The last piece of information displayed by the indicator is the color of the candle bodies. Three possible colors are used. Bull/bear is determined by the polarity of DV, but only when the bar's polarity matches that of DV. When it doesn't, the color is the divergence color (orange, by default). Whichever color is used for the body, its intensity is determined by the DV% value. Maximum intensity occurs when DV%=100, so the more significant DV% values generate more noticeable colors. Body colors can be useful when looking to confirm the convergence of other components. The visual effect this creates hopefully makes it easier to detect patterns on the chart.
One obvious methodology that comes to mind to trade with this tool would be to use another indicator like Technical Ratings at a higher timeframe to identify the larger context's trend, and then use this tool to identify entries for short-term trades in that direction.
█ NOTES AND RAMBLINGS
Instant Calculations
This indicator uses instant values calculated on the bar only. No moving averages or calculations involving historical periods are used. The only exception to this rule is in some of the marker conditions like "Two consecutive DV+ values", where information from the previous bar is used.
Trading Small vs Long Timeframes
I never trade discretionary at the 5sec–5min timeframes this indicator was designed to be used with; I trade discretionary at 1D, 1W and 1M timeframes, and let systems trade at smaller timeframes. The higher the timeframe you trade at, the fewer fees you will pay because you trade less and are not churning trading volume, as is inevitable at smaller timeframes. Trading at higher timeframes is also a good way to gain an instant edge on most of the trading crowd that has its nose to the ground and often tends to forget the big picture. It also makes for a much less demanding trading practice, where you have lots of time to research and build your long-term opinions on potential future outcomes. While the future is always uncertain, I believe trades riding on long-term trends have stronger underlying support from the reality outside markets.
To traders who will ask why I publish an indicator designed for small timeframes, let me say that my main purpose here is to showcase what can be done with Pine. I often see comments by coders who are obviously not aware of what Pine is capable of in 2021. Since its humble beginnings seven years ago, Pine has grown and become a serious programming language. TradingView's growing popularity and its ongoing commitment to keep Pine accessible to newcomers to programming is gradually making Pine more and more of a standard in indicator and strategy programming. The technical barriers to entry for traders interested in owning their trading practice by developing their personal tools to trade have never been so low. I am also publishing this script because I value volume delta information, and I present here what I think is an original way of analyzing it.
Performance
The script puts a heavy load on the Pine runtime and the charting engine. After running the script for a while, you will often notice your chart becoming less responsive, and your chart tab can take longer to activate when you go back to it after using other tabs. That is the reason I encourage you to set the number of historical values displayed on bars to the minimum that meets your needs. When your chart becomes less responsive because the script has been running on it for many hours, refreshing the browser tab will restart everything and bring the chart's speed back up. You will then lose the information displayed on elapsed bars.
Neutral Volume
This script represents a departure from the way I have previously calculated volume delta in my scripts. I used the notion of "neutral volume" when inspecting intrabar timeframes, for bars where price did not move. No longer. While this had little impact when using intrabar inspection because the minimum usable timeframe was 1min (where bars with zero movement are relatively infrequent), a more precise way was required to handle realtime updates, where multiple consecutive prices often have the same value. This will usually happen whenever orders are unable to move across the bid/ask levels, either because of slow action or because a large-volume bid/ask level is taking time to breach. In either case, the proper way to calculate the polarity of volume delta for those updates is to use the last known polarity, which is how I calculate now.
The Order Book
Without access to the order book's levels (the depth of market), we are limited to analyzing transactions that come in the TradingView feed for the chart. That does not mean the volume delta information calculated this way is irrelevant; on the contrary, much of the information calculated here is not available in trading consoles supplied by exchanges/brokers. Yet it's important to realize that without access to the order book, you are forfeiting the valuable information that can be gleaned from it. The order book's levels are always in movement, of course, and some of the information they contain is mere posturing, i.e., attempts to influence the behavior of other players in the market by traders/systems who will often remove their orders when price comes near their order levels. Nonetheless, the order book is an essential tool for serious traders operating at intraday timeframes. It can be used to time entries/exits, to explain the causes of particular price movements, to determine optimal stop levels, to get to know the traders/systems you are betting against (they tend to exhibit behavioral patterns only recognizable through the order book), etc. This tool in no way makes the order book less useful; I encourage all intraday traders to become familiar with it and avoid trading without one.

AR-Volume ProfileAR-Volume Profile plots two volume profiles on your chart at the same time:
• Daily Volume Profiles (multiple days back, always visible)
• Hourly Volume Profiles (last N hours, designed for ≤ 15m timeframes)
It’s built to stay clean, readable, and performance-safe, while still letting you see where volume built up across recent structure.
________________________________________
What You See On Chart
- Daily Profiles (Multi-day) Increased using Polylines
• Shows Volume Profile histograms for the last X days back (you choose).
• Each day is drawn as a horizontal histogram inside that day’s session.
• Color logic:
o Base (all volume)
o Value Area (VA)
o POC (Point of Control)
- Daily Levels (POC / VAH / VAL)
• Adds optional horizontal levels:
o POC
o VAH
o VAL
• You can choose whether to draw these:
o Today only, or
o Past days too (if enabled in your version)
• Levels can optionally extend to the right to act like HTF references.
- Hourly Profiles (Intraday context)
• Shows profiles for the last N hours (you choose).
• Meant to be used on 15m and below for clean intraday mapping.
• Optional hourly level lines are available too.
________________________________________
How It Calculates Volume
This is a bar-based approximation of a volume profile:
• Each candle’s volume is distributed across its price range based on overlap with bins.
• Flat candles (very small range) are placed into the nearest bin.
• This gives a reliable “where volume accumulated” view without needing exchange order-by-order data.
________________________________________
Key Inputs Explained
Daily Profile (Always Visible)
• Days back to show (Daily)
How many previous daily profiles you want displayed.
• Daily bins
Higher bins = more detail (but higher object usage).
• Daily Value Area %
Default 70% like traditional VP.
• Daily profile width (% of day)
Controls how wide the histogram is inside the day.
• Daily profile side
Left or Right inside each day.
• Show Daily POC/VAH/VAL lines
Enable level lines.
• Extend Daily levels to the right
Makes daily levels act like forward HTF liquidity/targets.
Hourly Profile (15m and below)
• How many hours
Number of hourly profiles to display.
• Hourly bins
• Hourly profile width (% of hour)
• Hourly profile side
• Show Hourly POC/VAH/VAL lines
________________________________________
Best Use Cases
- Intraday trading (scalping + day trading)
- Mapping premium/discount volume build-ups
- Pairing with:
• liquidity sweeps
• order blocks
• HTF levels
• session ranges
• breaker / mitigation concepts
________________________________________
Recommended Settings (Practical)
If you want more daily history, you must balance line budget.
Example setups:
“Clean Daily Focus” (more days)
• Daily bins: 60–80
• Days back: 10–20
• Hours: 0–4 (or lower)
• Budget mode: Daily First
“Intraday Heavy” (more hourly detail)
• Hourly bins: 30–50
• Hours: 8–12
• Days back: 3–7
• Budget mode: Hourly First
________________________________________
Notes / Limitations
• Hourly profiles are designed for ≤ 15m timeframes.
• This uses approximate volume distribution from candle ranges (not exchange tick VP).
• If volume data is missing on the symbol/broker, results will be less meaningful.
• Visual output depends on instrument liquidity + chart zoom.

VWAP and IVP Volatility Screener AlertVWAP and IVP Volatility Screener Alert is a multi-asset, institutional-grade market scanner that combines Auto-Anchored VWAP, Implied Volatility Percentile (IVP), Choppiness Index, Strike Price Structure, and Volume Profile (POC / Value Area) to generate high-probability trade signals across multiple symbols.
Designed for traders who rely on volatility regimes, VWAP interactions, trend confirmation, and strike-based price behavior, this tool automatically evaluates up to 10 assets simultaneously and displays actionable BUY/SELL conditions in a unified dashboard and screener panel.
Key Features
1. Multi-Asset Screener (10 Symbols)
Scans FX, indices, commodities, and metals. Displays RSI, ADX, trend, score, volatility regime, VWAP/POC/Value Area position, IVP, and Choppiness. Custom strike increments per asset.
2. Auto-Anchored VWAP System
Auto anchors by Session, Day, Week, Month, or Auto. Includes VWAP bands and bounce detection to show when price is Above, Below, or interacting with VWAP.
3. Volume Profile + POC / Value Area
Generates intraday/session POC, VAH, and VAL. Detects breaks, retests, and bounce signals.
4. IV Percentile (IVP) Engine
Converts realized volatility into IVP and classifies regimes (EXT.HI → EXT.LO). Supports Favorable, Extreme, and High-Volatility modes for different trading styles.
5. Choppiness Index (CHOP)
Identifies trending vs ranging conditions and feeds directly into scoring and alerts.
6. 11-Criteria Alert System
Alert logic includes RSI, ADX, trend, volume, VWAP, POC/VA, strike proximity, std-dev breaks, IVP, CHOP, and score thresholds. Supports Score-Based or Multi-Criteria modes.
7. Price-to-Strike Mapping
Rounds price to the correct strike ladder, detecting reversals, continuation, breakout levels, and helping frame stop-loss/TP zones.
8. Session-Aware Filtering
Filters signals for Asian, London, and NY sessions with custom timezone support.

Consolidation Value Zones (Recio)Consolidation Value Zones introduces an original algorithm to identify consolidation ranges and locate areas of importance within them. This new method "looks" at the chart and draws zones based on price with the goal of producing actionable zones which appear natural, as if they were found through a human analysis.
> Consider the following...
The chart image above displays Bitcoin, at no specific date, for no specific reason. What I have done here is simply glanced at the chart for about 5 seconds, and circled a few areas which stood out as "obvious" consolidation. It does not take a savant to look at a chart and circle ranging price. However, what we have just done defies many common systems for identifying consolidation. We have located ranges of various zone lengths, as small as roughly 25 bars to as large as roughly 100 bars. Regardless of this, we still determined these zones with our eyes and brain in a few seconds, for some it's practically instant. The issue with us humans doing this, is that we are subjective. We did not really use any concrete rules to determine these areas with our eyes. So the problem becomes "How do we identify these zones in a way which seems natural to us with a repeatable system?" Because of this, my approach is simply a logical attempt to reverse engineer our human intuition.
> Consolidation Value Zones
The name of this indicator is generic. To dissect it, we are identifying consolidation ranges, then using a volume profile to determine the value zone within that range. The specific method used to identify these consolidation zones is something I've personally been referring to as the "skewer" method. Another name that may fit better is "Linear Range Alignment/Overlap".
Ultimately, the goal is to locate a single price level or range that overlaps many adjacent bars.
This should, in theory, return areas of visually obvious consolidation.
> The Skewer Method (Identification Method & Bar Gap Allowances)
One consistent concept across the different identification methods for determining consolidation is time. How long do we chop around before calling it consolidation? This is the "Identification Threshold". Once we have located a consolidation zone "this" wide, we will then consider it as consolidation.
In the chart image above, we are considering a six-bar consolidation formation. The figure on the left shows an example of a perfect raw bar overlap, we can see that the six bars all overlap at one price range. This is a perfect example of what we are looking to identify as consolidation. Unfortunately, if this was all we looked at, we would have a very scarce identification method.
For that reason, we have the example on the right, which shows the additional allowances for the identification of these ranges. At most, the example on the right shows a gapless three-bar overlap. However, if we allow the identification to bridge across the gaps, we are able to draw a zone directly through the center and still be within our parameters. This allowance is the "Bar Gap Allowance" and will determine the leniency of the identification.
Between our identification threshold and bar gap allowance, we can start to piece together how the script is "looking" at our chart.
> Detecting Consolidation (Live Detection)
To aid in transparency and user understanding, the live detection calculation can be seen on the chart as a box, skewering the recent historical bars with a number next to it, indicating the number of bars found as potential consolidation.
As we can see in the chart image above, the script, by default, is looking for a 15-bar consolidation, with a 5-bar gap allowance. In the image, the specific gap count is labeled, we can see the script scan backwards as far as it can before counting five gaps in the data. Once that occurs, the detection stops.
Notice how the zone found is a range, consisting of all price levels which meet the parameters. The lower level of the range only had two gaps, but the upper level reached five.
> Consolidation Range and Value Zones (Volume Profiles)
Once the script has identified the consolidation formation, it calculates a volume profile across the identified consolidation range. From this it calculates and draws the Point of Control (POC) and Value Area in addition to the full consolidation range.
Once we have our zones drawn, and understand what they identify, we can go one step further and apply concepts from volume profile trading.
Range High/Low: Displays the current extent of the identified consolidation.
Value High/Low: Shows the specific area within the consolidation where buyers and sellers found the most value.
POC: The single point, where the most volume was transacted during consolidation.
In a balanced market, we would anticipate price to rotate around POC, oscillating from Value High (VAH) to Value Low (VAL). In contrast, a market in motion moves directionally, building volume at new price levels as value, naturally the POC shifts with it.
> Zone Extensions
Unlike many other scripts, there is no mitigation logic at play here, since crossing a zone simply tells us "buyers and sellers are not currently active here", but it does not guarantee that value cannot return or react from previous areas of value.
Obviously the current zone will always be most relevant, but historical zones can retain relevance depending on the context of the market.
Remember: Each area of consolidation is an area where buyers and sellers were once facing off, resulting in price's consolidation. Amidst this, the value zone was the area of greatest agreement between the participants at that time. When moving outside of a range, we would typically look at historical value areas and price's interaction with them for further context.
Due to the ever changing market, there is no fixed extension lookback that will cover every scenario. By default, the Extension Lookback is "1", meaning the script will extend the most recent zone forward until a new zone is detected.
Note: For clarity, zone extensions are colored differently from core zones.
The following chart image shows a few examples of these unique interactions.
As seen in the chart image, looking to previous areas of value as well as POC can provide context in the form of acceptance or rejection at these levels, providing further insight into the auction for us to respond to.
The zones do contain logic to maintain a clean display. By default, the zones extend conditionally when price returns to the previous consolidation range. If desired, the zones can be extended regardless of price action; this can be toggled with the option "Regardless Extension Mode", as seen below.
> Hollow Candles & Zone Merging
When consolidation is identified, a hollow candle is drawn; these can be used to see exactly when each zone is identified. It is important to understand that consolidation zones stemming from the same origin are merged into one zone. This is a frequent occurrence when the consolidation threshold is passed, but the consolidation continues. For this reason you will often see multiple hollow candles in the later areas of the zones.
Similarly, zones from different origin points that overlap are also merged into one consolidation zone. This ensures that no core zones overlap.
Additionally, every time a zone is merged, a new volume profile for the area is calculated.
> Bar Gap Allowance Type (Technical Explanation)
The specific bar gap allowance value can be altered, but so can the type of allowance being used. While some analyses may benefit from counting the total amount of bar gaps within the consolidation, others may benefit from detecting based on consecutive bar gaps.
The chart image above displays the gap counts for each gap allowance type.
The total bar gap allowance type will count until the gap amount is reached, then terminate detection once the allowed number of gaps has been exceeded.
The consecutive bar gap allowance type resets its count once it finds a valid bar within range, by doing so, it only counts the bars that separate each island of in-range bars.
Both methods have merit.
> Implementation
This identification method has proven effective to identify consolidation across market types. As a result, there cannot be one configuration of settings to fit every application. Adapting the detection type and method for each trader's specific market conditions is highly recommended.
When determining parameters, it is helpful to consider time, as it plays a major role in the identification method.
On a 1D chart, the default threshold of 15 corresponds to 15 days, or about 3 weeks depending on the ticker. To identify periods of one-week consolidation, a threshold of 5 would be suitable. To detect perfect gapless weeks, a bar gap allowance of 0 could be used, as seen in the chart image below.
Additional Example:
In the chart image above, we see a 15-second forex chart over the span of a few hours. The detection parameters are set up to detect 15-minute consolidation with a 2-minute max dead zone (consecutive bar gap).
> Detection Source
By default, the script detects consolidation ranges using the full extent of candle wicks. While this is traditional, detection can also be done using only the candle bodies. These identifications are much more nuanced, detecting only from confirmed candle price action; they do not trigger at the same frequency as wick detection.
Optionally, a "Wick/Body Average" can be chosen as the source for detection; as the name implies, this uses the average value between the candle body and its respective wick.
> Additional Settings
The settings mentioned thus far serve as core parameters for identifying consolidation. The following parameters are simply included for the benefit of the advanced user. It is not recommended to adjust these settings under normal circumstances.
- Value Area Percent: Default = 68.26, while traditionally 70 for volume profiles, 68.26 is accurate to the values of a standard bell-curve distribution. The differences are minimal in application.
- VP Rows: Default = 99, Sets the number of rows to be used when calculating the Volume Profiles (VP); note that higher values will lead to a slower calculation. Max value: 999
> Final Notes
If you have made it this far, thank you for reading.
I hope you find value in this new consolidation identification system and understand the logic behind it.
That's it.
Skrip berbayar

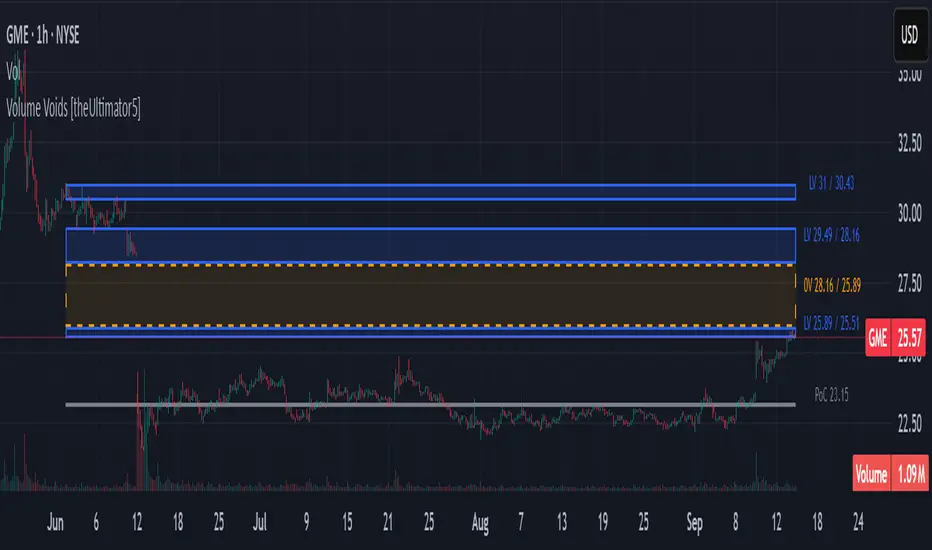
Volume Voids [theUltimator5]Volume Voids highlights price regions with no or unusually thin participation over a chosen lookback. It bins the lookback’s full price range into equal steps, assigns each bar’s close to a bin, and accumulates volume per bin. Contiguous runs of zero-volume bins are shown as “voids,” while low-volume runs (below a dynamic threshold) mark thin-liquidity “corridors” where price often traverses quickly when revisited.
An optional PoC (Point of Control) line marks the mid-price of the highest-volume bin—commonly treated as a recent “value” area that price may revisit.
What it draws on your chart
Histogram (optional): Right-anchored horizontal volume-by-price bars built from your lookback and bin count. Bars tint green→red via a simple delta proxy (up-bar volume minus down-bar volume) to hint at directional participation inside each price band.
Point of Control (optional): A horizontal line at the highest-volume bin’s mid-price (the PoC).
Zero-Volume Voids: Translucent boxes where no bin volume printed within the window (detected between the first and last non-empty bins ).
Low-Volume Zones: Translucent boxes where bin volume is below a dynamic threshold (see formula below), often acting like low-friction corridors.
How it works
Slice the lookback’s high→low into N equal price bins.
Assign each bar’s closing price to a bin and add that bar’s volume to the bin total. A simple up/down-bar delta proxy drives the histogram’s tinting.
PoC = bin with the maximum accumulated volume.
Zero-Volume Voids = contiguous runs of bins with exactly zero volume (bounded by the first/last occupied bins).
Low-Volume Zones = contiguous runs of bins with volume below:
threshold = total_window_volume ÷ (divisor × number_of_bins)
Lower divisor → more LV boxes; higher divisor → stricter/fewer boxes.
Note: This is a lightweight, chart-native approximation of a volume profile. Volume is binned by bar close (not by tick-level prints or intrabar distribution), so “voids”/“thin” areas reflect this approximation.
Key inputs
Lookback Period: Window for calculations.
Number of Volume Boxes (bins): Histogram resolution.
PoC / Show Histogram / Anchor to Right Side: Visibility and layout controls.
Low-Volume Threshold Divisor: Sensitivity for LV detection.
Colors & Labels: Customize zero-volume / low-volume box colors and optional labels with offsets.
How to use (educational, not signals)
Context: High-volume = acceptance; thin/zero-volume = inefficiency. Price often rotates near acceptance and moves faster through thin areas.
Revisits: On returns to prior voids/LV zones, watch for accelerated moves or fills; PoC can serve as a balance reference.
Confluence: Pair with trend tools (e.g., ADX), VWAP/session markers, or structure levels for timing and risk.
Limitations & performance
Bins use closing price only; intrabar distribution is not modeled.
Detections refresh on the live bar; visuals can be heavy on large lookbacks/high bin counts—reduce bins/lookback or hide labels if needed.
Composite Time ProfileComposite Time Profile Overlay (CTPO) - Market Profile Compositing Tool
Automatically composite multiple time periods to identify key areas of balance and market structure
What is the Composite Time Profile Overlay?
The Composite Time Profile Overlay (CTPO) is a Pine Script indicator that automatically composites multiple time periods to identify key areas of balance and market structure. It's designed for traders who use market profile concepts and need to quickly identify where price is likely to find support or resistance.
The indicator analyzes TPO (Time Price Opportunity) data across different timeframes and merges overlapping profiles to create composite levels that represent the most significant areas of balance. This helps you spot where institutional traders are likely to make decisions based on accumulated price action.
Why Use CTPO for Market Profile Trading?
Eliminate Manual Compositing Work
Instead of manually drawing and compositing profiles across different timeframes, CTPO does this automatically. You get instant access to composite levels without spending time analyzing each individual period.
Spot Areas of Balance Quickly
The indicator highlights the most significant areas of balance by compositing overlapping profiles. These areas often act as support and resistance levels because they represent where the most trading activity occurred across multiple time periods.
Focus on What Matters
Rather than getting lost in individual session profiles, CTPO shows you the composite levels that have been validated across multiple timeframes. This helps you focus on the levels that are most likely to hold.
How CTPO Works for Market Profile Traders
Automatic Profile Compositing
CTPO uses a proprietary algorithm that:
- Identifies period boundaries based on your selected timeframe (sessions, daily, weekly, monthly, or auto-detection)
- Calculates TPO profiles for each period using the C2M (Composite 2 Method) row sizing calculation
- Merges overlapping profiles using configurable overlap thresholds (default 50% overlap required)
- Updates composite levels as new price action develops in real-time
Key Levels for Market Profile Analysis
The indicator displays:
- Value Area High (VAH) and Value Area Low (VAL) levels calculated from composite TPO data
- Point of Control (POC) levels where most trading occurred across all composited periods
- Composite zones representing areas of balance with configurable transparency
- 1.618 Fibonacci extensions for breakout targets based on composite range
Multiple Timeframe Support
- Sessions: For intraday market profile analysis
- Daily: For swing trading with daily profiles
- Weekly: For position trading with weekly structure
- Monthly: For long-term market profile analysis
- Auto: Automatically selects timeframe based on your chart
Trading Applications for Market Profile Users
Support and Resistance Trading
Use composite levels as dynamic support and resistance zones. These levels often hold because they represent areas where significant trading decisions were made across multiple timeframes.
Breakout Trading
When composite levels break, they often lead to significant moves. The indicator calculates 1.618 Fibonacci extensions to give you clear targets for breakout trades.
Mean Reversion Strategies
Value Area levels represent the price range where most trading activity occurred. These levels often act as magnets, drawing price back when it moves too far from the mean.
Institutional Level Analysis
Composite levels represent areas where institutional traders have made significant decisions. These levels often hold more weight than traditional technical analysis levels because they're based on actual trading activity.
Key Features for Market Profile Traders
Smart Compositing Logic
- Automatic overlap detection using price range intersection algorithms
- Configurable overlap thresholds (minimum 50% overlap required for merging)
- Dead composite identification (profiles that become engulfed by newer composites)
- Real-time updates as new price action develops using barstate.islast optimization
Visual Customization
- Customizable colors for active, broken, and dead composites
- Adjustable transparency levels for each composite state
- Premium/Discount zone highlighting based on current price vs composite range
- TPO aggression coloring using TPO distribution analysis to identify buying/selling pressure
- Fibonacci level extensions with 1.618 target calculations based on composite range
Clean Chart Presentation
- Only shows the most relevant composite levels (maximum 10 active composites)
- Eliminates clutter from individual session profiles
- Focuses on areas of balance that matter most to current price action
Real-World Trading Examples
Day Trading with Session Composites
Use session-based composites to identify intraday areas of balance. The VAH and VAL levels often act as natural profit targets and stop-loss levels for scalping strategies.
Swing Trading with Daily Composites
Daily composites provide excellent swing trading levels. Look for price reactions at composite zones and use the 1.618 extensions for profit targets.
Position Trading with Weekly Composites
Weekly composites help identify major trend changes and long-term areas of balance. These levels often hold for months or even years.
Risk Management
Composite levels provide natural stop-loss levels. If a composite level breaks, it often signals a significant shift in market sentiment, making it an ideal place to exit losing positions.
Why Composite Levels Work
Composite levels work because they represent areas where significant trading decisions were made across multiple timeframes. When price returns to these levels, traders often remember the previous price action and make similar decisions, creating self-fulfilling prophecies.
The compositing process uses a proprietary algorithm that ensures only levels validated across multiple time periods are displayed. This means you're looking at levels that have proven their significance through actual market behavior, not just random technical levels.
Technical Foundation
The indicator uses TPO (Time Price Opportunity) data combined with price action analysis to identify areas of balance. The C2M row sizing method ensures accurate profile calculations, while the overlap detection algorithm (minimum 50% price range intersection) ensures only truly significant composites are displayed. The algorithm calculates row size based on ATR (Average True Range) divided by 10, then converts to tick size for precise level calculations.
How the Code Actually Works
1. Period Detection and ATR Calculation
The code first determines the appropriate timeframe based on your chart:
- 1m-5m charts: Session-based profiles
- 15m-2h charts: Daily profiles
- 4h charts: Weekly profiles
- 1D charts: Monthly profiles
For each period type, it calculates the number of bars needed for ATR calculation:
- Sessions: 540 minutes divided by chart timeframe
- Daily: 1440 minutes divided by chart timeframe
- Weekly: 7 days worth of minutes divided by chart timeframe
- Monthly: 30 days worth of minutes divided by chart timeframe
2. C2M Row Size Calculation
The code calculates True Range for each bar in the determined period:
- True Range = max(high-low, |high-prevClose|, |low-prevClose|)
- Averages all True Range values to get ATR
- Row Size = (ATR / 10) converted to tick size
- This ensures each TPO row represents a meaningful price movement
3. TPO Profile Generation
For each period, the code:
- Creates price levels from lowest to highest price in the range
- Each level is separated by the calculated row size
- Counts how many bars touch each price level (TPO count)
- Finds the level with highest count = Point of Control (POC)
- Calculates Value Area by expanding from POC until 68.27% of total TPO blocks are included
4. Overlap Detection Algorithm
When a new profile is created, the code checks if it overlaps with existing composites:
- Calculates overlap range = min(currentVAH, prevVAH) - max(currentVAL, prevVAL)
- Calculates current profile range = currentVAH - currentVAL
- Overlap percentage = (overlap range / current profile range) * 100
- If overlap >= 50%, profiles are merged into a composite
5. Composite Merging Logic
When profiles overlap, the code creates a new composite by:
- Taking the earliest start bar and latest end bar
- Using the wider VAH/VAL range (max of both profiles)
- Keeping the POC from the profile with more TPO blocks
- Marking the composite as "active" until price breaks through
6. Real-Time Updates
The code uses barstate.islast to optimize performance:
- Only recalculates on the last bar of each period
- Updates active composite with live price action if enabled
- Cleans up old composites to prevent memory issues
- Redraws all visual elements from scratch each bar
7. Visual Rendering System
The code uses arrays to manage drawing objects:
- Clears all lines/boxes arrays on every bar
- Iterates through composites array to redraw everything
- Uses different colors for active, broken, and dead composites
- Calculates 1.618 Fibonacci extensions for broken composites
Getting Started with CTPO
Step 1: Choose Your Timeframe
Select the period type that matches your trading style:
- Use "Sessions" for day trading
- Use "Daily" for swing trading
- Use "Weekly" for position trading
- Use "Auto" to let the indicator choose based on your chart timeframe
Step 2: Customize the Display
Adjust colors, transparency, and display options to match your charting preferences. The indicator offers extensive customization options to ensure it fits seamlessly into your existing analysis.
Step 3: Identify Key Levels
Look for:
- Composite zones (blue boxes) - major areas of balance
- VAH/VAL lines - value area boundaries
- POC lines - areas of highest trading activity
- 1.618 extension lines - breakout targets
Step 4: Develop Your Strategy
Use these levels to:
- Set entry points near composite zones
- Place stop losses beyond composite levels
- Take profits at 1.618 extension levels
- Identify trend changes when major composites break
Perfect for Market Profile Traders
If you're already using market profile concepts in your trading, CTPO eliminates the manual work of compositing profiles across different timeframes. Instead of spending time analyzing each individual period, you get instant access to the composite levels that matter most.
The indicator's automated compositing process ensures you're always looking at the most relevant areas of balance, while its real-time updates keep you informed of changes as they happen. Whether you're a day trader looking for intraday levels or a position trader analyzing long-term structure, CTPO provides the market profile intelligence you need to succeed.
Streamline Your Market Profile Analysis
Stop wasting time on manual compositing. Let CTPO do the heavy lifting while you focus on executing profitable trades based on areas of balance that actually matter.
Ready to Streamline Your Market Profile Trading?
Add the Composite Time Profile Overlay to your charts today and experience the difference that automated profile compositing can make in your trading performance.

Value Matrix – Previous Day VAValue Matrix – Previous Day Volume Profile Indicator
Description:
The Value Matrix – Previous Day VA indicator plots the previous trading session’s Volume Profile key levels directly on your chart, providing clear reference points for intraday trading. This indicator calculates the Value Area High (VAH), Value Area Low (VAL), and Point of Control (POC) from the prior session and projects them across the current trading day, helping traders identify potential support, resistance, and high-volume zones.
Features:
Calculates previous day VAH, VAL, and POC based on a user-defined session (default 09:30–16:00).
Uses Volume Profile bins for precise distribution calculation.
Fully customizable line colors for VAH, VAL, and POC.
Lines extend across the current session for easy intraday reference.
Works on any timeframe, optimized for 1-minute charts for precision.
Optional toggles to show/hide VAH, VAL, and POC individually.
Inputs:
Session Time: Define the trading session for which the volume profile is calculated.
Profile Bins: Number of price intervals used to divide the session range.
Value Area %: Percentage of volume to include in the value area (default 70%).
Show POC / VAH & VAL: Toggle visibility of each level.
Line Colors: Customize VAH, VAL, and POC colors.
Use Cases:
Identify previous session support and resistance levels for intraday trading.
Gauge areas of high liquidity and potential market reaction zones.
Combine with other indicators or price action strategies for improved entries and exits.
Recommended Timeframe:
Works on all timeframes; best used on 1-minute or 5-minute charts for precise intraday analysis.

Piman2077: Previous Day Volume Profile levelsPrevious Day Volume Profile Indicator
Description:
Previous Day Volume Profile Indicator plots the previous trading session’s Volume Profile key levels directly on your chart, providing clear reference points for intraday trading. This indicator calculates the Value Area High (VAH), Value Area Low (VAL), and Point of Control (POC) from the prior session and projects them across the current trading day, helping traders identify potential support, resistance, and high-volume zones.
Features:
Calculates previous day VAH, VAL, and POC based on a user-defined session (default 09:30–16:00).
Uses Volume Profile bins for precise distribution calculation.
Fully customizable line colors for VAH, VAL, and POC.
Lines extend across the current session for easy intraday reference.
Works on any timeframe, optimized for 1-minute charts for precision.
Optional toggles to show/hide VAH, VAL, and POC individually.
Inputs:
Session Time: Define the trading session for which the volume profile is calculated.
Profile Bins: Number of price intervals used to divide the session range.
Value Area %: Percentage of volume to include in the value area (default 68%).
Show POC / VAH & VAL: Toggle visibility of each level.
Line Colors: Customize VAH, VAL, and POC colors.
Use Cases:
Identify previous session support and resistance levels for intraday trading.
Gauge areas of high liquidity and potential market reaction zones.
Combine with other indicators or price action strategies for improved entries and exits.
Recommended Timeframe:
Works on all timeframes; best used on 1-minute or 5-minute charts for precise intraday analysis.

Smart Money Volume Execution Footprint @MaxMaserati 2.0 Smart Money Volume Execution Footprint @MaxMaserati 2.0
Volume and Price Execution Tracker · Volume Delta · VWAP · POC · DOM Simulation
Overview
This volume and price tool high grade tool reveals **where** smart money is actually executing within each candle — not just how much volume traded, but the **exact price levels** where large buy/sell orders hit the tape.
By simulating Depth of Market (DOM) logic, it breaks each candle into price levels (default: 8–20) and reconstructs intra-candle volume pressure to identify:
• Institutional execution zones
• Buy vs Sell dominance
• Volume-weighted positioning
• Smart money flow bias (bullish / bearish / neutral)
Think of it as a powerful X-ray footprint to spot real-time volume/price behavior.
Core Features
Execution Dots (Smart Money Signatures)
• Plots dots at key institutional execution prices
• Color-coded: 🟢 Green = dominant buy volume · 🔴 Red = dominant sell volume
• Dot size = Volume Intensity (relative to average):
– tiny < 1.0x avg
– small 1.0x–1.5x
– normal 1.5x–2.5x
– large 2.5x–4.0x
– huge > 4.0x (massive positioning)
Volume Modes (Buy/Sell Breakdown)
• Total Volume Mode: Combined buy + sell volume at each price level
• Volume Delta Mode: Net buy/sell pressure (buy − sell)
Dot Placement Modes
• Volume POC: Dot at level with highest volume (Point of Control)
• VWAP: Dot at intra-candle volume-weighted average price
• Highest Volume Level: Similar to POC, simplified for fast bias detection
Smart Money Bias Detection
Real-time consensus calculation based on buy/sell volume ratio:
🟢 Bullish Consensus (>60% Buy Volume): Smart money buying → Long bias
🔴 Bearish Consensus (<40% Buy Volume): Smart money selling → Short bias
⚪ Neutral Market (40–60%): Market in balance → Wait for breakout
This logic powers the volume execution table, showing institutional sentiment per candle.
Dot Placement Example (How It Works)
Let’s say you break a candle into 10 price levels:
• Volume POC Mode → Dot at \$4,297.50, where volume was highest
• VWAP Mode → Dot around \$4,275, the volume-weighted average
• Volume Delta Mode → Dot where net buying/selling pressure peaked
Dot sizes based on volume intensity:
Level 1 (400K): size.huge — heavy institutional execution
Level 10 (300K): size.normal — passive accumulation
Level 5 (250K): size.normal — potential battle zone
🔗 Optional Visual Enhancements
• Zigzag Lines: Connects execution dots to highlight flow direction
• Labels: Toggle to show volume and/or execution price directly on dots
• Execution Table: Real-time snapshot of volume ratio, delta, and institutional bias
Option to see the volume and/or exact Price level
Ideal Use Cases
Institutional Flow Strategy
1. Look for large dots (size.large or size.huge)
2. Confirm direction with bias table (bullish or bearish consensus)
3. Align entries with institutional execution zones
4. Use retests of large dot prices as entries or exits
Option to only see huge buying and selling area to solely focus on them for retest
Volume Divergence Signals
• Price making new highs, but dot size shrinking → Weak breakout
• Price making new lows, but weak dot volume → Potential bounce
• Huge dot + rejection wick → Institutional defense zone
Configurable Settings
• Dot Placement: VWAP · POC · Delta
• Volume Mode: Total vs Delta
• Price Granularity: 5 to 50 levels per candle
• Dot Labels: Volume / Price
• Table Size, Position, and Color Themes
Important Notes
• Best used on high-volume markets (futures, indices, major FX pairs)
• Ideal timeframe: 1m–15m for precision, 1h–4h for position setups
• Integrates well with VWAP, session levels, or structure-based trading

Volume Range Map [BigBeluga]This volume-based tool identifies the highest and lowest price extremes within a lookback period and constructs two dynamic range zones. Each zone is filled with horizontal volume profiles that visualize the distribution of traded volume across price bins, helping traders pinpoint key areas of accumulation and distribution.
🔵Key Features:
Dynamic High/Low Zones:
➣ Automatically detects the highest and lowest price levels within a custom lookback window.
➣ Draws two shaded zones: one near the high and one near the low, representing potential supply and demand areas.
Volume Profiles per Zone:
➣ Each zone is filled with a volume profile histogram divided into bins.
➣ The length of each horizontal bar represents the relative volume traded at that price level.
➣ Bins collectively account for 100% of the zone’s volume.
POC Highlighting:
➣ The price bin with the highest volume is marked as the Point of Control (POC), along with a label showing its share of total volume in percentage.
➣ A dashed line is drawn at the middle level of the zone.
Customizable Display:
➣ Traders can adjust the number of bins, zone width, and toggle midline visibility to match their strategy needs.
➣ Colors of upper and lower volume zones are fully customizable.
🔵Usage:
Supply/Demand Analysis: Use upper/lower volume zones to find key reversal or continuation areas where market participants were most active.
Volume Confirmation: Confirm breakout or rejection trades by watching how price reacts to high-volume areas inside each zone.
POC Strategy: Treat POC levels as magnet zones — price tends to revisit them due to high liquidity.
Trade Planning: Use volume-weighted levels instead of raw price action to plan entries, stop-losses, and targets.
Volume Range Map offers a clean and powerful way to analyze volume distribution at price extremes. By combining precise volume histograms, POC highlights, and adaptive zone drawing, it brings market structure into sharper focus for range and breakout traders alike.

RSI with Trend LinesThe RSI with Trend Lines indicator is a tool designed to analyze the behavior of the Relative Strength Index (RSI) combined with dynamic trend lines. This indicator not only provides the standard RSI reading but also identifies pivot points on the RSI and draws bullish and bearish trend lines based on these points. It also includes customizable options for adjusting trend lines, displaying the RSI moving average, and highlighting key levels such as overbought, oversold, and the center line.
This indicator is ideal for finding and identifying clear trends in the RSI and taking advantage of market breakout or consolidation signals. It also includes a table with the POC value, which represents the price level at which the most trading activity has occurred, indicating the highest liquidity and highest trading volume.
Key Features:
1. Basic RSI:
• Calculates the RSI using a configurable period length (default 14).
• Colors the RSI based on its direction (green for rising, red for falling) and its position relative to the center line (50).
2. Key Levels:
• Displays overbought (70 and 80), oversold (20 and 30), and the center line (50) levels for easy visual interpretation.
3. RSI Moving Average:
• Enables and configures an RSI moving average (SMA, EMA, WMA, or ALMA) to smooth out fluctuations and detect clearer trends.
4. Dynamic Trend Lines:
• Identifies pivot points on the RSI and draws bullish and bearish trend lines.
• Trend lines can be extended into the future or limited to the visible range.
• Includes options to display broken lines (trends that are no longer valid) and customize the style (solid or dashed).
5. Pivot Points:
• Displays the high and low pivot points on the chart for a better understanding of trend changes.
6. Advanced Customization:
• Adjust the pivot point period.
• Control the number of pivot points to consider for trend lines.
• Customize the line thickness and style.
How to Use the Indicator:
1. RSI Interpretation:
• Overbought Zone (RSI > 70): Indicates that the asset may be overvalued and could correct downward.
• Oversold Zone (RSI < 30): Suggests that the asset may be undervalued and could rebound.
• Centerline Crossover (50): A cross above 50 indicates bullish strength, while a cross below suggests weakness.
2. Trend Lines:
• Bullish Lines: Drawn when the RSI forms ascending low pivot points. These lines represent dynamic support.
• Bearish Lines: These are drawn when the RSI forms descending high pivot points. These lines represent dynamic resistance.
• Broken Lines: When a trend line becomes invalid (the RSI breaks the line), they are displayed in a dotted style to highlight the breakout.
3. Possible Trading Signals:
• Buy: When the RSI breaks an upward downtrend line.
• Sell: When the RSI breaks a downward uptrend line.
• Trend Confirmation: When the RSI stays within a valid trend line, it suggests that the current trend is strong.
4. A chart with the POC value:
• The point of control is a price level at which the highest trading volume occurs in a given time period. It is a key component of the Volume Profile indicator, which displays volume by price.
• Use of the POC in trading:
• The POC is used to identify areas of high interest and liquidity for trading.
• The POC provides information about the equilibrium point where buyers and sellers are most evenly matched.
• Therefore, it can be considered a zone of interest, meaning it can act as support or resistance.

TPO IQ [TradingIQ]Hello Traders!
Introducing "TPO IQ"!
TPO IQ offers a Time Price Opportunity profile with several customization options that packs several related features to help traders navigate the generated profiles!
Features
TPO Profiles
Single Print identification
Initial Balance Identification
Can be anchored to timeframe change
Can be anchored to fixed time interval
Last profile detailed visuals
Customizable value area percentage
POC identification
Mid-point identification
TPO Profiles
A TPO profile is a market profile visualization that details how much time was spent at each price level throughout the time interval.
The image above further explains what a TPO Profile is!
Each letter corresponds to a candlestick. With this information, traders are able to visualize how much time was spent at each price area.
With customizable gradient colors, specifically in this example, blocks colored red are the earliest times in the profile, blocks colored green are in the beginning half of the time midpoint of the profile. Blue blocks represent the first half of the end of the time period, and purple blocks correspond to the end of the time period.
Please note that this form of TPO profile generation will only occur when the most recent profile uses less than 500 alphabet characters! If more than 500 characters are preset, TPO IQ will revert to using labels!
Initial Balance
TPO IQ also identifies the initial balance range and all alphabet characters that form within it!
The image above exemplifies this feature. The initial balance range is denoted by a a neon-blue line, with a blue circle showing the opening price. All characters within the initial balance range are highlighted blue, which is a feature that can be disabled with customizable colors.
POC
TPO IQ also identifies the point of control (POC) of the TPO Profile.
The point of control for the profile is labeled yellow by default, and shows where price spent the most time throughout the time period.
The image above shows the POC for the time period being identified by TPO IQ.
Value Area
TPO IQ also identifies the value area of the profile. A customizable percentage that is 70% by default, the value area of a TPO profile shows where price traded the majority of the time.
The image above further explains this feature. For this example, with the value area percentage being set to 70%, the value area high and value area low show the price zone that prices traded at 70% of the time throughout the profile.
TPO Midpoint
In addition to the POC, the TPO profile midpoint is also identified by TPO IQ.
The TPO midpoint simply corresponds to the middle price between the session's high and low!
Fixed Interval Mode
By default, TPO IQ recalculates every day, but this can also be changed to a customizable session time, such as 4 hours. If 4 hours is selected, then a new TPO profile will be generated every 4 hours.
However, in Fixed Interval mode, a TPO profile will be generated through a user-defined time range, such as 1300-1700.
In the image above, Fixed Interval mode is applied with a time range of 1300-1700 and, consequently, TPO IQ generates a new profile throughout every 1300-1700 time range!
This feature allows traders to specify time ranges of interest to generate TPO profiles for!
TPO Overview Label
The TPO overview label shows key statistics for the TPO profile generated throughout the trading session!
The "TPO Count" statistic shows how many alphabetical letters were generated for the profile, which is an adequate method to determine the session's volatility and price range.
The "Tick Levels" statistic shows how many tick levels were used to create the profile - another method to determine the volatility and price range of the session.
The "Top Letter" statistic shows which letter appears most throughout the profile. In this example, the top letter was "f", which means throughout creation of the profile, the letter "f" appeared the most!
And that's all for now!
If you have any feedback or new feature ideas for TPO IQ please feel free to share them with us!
Thank you traders!

Volume profile [Signals] - By Leviathan [Mindyourbuisness]Market Sessions and Volume Profile with Sweep Signals - Based on Leviathan's Volume Profile
This indicator is an enhanced version of Leviathan's Volume Profile indicator, adding session-based value area analysis and sweep detection signals. It combines volume profile analysis with market structure concepts to identify potential reversal opportunities.
Features
- Session-based volume profiles (Daily, Weekly, Monthly, Quarterly, Yearly)
- Forex sessions support (Tokyo, London, New York)
- Value Area analysis with POC, VAH, and VAL levels
- Extended level visualization for the last completed session
- Sweep detection signals for key value area levels
Sweep Signals Explanation
The indicator detects two types of sweeps at VAH, VAL, and POC levels:
Bearish Sweeps (Red Triangle Down)
Conditions:
- Price makes a high above the level (VAH/VAL/POC)
- Closes below the level
- Closes below the previous candle's low
- Previous candle must be bullish
Trading Implication: Suggests a failed breakout and potential reversal to the downside. These sweeps often indicate stop-loss hunting above key levels followed by institutional selling.
Bullish Sweeps (Green Triangle Up)
Conditions:
- Price makes a low below the level (VAH/VAL/POC)
- Closes above the level
- Closes above the previous candle's high
- Previous candle must be bearish
Trading Implication: Suggests a failed breakdown and potential reversal to the upside. These sweeps often indicate stop-loss hunting below key levels followed by institutional buying.
Trading Guidelines
1. Use sweep signals in conjunction with the overall trend
2. Look for additional confirmation like:
- Volume surge during the sweep
- Price action patterns
- Support/resistance levels
3. Consider the session's volatility and time of day
4. More reliable signals often occur at VAH and VAL levels
5. POC sweeps might indicate stronger reversals due to their significance as fair value levels
Notes
- The indicator works best on higher timeframes (1H and above)
- Sweep signals are more reliable during active market hours
- Consider using multiple timeframe analysis for better confirmation
- Past performance is not indicative of future results
Credits: Original Volume Profile indicator by Leviathan
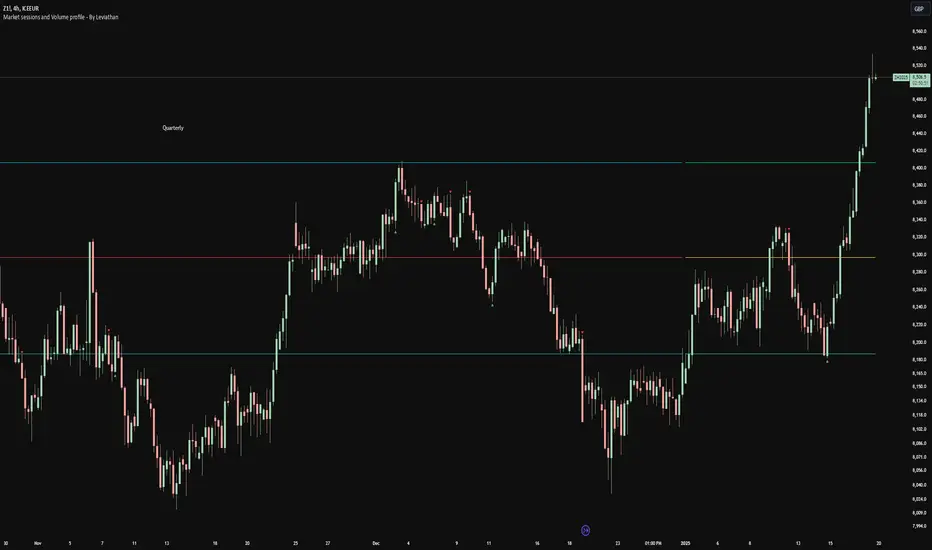
footprint_typeLibrary "footprint_type"
Contains all types for calculating and rendering footprints
Inputs
Inputs objects
Fields:
inbalance_percent (series int) : percentage coefficient to determine the Imbalance of price levels
stacked_input (series int) : minimum number of consecutive Imbalance levels required to draw extended lines
show_summary_footprint (series bool) : bool input for show summary footprint
procent_volume_area (series int) : definition size Value area
show_vah (series bool) : bool input for show VAH
show_poc (series bool) : bool input for show POC
show_val (series bool) : bool input for show VAL
color_vah (series color) : color VAH line
color_poc (series color) : color POC line
color_val (series color) : color VAL line
show_volume_profile (series bool)
new_imbalance_cond (series bool) : bool input for setup alert on new imbalance buy and sell
new_imbalance_line_cond (series bool) : bool input for setup alert on new imbalance line buy and sell
stop_past_imbalance_line_cond (series bool) : bool input for setup alert on stop past imbalance line buy and sell
Constants
Constants all Constants objects
Fields:
imbalance_high_char (series string) : char for printing buy imbalance
imbalance_low_char (series string) : char for printing sell imbalance
color_title_sell (series color) : color for footprint sell
color_title_buy (series color) : color for footprint buy
color_line_sell (series color) : color for sell line
color_line_buy (series color) : color for buy line
color_title_none (series color) : color None
Calculation_data
Calculation_data data for calculating
Fields:
detail_open (array) : array open from calculation timeframe
detail_high (array) : array high from calculation timeframe
detail_low (array) : array low from calculation timeframe
detail_close (array) : array close from calculation timeframe
detail_vol (array) : array volume from calculation timeframe
previos_detail_close (array) : array close from calculation timeframe
isBuyVolume (series bool) : attribute previosly bar buy or sell
Footprint_row
Footprint_row objects one footprint row
Fields:
price (series float) : row price
buy_vol (series float) : buy volume
sell_vol (series float) : sell volume
imbalance_buy (series bool) : attribute buy inbalance
imbalance_sell (series bool) : attribute sell imbalance
buy_vol_box (series box) : for ptinting buy volume
sell_vol_box (series box) : for printing sell volume
buy_vp_box (series box) : for ptinting volume profile buy
sell_vp_box (series box) : for ptinting volume profile sell
row_line (series label) : for ptinting row price
empty (series bool) : = true attribute row with zero volume buy and zero volume sell
Value_area
Value_area objects for calculating and printing Value area
Fields:
vah_price (series float) : VAH price
poc_price (series float) : POC price
val_price (series float) : VAL price
vah_label (series label) : label for VAH
poc_label (series label) : label for POC
val_label (series label) : label for VAL
vah_line (series line) : line for VAH
poc_level (series line) : line for POC
val_line (series line) : line for VAL
Imbalance_line_var_object
Imbalance_line_var_object var objects printing and calculation imbalance line
Fields:
cum_buy_line (array) : line array for saving all history buy imbalance line
cum_sell_line (array) : line array for saving all history sell imbalance line
Imbalance_line
Imbalance_line objects printing and calculation imbalance line
Fields:
buy_price_line (array) : float array for saving buy imbalance price level
sell_price_line (array) : float array for saving sell imbalance price level
var_imba_line (Imbalance_line_var_object) : var objects this type
Footprint_info_var_object
Footprint_info_var_object var objects for info printing
Fields:
cum_delta (series float) : var delta volume
cum_total (series float) : var total volume
cum_buy_vol (series float) : var buy volume
cum_sell_vol (series float) : var sell volume
cum_info (series table) : table for ptinting
Footprint_info
Footprint_info objects for info printing
Fields:
var_info (Footprint_info_var_object) : var objects this type
total (series label) : total volume
delta (series label) : delta volume
summary_label (series label) : label for ptinting
Footprint_bar
Footprint_bar all objects one bar with footprint
Fields:
foot_rows (array) : objects one row footprint
val_area (Value_area) : objects Value area
imba_line (Imbalance_line) : objects imbalance line
info (Footprint_info) : objects info - table,label and their variable
row_size (series float) : size rows
total_vol (series float) : total volume one footprint bar
foot_buy_vol (series float) : buy volume one footprint bar
foot_sell_vol (series float) : sell volume one footprint bar
foot_max_price_vol (map) : map with one value - price row with max volume buy + sell
calc_data (Calculation_data) : objects with detail data from calculation resolution
Support_objects
Support_objects support object for footprint calculation
Fields:
consts (Constants) : all consts objects
inp (Inputs) : all input objects
bar_index_show_condition (series bool) : calculation bool value for show all objects footprint
row_line_color (series color) : calculation value - color for row price

Period Value ZonesPeriod Value Zones is designed to help traders understand where current value is being found by splitting the day into 3 key periods based on common reversal times recognized for intraday trading.
By splitting the day into 3 periods, we can more efficiently determine where short-term value lies by using only the data we consider relevant during these periods of time.
> Overview
This indicator is recommended for low timeframe trading during the New York RTH Session.
By only trading within this session, we can ensure that volume and volatility remain fairly consistent.
Within each Period, you will find on the chart:
Value Area Points from Previous period (Value High(VAH)/Value Low(VAL)/Point of Control(POC))
Volume Weighted Average Price (VWAP) Cloud, based on High and Low values during the period.
Value Zone based Potential Reversal Zones.
Additional Displays:
Potential Reversal Detection Signals with Invalidation Levels
Forward Plotted Key Market times.
> Components
• Value Area Points
VAH/VAL/POC are important volume profile points which display where the market has previously held value.
We use these specific levels as support and resistance to confirm direction by monitoring interactions between price and these important levels.
The VAH and VAL lines change colors based on price's interaction with them to confirm whether that level should be regarded as support or resistance.
• VWAP Cloud
VWAP is a common metric used to determine the strength of a trend, and provides a point to look for re-bid & re-offer.
When price breaks out of our Fixed Value zone, VWAP helps us determine further direction.
Also included is VWAP deviation bands, for traders who would prefer to view the standard deviation away from this cloud as well.
• Value Reversal Zones
These Zones are calculated based on extensions of the Period Value Zone.
While in a balanced market, these zones have been shown to provide potential reversal opportunities.
• Potential Reversal Signals
These signals are based on an advanced method for confirming a higher-low or lower-high to reasonably create a signal that is not very laggy but also rooted in sound logic.
While helpful, These are NOT buy or sell signals, and you should always use further analysis to decide the next steps to take.
When a signal appears, an associated invalidation level is also displayed, if this level is crossed the associated signal is no longer considered relevant.
• Key Market Times
These are important times within the day that normally produce volatility caused by daily market catalysts.
Each key time is forward plotted 1 hour before it occurs to provide a clear heads up for potential opportunity.
Opening Fuel: Known for having an increase in Volume after the formation of the 15min Opening Range.
1st Reversal: Common Area for seeing initial large positioning effecting the market, often causing reversals.
Initial Balance Close: End of the first hour, a common positioning tool for futures traders.
2nd Reversal: Positioning is typically reactionary to IB Close, alongside Euro Traders Exiting Positions.
Euro Close: Close of Europe Session, a common positioning tool for futures traders.
Lunch: Usually Low Volume, traders are often out to lunch.
Lunch End: Volume tends to re-enter, as traders come back from lunch.
1st Reversal: New Hour, common area to see large position re-enter the market.
Bonds Close: Bonds markets close, Equities reacting to close of the bond market.
1st MOC: Initial Market on Close orders are places, market reaction is normally expected off of MOC positioning.
MOC Close: As MOC orders are reported, volatility is likely found within the market.
> Methodology
This indicator can be used with the same principles as trading balanced volume profiles.
Rule 1: Unless the price breaks and holds Value High or Value Low, we should expect buyers and sellers to maintain the current balance.
Rule 2: If we break and push away from the Period Value High, we should treat that level as supportive on retest unless we look back below and sellers defend on retest.
Rule 3: If we break and push away from the Period Value Low, we should treat that level as resistance on retest unless we look back above and buyers defend on retest.
Rule 4: If we recover Value Low, and it becomes supportive, we look for our Period POC and Period Value High as our targets above.
Rule 5: If we fail to hold Period Value High, and it becomes resistance, we look for our Period POC and Period Value Low as targets below.
Balance in the context of this indicator is considered as the area between Period Value High and Period Value Low
Acceptance outside of balance in the context of this indicator is considered as Period Value Low or High, becoming supportive or resistance.
> Examples
Theoretical Example:
In the bullish example below, price holds VWAP and makes POC supportive, showing interest from buyers pushing to Value High.
Real-World Example:
Below is an example of the same setup as the theoretical example, taking place on a real futures chart.
By utilizing these rules, we can look for opportunities at these levels and have a plan for how we should be interacting with them.
This will help us determine likely targets and risk-off levels that are based on volume and current "value" from participants.
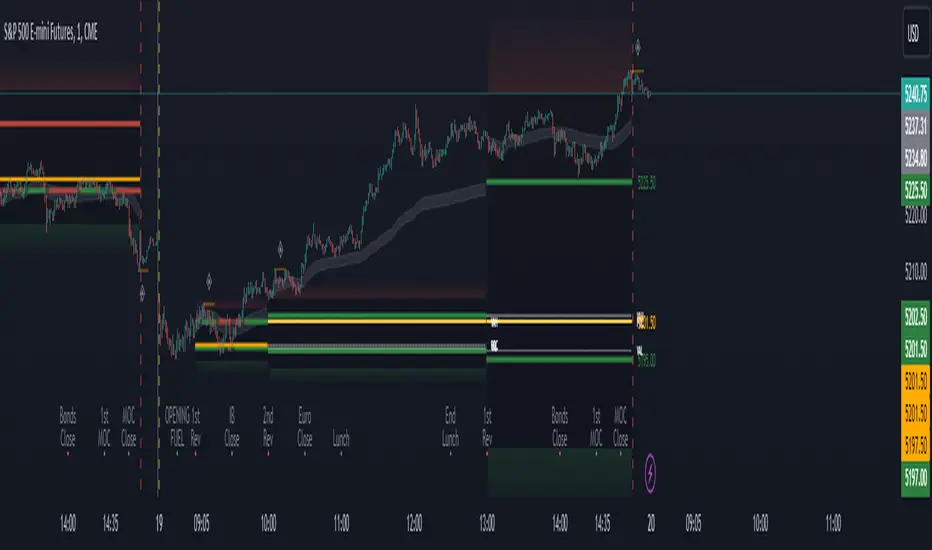
Frankie Candles Essentials [LuxAlgo]The Frankie Candles Essentials toolkit is a collection of essential features used by trader Frankie Candles. This toolkit focuses on the relationship between MTF oscillator divergences and volume profiles, allowing the detection of different kinds of reversals. Retracements from the "Golden Pocket" features are also included.
🔶 USAGE
When adding the script to your chart you will be prompted to select the calculation interval of the "Top-Down Volume Profile", simply click on your chart where you want the starting and ending points of the calculation interval.
🔹 Top-Down Volume Profile
The Top-Down Volume Profile is a classical fixed-range volume profile and highlights the amount of traded volume within equidistant price areas. The amount of areas is determined by the "Rows" setting (Note that the volume profile can use up to 250 rows).
The value area (VA) highlights the area where the specified percentage of the total volume is traded, that is the area with the most recorded trading activity relative to a selected percentage.
Finally, the point of control (POC) highlights the price level with the most trading activity.
🔹 Divergences
Users can highlight divergences made by oscillators on their charts. The toolkit includes three indicators such as RSI, MFI, and WaveTrend with MTF support, users can also select external oscillators but these will not support MTF divergence detection.
Once the Top-Down Volume Profile is set historical divergences will be affected by its value area (VA), with bearish divergences located above the upper VA or bullish divergences located under the lower VA being highlighted with a sauce can, a signature display stel of Frankie Candles.
Users can also filter out divergences based on the point of control (POC) using the "Filter According To POC" setting, with bearish divergences located below the POC or bullish divergences located above it being filtered out.
Do note that divergences are detected N bars after their occurrence, where N is the divergence lookback setting
🔹 Golden Pockets
The script includes an MTF Golden Pockets feature displaying Fibonacci retracements on the user chart, these can be used to identify optimal trade entries (OTE) or serve as support/resistance levels.
Golden Pockets are based on maximum/minimum prices in a window determined by the "Golden Pocket Lookback" setting, using longer-term lookbacks will return longer-term divergences, this will also be the case when using HTF golden pockets.
🔶 SETTINGS
🔹 Candle Coloring
Candle Coloring: Determine the candle coloring method used by the indicator. "Simple" will color the candles based on the candle body, while "Golden Pocket" will color candles using a gradient based on the golden pocket rolling maximum/minimum.
🔹 Top-Down Volume Profile
Top-Down Volume Profile: Enable Top-Down Volume Profile.
Rows: Amount of rows used by the Top-Down Volume Profile.
Width (%): Controls the histogram bar width as a percentage of the calculation window specified by the user set anchors.
Value Area (%): Area where the specified percentage of total volume is traded.
Extend To The Right: Extends the calculation window from the first anchor to the most recent bar.
🔹 MTF Divergences
Oscillator: Determines the oscillator and its length used for divergence detection. Options include "RSI", "MFI", "WaveTrend" and "External".
Divergence Lookback: Lookback period used to track oscillator tops/bottoms. Divergence will be detected n bars after an oscillator top/bottom, where n is the specified lookback period.
External Oscillator: External oscillator used for divergence detection if "External" is selected in the "Oscillator" dropdown menu, incompatible with Divergence Timeframe setting.
Divergence Timeframe: Timeframe used to calculate the selected oscillator and detect divergences. Incompatible with external oscillators.
Divergence From: Determines if price tops/bottoms evaluated to detect divergences are based on wicks (high/low price) or candle body (closing/opening price).
Filter According To POC: Filter displayed divergences based on the Top-Down Volume Profile POC.
Show Hidden: Display hidden divergences.
Show Sauce: Display canned source emoji on specific divergences.
🔹 Golden Pockets
Golden Pocket Lookback: Period used to calculate golden pockets, options include "Short-Term", "Medium-Term", and "Long-Term".
Extend: Extend Golden Pockets lines from the most recent bar by the specified amount of bars.
Golden Pocket Timeframe: Timeframe used to calculate the Golden Pockets.
Retracements: Display specific retracements, users can also control the ratio from the provided numerical setting.
Show Coordinate Line: Display a line connecting the top/bottom used to calculate the Golden Pockets.
Invert: Invert top/bottom for the Golden Pockets calculation.

Volume Profile Histogram [SS]I usually (and by usually, I mean the past year xD) release a significant indicator as my Christmas gift to the community on Christmas Eve. Last year, it was the Z-Score buy and sell signal; this year, it's something a little more conventional. So here is this year’s gift—hope you like it! 🎁
Seems like everyone has their take on Volume Profiles (aka SVP or VSP). I decided to create one, and in true Steversteves fashion, you can expect to find all the goodies that come with most of my stuff, including a volume profile presented in a bell-curve/histogram style (chart above) and statistical frequency tables showing the cases by ranges:
And it wouldn't be a true Steversteves indicator without some kind of ATR thing:
So, what does it do?
At the end of the day, it is a form of an SVP indicator. However, it is meant to operate on a larger scale, sorting volume in a traditional bell-curve style. In addition to displaying volume, it breaks down buying vs. selling volume. Selling volume is classified as such when the open is greater than close, while buying is when close is greater than open. This breakdown allows you to see the distribution, by price range, of where selling and buying occur.
This permits the indicator to provide 2 Points of Control (POCs). A POC is defined as an area of high volume activity. Because buying and selling volumes are broken down into two, we can identify areas with high selling and areas with high buying. Sometimes they coincide, sometimes they differ.
If we look at SQQQ, for example:
We can see that the bearish point of control is one point below the bullish POC. This is interesting because it essentially shows where people may be "panic selling" or setting their stop-outs. If SQQQ drops below 18.8, then it's likely to trigger panic selling, as indicated by the histogram.
Conversely, we can observe that traders tend to position long between $18 and $24. The POC is noted in the stats table and also displayed on the chart. Bullish POC is shown in purple, bearish in yellow. These, of course, can be toggled off.
The Frequency Table:
The frequency table shows how many observations were obtained in each price range. The histogram illustrates the cumulative volume traded, while the frequency simply counts how many cases occurred over the lookback period.
ATR Range Analytics by Volume:
The indicator also has the ability to display range analytics by volume. When you toggle on the range analytics by volume option, a range chart will appear:
www.tradingview.com
The range chart goes from the minimum recorded volume to the maximum recorded volume in the period, showing the average range and direction associated with this volume. This is crucial to pay attention to because not all stocks behave the same way.
For example, in the chart above (AMD), we can see that low volume produces a general bearish bias, and high volume produces a general bullish bias. However, if we look at the range analytics for SPY:
Low volume has the inverse effect. Low volume is associated with a more bullish bias, and high volume indicates a more bearish bias. In the ATR chart, the threshold volume to transition from bullish bias to bearish bias is approximately > 78,607,268 traded shares.
The Stats Table:
The stats table can be toggled on or off. It simply displays the POCs and the time range for the VSP. The default time range is 1 trading year (252 days), assuming you are on the daily timeframe. However, you can use this on any timeframe.
The percentages displayed in the histogram is the cumulative percent of buying and selling volume independently. So when you see the percentage on the selling histogram, its the percent of cumulative selling only. Same for the buying.
And that's the indicator! I hope you enjoy it. Let me know your thoughts. I hope you all have safe holidays, a Merry Christmas for you North Americans, and a Happy Christmas for you UKers, and whatever else you celebrate/care about and do! Safe trades, everyone, and enjoy your holidays! 🎁🎄🎄🎄⭐⭐⭐ 🕎 🕎 🕎

Aggregate VPVR + [CE]Aggregate VPVR +
Aggregate Volume automatically fetches and aggregates futures volume data from multiple exchanges such as Binance, OKX, and Bybit -- for any crypto asset, and highlights the volume bars that exceed a user-defined threshold.
Using this logic the CE team have put together a new VPVR script that uses aggregated data to produce new profile. The tool takes a fresh look at the VPVR usage by highlighting the VA in the ratio of contribution to volume by each exchange.
Each exchange is toggleable so users can view data related to the exchange and aggregate as needed e.g.
Binance + bybit
OKX + bybit
Binance + OKX
Additional benefits of + mode:
Rolling Bar Mode
Rolling bar mode comes with the added benefit of a persistent number of bars the profile will elapse, this makes it perfect for users who may change their chart often + will reflect the rolling bars in history also.
Developing VA + Developing POC
Additionally comes with developing Value area and POC making it easier to back test strategies as we can see the interaction with price at time of the VA/POC relevant to the candle.
Finally the addition of alerts:
Re enter VA
Leave VA
Cross above POC
Cross below POC

SwiftEdge APEEXSwiftEdge Apeex – Volume-Weighted VWAP + Live POC + True Footprint-Precise Big Trades
This indicator combines three powerful and complementary tools used by professional traders:
1. Volume-Weighted EWMA VWAP with Dynamic Deviation Bands
A smooth, volume-weighted VWAP using an exponentially weighted moving average of variance. The deviation bands (1σ, 2σ, 3σ) dynamically expand and contract with actual market volatility — giving far more realistic support/resistance levels than fixed-percentage bands.
2. Session-Based Live Point of Control (POC)
The classic intraday POC (highest traded volume price) calculated from session start (default 09:00). Resets cleanly at your chosen session time.
3. True 1-Second Footprint-Precise Big Trade Bubbles
Unlike traditional volume spike indicators that only show "where the candle closed", this version uses real 1-second data to calculate the exact delta-weighted price where aggressive buying or selling actually occurred inside the bar.
- All levels from 1.2× to 8× average volume are shown
- Bubble size scales with significance (1.2× = tiny → 8× = huge)
- White outline on 5× and 8× for instant visual impact
- Yellow background highlights bars with significant volume
Why this combination works so well:
- VWAP + deviations give you the macro institutional reference levels
- POC shows where the market actually accepted the most volume
- The footprint-precise bubbles show you exactly where the smart money entered or absorbed — often many ticks away from the candle close
Best used on 1m to 1h timeframes on liquid futures (ES, NQ, CL) or crypto (BTC, ETH).
No lookahead. No repainting. Pure price + volume truth.

🟡 GOLD 4H HUD v8.9 — Loose ICT OB + Strong/Weak + FVG/HVN/LVNGOLD 4H HUD v8.9 is a clean, structured Smart Money Concepts (SMC)–based analysis tool designed exclusively for XAUUSD on the 4-hour timeframe.
It focuses on the three most important elements for institutional orderflow analysis:
✔ Loose ICT Order Blocks (Demand/Supply)
✔ Fair Value Gaps (FVG)
✔ Volume Profile Zones (HVN/LVN/POC)
The script builds a professional-style HUD that displays the key institutional regions and structural levels that matter most for gold traders.
📌 Key Features
1 — Market Structure Engine (HH/HL & BOS)
The indicator detects:
Minor swing Highs and Lows
Last confirmed HH / HL levels
Break of Structure (BOS) for directional bias
EMA-200 trend filter (UP / DOWN / NEUTRAL)
This gives traders a clean structural read without clutter or noise.
2 — Loose FVG Engine (Tolerance-Based ICT Gaps)
A soft-threshold FVG engine detects “loose” Fair Value Gaps using a 0.1% price tolerance.
This method ensures:
Fewer missed imbalances
Cleaner OB/FVG alignment
Higher accuracy on 4H gold displacement legs
FVGs automatically shift to the right side of the chart for clean visualization.
3 — Order Block Engine (Demand/Supply + Strong/Weak Classification)
A simplified ICT-style OB engine scans the past few candles whenever BOS is detected.
It identifies:
Demand OB during bullish BOS
Supply OB during bearish BOS
Strong OB if fully nested inside an active FVG
Weak OB otherwise
OB boxes include:
Clear color coding (strong vs. weak)
Price range labels inside each box
Automatic right-shift for visual clarity
4 — Volume Profile Engine (POC / HVN / LVN / VAH / VAL)
Based on a rolling window (default 120 bars), the script builds a lightweight volume distribution.
It displays:
POC (Point of Control)
HVN (High Volume Node)
LVN (Low Volume Node)
Value Area High / Low
HVN/LVN zones are shown as right-shifted colored boxes with price labels.
These zones help identify:
Institutional accumulation
Low-liquidity rejection points
Areas where price tends to react strongly
5 — Support / Resistance Mapping
The script automatically generates:
OB-based support/resistance
Swing-high/swing-low levels
HVN/LVN structural levels
These are displayed in the HUD for fast reference.
6 — Professional HUD Panel
A compact, easy-to-read HUD summarizes:
Trend direction
Latest HH/HL
OB ranges (Strong/Weak)
HVN/LVN price zones
POC
Multi-layer support & resistance
This turns the script into a fully functional analysis dashboard.
📌 What This Indicator Is NOT
To avoid misunderstanding:
It does not take entries or generate buy/sell signals
It does not auto-detect CHOCH, MSS, SMT, or sweeps
It is not a trading bot
This tool is designed as an institutional-style map and analysis HUD, not a strategy.
📌 Best Use Case
This indicator is ideal for traders who want to:
Read institutional structure on XAUUSD
Identify clean Demand/Supply zones
Visualize FVG/OB/HVN interactions
Track high-value liquidity levels
Build directional bias on 4H before dropping to execution timeframes
⚠ Important Note
This tool is designed exclusively for the 4H timeframe.
Using it on lower timeframes will display a warning.

🟡 GOLD 4H HUD v12 — Time-Safe Nuclear Edition🟡 GOLD 4H HUD v12 — Time-Safe Nuclear Edition
A full–scale Smart Money Concepts (SMC) analytics engine designed exclusively for XAUUSD on the 4-Hour timeframe.
This script combines market structure, liquidity, displacement, order blocks, imbalance, volume profile, SMT divergence, and institutional behavior modeling into a single unified HUD.
Built with a time-safe architecture, all structural elements (OB/FVG/Sweep) are stored by timestamp to minimize repainting and preserve event integrity.
📌 Core Features (12 Modules + Full HUD)
1 — Market Structure Engine
Automatically detects:
HH / HL / LH / LL
BOS (Break of Structure)
MSS (Market Structure Shift)
CHOCH (Change of Character)
Real swing pivots & trend state
2 — Sweep Engine (Liquidity Grab Detection)
Identifies institutional liquidity grabs:
Break + reclaim of highs/lows
ATR-filtered invalidation
Displacement-backed sweeps
3 — Time-Safe FVG Engine
Detects Bullish/Bearish Fair Value Gaps
ATR-tolerant FVG logic
Automatic right-extension
Auto-delete when filled or invalid
4 — Time-Safe Order Block Engine
Demand & Supply OB detection
Strength classification (Weak vs Strong)
FVG-overlap confirmation
Timestamp-locked (non-repainting)
5 — Volume Profile Engine (HVN / LVN / POC)
Real-time micro-profile:
High Volume Node (HVN)
Low Volume Node (LVN)
Point of Control (POC)
6 — SMT Engine (Gold vs DXY Divergence)
Smart Money Divergence built-in:
Bullish SMT
Bearish SMT
Directional confirmation with zero lag
7 — Displacement Engine
Measures institutional impulse:
Body-based impulse detection
Multi-leg continuation signals
FVG continuation moves
Generates displacement score
8 — Premium / Discount Model
Auto-classifies price into:
Discount (Buy zone)
Premium (Sell zone)
9 — SMC Trend Engine (Score-Based)
Combines 10+ factors:
Structure
FVG
OB power
Displacement
POC positioning
SMT conditions
Outputs:
BULL / BEAR / RANGE
Full scoring system
10 — Institutional Imbalance Model (IMB Engine)
Combines:
PD zones
Sweep direction
Displacement
SMT
OB strength
CHOCH/MSS
A complete institutional bias filter.
11 — Entry Engine (Signal Fusion Model)
Entry conditions fuse:
Sweep
CHOCH
Displacement
OB strength
FVG alignment
SMT confirmation
Also outputs:
Suggested SL/TP
Entry score
12 — Trendline Engine
Auto-draws:
HL → HL bullish trendlines
LH → LH bearish trendlines
+ Full Nuclear HUD
Displays:
Market structure
Trend direction
SMT / CHOCH / MSS
FVG / OB zones
HVN / LVN / POC
Liquidity strength
Entry model
Liquidity Magnet direction
SL/TP map
A complete institutional dashboard in one place.
⚠ Usage Requirement
This script is designed ONLY for the 4H timeframe.
✨ Summary
GOLD 4H HUD v12 — Time-Safe Nuclear Edition
is not just an indicator.
It is a full institutional-grade SMC analysis system, built specifically for Gold.
If you trade XAUUSD on the 4H timeframe —
this is your complete market intelligence HUD

Get_rich_aggressively_v5# 🚀 GET RICH AGGRESSIVELY v5 - TIER SYSTEM
### Precision Futures Scalping | NQ • ES • YM • GC • BTC
### *Leave Every Trade With Money*
---
## 📋 QUICK CHEATSHEET
```
┌─────────────────────────────────────────────────────────────────────────────┐
│ GRA v5 SIGNAL REQUIREMENTS │
├─────────────────────────────────────────────────────────────────────────────┤
│ ✓ TIER MET Points ≥ 10 (B), ≥ 50 (A), ≥ 100 (S) │
│ ✓ VOLUME ≥ 1.3x average │
│ ✓ DELTA ≥ 55% dominance (buyers OR sellers) │
│ ✓ DIRECTION Candle color = Delta direction │
│ ✓ SESSION In London (3-5AM) or NY (9:30-11:30AM) if filter ON │
├─────────────────────────────────────────────────────────────────────────────┤
│ TIER ACTIONS │
├─────────────────────────────────────────────────────────────────────────────┤
│ 🥇 S-TIER (100+ pts) │ HOLD LONGER │ Big institutional move │
│ 🥈 A-TIER (50-99 pts) │ HOLD A BIT │ Medium move, trail to BE │
│ 🥉 B-TIER (10-49 pts) │ CLOSE QUICK │ Scalp 5-10 pts, exit fast │
│ ❌ NO TIER (< 10 pts) │ NO TRADE │ Not enough conviction │
├─────────────────────────────────────────────────────────────────────────────┤
│ SESSION PRIORITY │
├─────────────────────────────────────────────────────────────────────────────┤
│ 🔵 LONDON OPEN 03:00-05:00 ET │ IB forms 03:00-04:00 │
│ 🟢 NY OPEN 09:30-11:30 ET │ IB forms 09:30-10:30 │
│ 📊 IB BREAKOUT Close beyond IB + Impulse + 1.3x Vol = HIGH CONVICTION│
├─────────────────────────────────────────────────────────────────────────────┤
│ VOLUME PROFILE ZONES │
├─────────────────────────────────────────────────────────────────────────────┤
│ 🔵 HVN (Blue BG) High volume = Support/Resistance, expect consolidation │
│ 🟡 LVN (Yellow BG) Low volume = Breakout acceleration, fast moves │
│ 🟣 POC Point of Control = Institutional fair value │
│ 🟣 VAH/VAL Value Area edges = S/R zones │
├─────────────────────────────────────────────────────────────────────────────┤
│ MARKET STATE DECODER │
├─────────────────────────────────────────────────────────────────────────────┤
│ TREND UP │ Price > EMA20 + CVD rising │ Trade WITH the trend │
│ TREND DN │ Price < EMA20 + CVD falling │ Trade WITH the trend │
│ RETRACE │ Price/CVD diverging │ Pullback, prepare for entry │
│ RANGE │ No clear direction │ Reduce size or skip │
├─────────────────────────────────────────────────────────────────────────────┤
│ 💎 HIGH CONVICTION UPGRADE │
├─────────────────────────────────────────────────────────────────────────────┤
│ Purple diamond (◆) appears when: │
│ • Strong delta (≥65%) + Strong volume (≥2x) + Market in imbalance │
│ → Consider upgrading tier (B→A, A→S) for position sizing │
└─────────────────────────────────────────────────────────────────────────────┘
```
---
## 🎯 THE TIER SYSTEM
The tier system classifies candles by **point movement** to determine trade management:
| Tier | Points | Action | Expected R:R |
|:----:|:------:|:------:|:------------:|
| 🥇 **S-TIER** | 100+ | HOLD LONGER | 2:1+ |
| 🥈 **A-TIER** | 50-99 | HOLD A BIT | 1.5:1 |
| 🥉 **B-TIER** | 10-49 | CLOSE QUICK | 1:1 |
| ❌ **NO TIER** | < 10 | NO TRADE | — |
---
## ✅ SIGNAL REQUIREMENTS
**ALL conditions must be TRUE for a signal:**
```
SIGNAL = TIER + VOLUME + DELTA + DIRECTION + SESSION
☐ Points ≥ 10 (minimum B-tier)
☐ Volume ≥ 1.3x average
☐ Delta dominance ≥ 55%
☐ Candle direction = Delta direction
☐ In session (if filter ON)
ANY FALSE = NO SIGNAL = NO TRADE
```
---
## 📊 VOLUME DOMINANCE ANALYSIS
This is the **core edge** of GRA v5. We use intrabar analysis to determine who is in control:
```
VOLUME ANALYSIS BREAKDOWN
Total Volume = Buy Volume + Sell Volume
Buy Volume: Who pushed price UP within the bar
Sell Volume: Who pushed price DOWN within the bar
Delta = Buy Volume - Sell Volume
Buy Dominance = Buy Volume / Total Volume
Sell Dominance = Sell Volume / Total Volume
≥ 55% = ONE SIDE IN CONTROL
≥ 65% = STRONG DOMINANCE (high conviction)
```
**Direction Confirmation Matrix:**
| Candle | Delta | Signal |
|:-------|:------|:-------|
| 🟢 Bullish | 55%+ Buyers | ✅ LONG |
| 🟢 Bullish | 55%+ Sellers | ❌ Trap |
| 🔴 Bearish | 55%+ Sellers | ✅ SHORT |
| 🔴 Bearish | 55%+ Buyers | ❌ Trap |
---
## 🕐 SESSION CONTEXT
### Initial Balance (IB) Framework
The **first hour** of each session establishes the IB range. Institutions use this for the day's framework.
```
SESSION WINDOWS (Eastern Time):
LONDON:
├── IB Period: 03:00 - 04:00 ← Range established
├── Trade Window: 03:00 - 05:00 ← Best signals
└── Extension Targets: 1.5x, 2.0x
NY:
├── IB Period: 09:30 - 10:30 ← Range established
├── Trade Window: 09:30 - 11:30 ← Best signals
└── Extension Targets: 1.5x, 2.0x
```
### IB Breakout Signals
```
L▲ / L▼ = London IB Breakout (Blue)
N▲ / N▼ = NY IB Breakout (Orange)
Confirmation Required:
☐ Close beyond IB level (not just wick)
☐ Impulse candle (body > 60% of range)
☐ Volume > 1.3x average
```
**IB Statistics:**
- 97% of days break either IB high or low
- 1.5x extension = first profit target
- 2.0x extension = full range target
- ~66% of London sessions sweep Asian high/low first
---
## 📈 VIRTUAL VOLUME PROFILE ZONES
GRA v5 calculates volume profile zones **without drawing the profile**, giving you the key levels:
### Zone Types
| Zone | Background | Meaning | Action |
|:-----|:-----------|:--------|:-------|
| **HVN** | 🔵 Blue | High Volume Node | S/R zone, expect consolidation |
| **LVN** | 🟡 Yellow | Low Volume Node | Breakout zone, fast acceleration |
| **POC** | 🟣 Purple dots | Point of Control | Institutional fair value |
| **VAH/VAL** | 🟣 Purple lines | Value Area edges | S/R boundaries |
### How to Use
```
ENTERING A TRADE:
At HVN:
├── Expect price to consolidate
├── Look for rejection/absorption
└── Better for reversals
At LVN:
├── Expect fast price movement
├── Don't fight the direction
└── Better for breakouts
Near POC:
├── Institutional fair value
├── Strong magnet effect
└── Watch for volume at POC
```
---
## 🔄 MARKET STATE DETECTION
GRA v5 classifies the market into four states using **CVD + Price Action**:
```
CVD Direction
↑ Rising ↓ Falling
┌─────────────┬─────────────┐
Price > EMA20 │ TREND UP │ RETRACE │
│ (Go Long) │ (Pullback) │
├─────────────┼─────────────┤
Price < EMA20 │ RETRACE │ TREND DN │
│ (Pullback) │ (Go Short) │
└─────────────┴─────────────┘
```
| State | Meaning | Action |
|:------|:--------|:-------|
| **TREND UP** | Buyers in control | Trade long, follow signals |
| **TREND DN** | Sellers in control | Trade short, follow signals |
| **RETRACE** | Pullback against trend | Prepare for continuation entry |
| **RANGE** | No clear direction | Reduce size or wait |
---
## 💎 HIGH CONVICTION UPGRADES
When extra conditions align, GRA v5 marks the signal with a **purple diamond**:
```
HIGH CONVICTION = Base Signal + Strong Delta (65%+) + Strong Volume (2x+) + Imbalance State
```
**Action:** Consider upgrading tier for position sizing:
- B-Tier → A-Tier management
- A-Tier → S-Tier management
---
## 📋 TRADING BY TIER
### 🥇 S-TIER (100+ points)
| | |
|:--|:--|
| **Entry** | Candle close |
| **Target** | IB extension / Next S/R |
| **Management** | HOLD LONGER |
**Rules:**
- Watch next candle - continues? HOLD
- Same tier same direction? ADD
- Opposite tier signal? EXIT on close
- Never close early unless reversal signal
### 🥈 A-TIER (50-99 points)
| | |
|:--|:--|
| **Entry** | Candle close |
| **Target** | 1.5x initial risk minimum |
| **Management** | HOLD A BIT |
**Rules:**
- Target 1.5:1 R:R minimum
- Trail to breakeven after 1:1
- If stalls, take profit
- Upgrade to S-tier management if high conviction
### 🥉 B-TIER (10-49 points)
| | |
|:--|:--|
| **Entry** | Candle close |
| **Target** | 5-10 points MAX |
| **Management** | CLOSE QUICK |
**Rules:**
- Exit in 1-3 candles
- DO NOT hold for more
- Any doubt = EXIT
- Quick scalp mentality
---
## ⚙️ SETTINGS BY INSTRUMENT
| Setting | NQ/ES | YM | GC | BTC |
|:--------|:-----:|:--:|:--:|:---:|
| **Timeframe** | 1-5 min | 1-5 min | 5-15 min | 1-15 min |
| **S-Tier** | 100 pts | 100 pts | 15 pts | 500 pts |
| **A-Tier** | 50 pts | 50 pts | 8 pts | 250 pts |
| **B-Tier** | 10 pts | 15 pts | 3 pts | 50 pts |
| **Min Volume** | 1.3x | 1.3x | 1.5x | 1.3x |
| **Delta %** | 55% | 55% | 58% | 55% |
| **Best Time** | 9:30-11:30 ET | 9:30-11:30 ET | 3-5AM & 8:30-10:30 ET | 24/7 |
---
## 📊 TABLE LEGEND
The info panel displays real-time market data:
| Row | Shows | Colors |
|:----|:------|:-------|
| **Pts** | Candle points | Gold/Green/Yellow by tier |
| **Tier** | S/A/B/X | Gold/Green/Yellow/White |
| **Vol** | Volume ratio | Yellow (2x+) / Green (1.3x+) / Red |
| **Delta** | Buy/Sell % | Green (buy) / Red (sell) / White |
| **CVD** | Direction | Green ▲ / Red ▼ |
| **State** | Market state | Green/Red/Orange/Gray |
| **Sess** | Session | Yellow if active |
| **Zone** | VP zone | Blue/Yellow/Purple |
| **Sig** | Signal | Green/Red if active |
---
## 🔔 ALERTS
| Alert | When | Action |
|:------|:-----|:-------|
| **S-TIER LONG/SHORT** | S-tier signal | Hold longer |
| **A-TIER LONG/SHORT** | A-tier signal | Hold a bit |
| **B-TIER LONG/SHORT** | B-tier signal | Close quick |
| **LON IB BREAK UP/DN** | London IB breakout | Major session move |
| **NY IB BREAK UP/DN** | NY IB breakout | Major session move |
| **HIGH CONVICTION** | Upgraded signal | Consider larger size |
| **LONDON/NY OPEN** | Session start | Get ready |
---
## 💰 THE GOLDEN RULE
> ### **LEAVE EVERY TRADE WITH MONEY**
>
> | Situation | Rule |
> |:----------|:-----|
> | B-Tier | Small win > Small loss |
> | A-Tier | Trail to BE, lock profit |
> | S-Tier | Let it run to target |
> | No Signal | NO TRADE |
> | Wrong Side | EXIT immediately |
>
> **Capital preserved = Trade tomorrow**
---
## ⚠️ DISCLAIMER
> Risk management is **YOUR** responsibility.
> Never risk more than 1-2% per trade.
> Paper trade until you understand the signals.
> Past performance ≠ future results.
---
### Get Rich. Stay Rich. Trade Aggressively. 🚀
**Get Rich Aggressively v5**
*Precision Futures Scalping*
