Price Channel Breakout Strategy — Long & ShortThis strategy is a dual-direction Price Channel breakout system designed for high-volatility indices such as US30, NAS100, and XAUUSD.
It enters long when price breaks above the highest high of the past N bars, and enters short when price breaks below the lowest low.
A key feature is the use of fixed dollar-based take-profit and stop-loss, making the strategy adaptive across symbols with different tick values.
Core Logic
Long entry when price breaks the N-bar high
Short entry when price breaks the N-bar low
Dollar-based TP and SL (converted to ticks automatically)
Suitable for trending and breakout-friendly markets
Backtest Notes (US30 Example)
Sharpe Ratio: 2.7
Profit Factor: 2.111
Total Return (12-month backtest): +46.89%
Max Drawdown: 0.26%
Trades: 3,666
This strategy performs well in sustained volatility environments and is particularly effective for intraday momentum bursts on US30.
Cari dalam skrip untuk "profit factor"

Average True Range (ATR)Strategy Name: ATR Trend-Following System with Volatility Filter & Dynamic Risk Management
Short Name: ATR Pro Trend System
Current Version: 2025 Edition (fully tested and optimized)Core ConceptA clean, robust, and highly profitable trend-following strategy that only trades when three strict conditions are met simultaneously:Clear trend direction (price above/below EMA 50)
Confirmed trend strength and trailing stop (SuperTrend)
Sufficient market volatility (current ATR(14) > its 50-period average)
This combination ensures the strategy stays out of choppy, low-volatility ranges and only enters during high-probability, trending moves with real momentum.Key Features & ComponentsComponent
Function
Default Settings
EMA 50
Primary trend filter
50-period exponential
SuperTrend
Dynamic trailing stop + secondary trend confirmation
Period 10, Multiplier 3.0
ATR(14) with RMA
True volatility measurement (Wilder’s original method)
Length 14
50-period SMA of ATR
Volatility filter – only trade when current ATR > average ATR
Length 50
Background coloring
Visual position status: light green = long, light red = short, white = flat
–
Entry markers
Green/red triangles at the exact entry bar
–
Dynamic position sizing
Fixed-fractional risk: exactly 1% of equity per trade
1.00% risk
Stop distance
2.5 × ATR(14) – fully adaptive to current volatility
Multiplier 2.5
Entry RulesLong: Close > EMA 50 AND SuperTrend bullish AND ATR(14) > SMA(ATR,50)
Short: Close < EMA 50 AND SuperTrend bearish AND ATR(14) > SMA(ATR,50)
Exit RulesPosition is closed automatically when SuperTrend flips direction (acts as volatility-adjusted trailing stop).
Money ManagementRisk per trade: exactly 1% of current account equity
Position size is recalculated on every new entry based on current ATR
Automatically scales up in strong trends, scales down in low-volatility regimes
Performance Highlights (2015–Nov 2025, real backtests)CAGR: 22–50% depending on market
Max Drawdown: 18–28%
Profit Factor: 1.89–2.44
Win Rate: 57–62%
Average holding time: 10–25 days (daily timeframe)
Best Markets & TimeframesExcellent on: Bitcoin, S&P 500, Nasdaq-100, DAX, Gold, major Forex pairs
Recommended timeframes: 4H, Daily, Weekly (Daily is the sweet spot)

BankNifty Etharia Aggresive Buyer / SellerOverview
Professional intraday trading strategy for BankNifty Futures that identifies high-probability setups by combining multiple technical indicators. Works in BOTH directions - LONG and SHORT.
Best Timeframe: 5-Minute Chart
Key Features:
✅ Multi-Confluence Entry System - All indicators must align for signal
✅ Bidirectional Trading - Captures both uptrends and downtrends
✅ Advanced Risk Management - Daily loss limits, consecutive loss protection
✅ Smart Exit System - Partial profit taking + trailing stops
✅ Session-Based Trading - Avoids opening and closing volatility
Entry Logic:
LONG Signals:
Price above Kernel Regression (trend confirmation)
Price above VWAP with positive slope (momentum)
Cumulative Volume Delta bullish (buying pressure)
Volume spike or increasing volume (strength confirmation)
Strong bullish candle with 60%+ body ratio
RSI filter to avoid overbought entries
SHORT Signals:
Price below Kernel Regression (downtrend confirmation)
Price below VWAP with negative slope (bearish momentum)
CVD bearish (selling pressure dominates)
High volume confirmation
Strong bearish candle pattern
RSI filter to avoid oversold entries
Exit Management:
🎯 Target 1: 1.5 R:R (50% position exit)
🎯 Target 2: 2.5 R:R (full exit)
🛡️ Stop Loss Options: ATR-based, Swing-based, or Fixed
🟡 Trailing Stop: Activates after 1.2 R:R, trails at 0.8 R:R
⏰ Time-Based Exit: Closes all positions 5 mins before session end
Risk Controls:
Maximum trades per day (default: 5)
Consecutive loss limit (default: 2)
Daily loss limit: 2.5% of capital
Daily profit target: 5% (stops trading when reached)
Position sizing based on account risk percentage
Recommended Settings:
Asset: BankNifty Futures (NSE:BANKNIFTY1!)
Timeframe: 5-minute
Initial Capital: ₹1,00,000
Risk per trade: 1%
Commission: 0.05%
Slippage: 5 points
Performance Expectations:
Win Rate: 55-65%
Profit Factor: 1.5-2.0
Average Trades/Day: 3-8
Risk:Reward: 1:1.8 average
Customizable Parameters:
Trading direction (Long Only / Short Only / Both)
Indicator lengths and thresholds
Stop loss type and targets
Risk management limits
Trading session hours
Best For:
Intraday traders seeking systematic, rule-based entries with strong confluence, proper risk management, and the ability to profit from both bullish and bearish market conditions.

VWAP Retest + EMA9 Cross + Candle Pattern V2📈 VWAP Retest + EMA9 Cross + Candle Pattern Strategy_V2
Setup: This intraday momentum strategy combines 3 core elements:
• VWAP Retest: Price retests VWAP within a small buffer zone
• EMA9 Crossover: EMA9 crosses above VWAP within the last 3 bars
• Bullish Candle Pattern: At least one bullish signal — Hammer, Engulfing, or Momentum candle
A trade is triggered only during the US morning session (9:30–12:30 EST) and only if price is above yesterday’s high, suggesting strong momentum.
⚙️ Strategy Settings
• Initial Capital: $100,000
• Position Sizing: 10% of equity per trade
• Commission: 0.03% per trade
• Slippage: 1 tick
• Take Profit: +3% from entry
• Stop Loss: 0.5% below VWAP at entry
• Forced Exit: 1:00 PM EST
📊 Strategy Logic
• VWAP Retest Filter ensures entry is near a value zone.
• EMA9 Cross Confirmation aligns short-term momentum with volume-weighted price.
• Bullish Candle Patterns provide price action confirmation:
○ ✅ Hammer
○ ✅ Bullish Engulfing
○ ✅ Large momentum body
• Above Yesterday’s High (YH) acts as a bullish bias filter.
🧪 Backtest Results (Jan 2023 – Oct 2025)
• Total Trades: 120
• Win Rate: 52.5%
• Profit Factor: 1.18
• Max Drawdown: 1.22%
• Net P&L: +$1,064 (+1.06%)
Due to chart data limits, only part of the period may be visible on publication charts.
🔍 Chart Visuals
This strategy plots:
• VWAP (white) and EMA9 (orange)
• Candle pattern markers:
○ “H” = Hammer
○ “BE” = Bullish Engulfing
○ “M” = Momentum Candle
• “SETUP” label when all conditions are met
• YH/YL labels for context — previous day’s high/low
💡 Use Case
This setup is designed for intraday momentum scalping, ideal for traders who:
• Trade morning breakouts
• Use VWAP as a dynamic support/resistance
• Want clear, rule-based entries based on both trend and price action
Educational and research use - not financial advice.

Optimized ADX DI CCI Strategy### Key Features:
- Combines ADX, DI+/-, CCI, and RSI for signal generation.
- Supports customizable timeframes for indicators.
- Offers multiple exit conditions (Moving Average cross, ADX change, performance-based stop-loss).
- Tracks and displays trade statistics (e.g., win rate, capital growth, profit factor).
- Visualizes trades with labels and optional background coloring.
- Allows countertrading (opening an opposite trade after closing one).
1. **Indicator Calculation**:
- **ADX and DI+/-**: Calculated using the `ta.dmi` function with user-defined lengths for DI and ADX smoothing.
- **CCI**: Computed using the `ta.cci` function with a configurable source (default: `hlc3`) and length.
- **RSI (optional)**: Calculated using the `ta.rsi` function to filter overbought/oversold conditions.
- **Moving Averages**: Used for CCI signal smoothing and trade exits, with support for SMA, EMA, SMMA (RMA), WMA, and VWMA.
2. **Signal Generation**:
- **Buy Signal**: Triggered when DI+ > DI- (or DI+ crosses over DI-), CCI > MA (or CCI crosses over MA), and optional ADX/RSI filters are satisfied.
- **Sell Signal**: Triggered when DI+ < DI- (or DI- crosses over DI+), CCI < MA (or CCI crosses under MA), and optional ADX/RSI filters are satisfied.
3. **Trade Execution**:
- **Entry**: Long or short trades are opened using `strategy.entry` when signals are detected, provided trading is allowed (`allow_long`/`allow_short`) and equity is positive.
- **Exit**: Trades can be closed based on:
- Opposite signal (if no other exit conditions are used).
- MA cross (price crossing below/above the exit MA for long/short trades).
- ADX percentage change exceeding a threshold.
- Performance-based stop-loss (trade loss exceeding a percentage).
- **Countertrading**: If enabled, closing a trade triggers an opposite trade (e.g., closing a long opens a short).
4. **Visualization**:
- Labels are plotted at trade entries/exits (e.g., "BUY," "SELL," arrows).
- Optional background coloring highlights open trades (green for long, red for short).
- A statistics table displays real-time metrics (e.g., capital, win rates).
5. **Trade Tracking**:
- Tracks the number of long/short trades, wins, and overall performance.
- Monitors equity to prevent trading if it falls to zero.
### 2.3 Key Components
- **Indicator Calculations**: Uses `request.security` to fetch indicator data for the specified timeframe.
- **MA Function**: A custom `ma_func` handles different MA types for CCI and exit conditions.
- **Signal Logic**: Combines crossover/under checks with recent bar windows for flexibility.
- **Exit Conditions**: Multiple configurable exit strategies for risk management.
- **Statistics Table**: Updates dynamically with trade and capital metrics.
## 3. Configuration Options
The script provides extensive customization through input parameters, grouped for clarity in the TradingView settings panel. Below is a detailed breakdown of each setting and its impact.
### 3.1 Strategy Settings (Global)
- **Initial Capital**: Default `10000`. Sets the starting capital for backtesting.
- **Effect**: Determines the base equity for calculating position sizes and performance metrics.
- **Default Quantity Type**: `strategy.percent_of_equity` (50% of equity).
- **Effect**: Controls the size of each trade as a percentage of available equity.
- **Pyramiding**: Default `2`. Allows up to 2 simultaneous trades in the same direction.
- **Effect**: Enables multiple entries if conditions are met, increasing exposure.
- **Commission**: 0.2% per trade.
- **Effect**: Simulates trading fees, reducing net profit in backtesting.
- **Margin**: 100% for long and short trades.
- **Effect**: Assumes no leverage; adjust for margin trading simulations.
- **Calc on Every Tick**: `true`.
- **Effect**: Ensures real-time signal updates for precise execution.
### 3.2 Indicator Settings
- **Indicator Timeframe** (`indicator_timeframe`):
- **Options**: `""` (chart timeframe), `1`, `5`, `15`, `30`, `60`, `240`, `D`, `W`.
- **Default**: `""` (uses chart timeframe).
- **Effect**: Determines the timeframe for ADX, DI, CCI, and RSI calculations. A higher timeframe reduces noise but may delay signals.
### 3.3 ADX & DI Settings
- **DI Length** (`adx_di_len`):
- **Default**: `30`.
- **Range**: Minimum `1`.
- **Effect**: Sets the period for calculating DI+ and DI-. Longer periods smooth trends but reduce sensitivity.
- **ADX Smoothing Length** (`adx_smooth_len`):
- **Default**: `14`.
- **Range**: Minimum `1`.
- **Effect**: Smooths the ADX calculation. Longer periods produce smoother ADX values.
- **Use ADX Filter** (`use_adx_filter`):
- **Default**: `false`.
- **Effect**: If `true`, requires ADX to exceed the threshold for signals to be valid, filtering out weak trends.
- **ADX Threshold** (`adx_threshold`):
- **Default**: `25`.
- **Range**: Minimum `0`.
- **Effect**: Sets the minimum ADX value for valid signals when the filter is enabled. Higher values restrict trades to stronger trends.
### 3.4 CCI Settings
- **CCI Length** (`cci_length`):
- **Default**: `20`.
- **Range**: Minimum `1`.
- **Effect**: Sets the period for CCI calculation. Longer periods reduce noise but may lag.
- **CCI Source** (`cci_src`):
- **Default**: `hlc3` (average of high, low, close).
- **Effect**: Defines the price data for CCI. `hlc3` is standard, but users can choose other sources (e.g., `close`).
- **CCI MA Type** (`ma_type`):
- **Options**: `SMA`, `EMA`, `SMMA (RMA)`, `WMA`, `VWMA`.
- **Default**: `SMA`.
- **Effect**: Determines the moving average type for CCI signal smoothing. EMA is more responsive; VWMA weights by volume.
- **CCI MA Length** (`ma_length`):
- **Default**: `14`.
- **Range**: Minimum `1`.
- **Effect**: Sets the period for the CCI MA. Longer periods smooth the MA but may delay signals.
### 3.5 RSI Filter Settings
- **Use RSI Filter** (`use_rsi_filter`):
- **Default**: `false`.
- **Effect**: If `true`, applies RSI-based overbought/oversold filters to signals.
- **RSI Length** (`rsi_length`):
- **Default**: `14`.
- **Range**: Minimum `1`.
- **Effect**: Sets the period for RSI calculation. Longer periods reduce sensitivity.
- **RSI Lower Limit** (`rsi_lower_limit`):
- **Default**: `30`.
- **Range**: `0` to `100`.
- **Effect**: Defines the oversold threshold for buy signals. Lower values allow trades in more extreme conditions.
- **RSI Upper Limit** (`rsi_upper_limit`):
- **Default**: `70`.
- **Range**: `0` to `100`.
- **Effect**: Defines the overbought threshold for sell signals. Higher values allow trades in more extreme conditions.
### 3.6 Signal Settings
- **Cross Window** (`cross_window`):
- **Default**: `0`.
- **Range**: `0` to `5` bars.
- **Effect**: Specifies the lookback period for detecting DI+/- or CCI crosses. `0` requires crosses on the current bar; higher values allow recent crosses, increasing signal frequency.
- **Allow Long Trades** (`allow_long`):
- **Default**: `true`.
- **Effect**: Enables/disables new long trades. If `false`, only closing existing longs is allowed.
- **Allow Short Trades** (`allow_short`):
- **Default**: `true`.
- **Effect**: Enables/disables new short trades. If `false`, only closing existing shorts is allowed.
- **Require DI+/DI- Cross for Buy** (`buy_di_cross`):
- **Default**: `true`.
- **Effect**: If `true`, requires a DI+ crossover DI- for buy signals; if `false`, DI+ > DI- is sufficient.
- **Require CCI Cross for Buy** (`buy_cci_cross`):
- **Default**: `true`.
- **Effect**: If `true`, requires a CCI crossover MA for buy signals; if `false`, CCI > MA is sufficient.
- **Require DI+/DI- Cross for Sell** (`sell_di_cross`):
- **Default**: `true`.
- **Effect**: If `true`, requires a DI- crossover DI+ for sell signals; if `false`, DI+ < DI- is sufficient.
- **Require CCI Cross for Sell** (`sell_cci_cross`):
- **Default**: `true`.
- **Effect**: If `true`, requires a CCI crossunder MA for sell signals; if `false`, CCI < MA is sufficient.
- **Countertrade** (`countertrade`):
- **Default**: `true`.
- **Effect**: If `true`, closing a trade triggers an opposite trade (e.g., close long, open short) if allowed.
- **Color Background for Open Trades** (`color_background`):
- **Default**: `true`.
- **Effect**: If `true`, colors the chart background green for long trades and red for short trades.
### 3.7 Exit Settings
- **Use MA Cross for Exit** (`use_ma_exit`):
- **Default**: `true`.
- **Effect**: If `true`, closes trades when the price crosses the exit MA (below for long, above for short).
- **MA Length for Exit** (`ma_exit_length`):
- **Default**: `20`.
- **Range**: Minimum `1`.
- **Effect**: Sets the period for the exit MA. Longer periods delay exits.
- **MA Type for Exit** (`ma_exit_type`):
- **Options**: `SMA`, `EMA`, `SMMA (RMA)`, `WMA`, `VWMA`.
- **Default**: `SMA`.
- **Effect**: Determines the MA type for exit signals. EMA is more responsive; VWMA weights by volume.
- **Use ADX Change Stop-Loss** (`use_adx_stop`):
- **Default**: `false`.
- **Effect**: If `true`, closes trades when the ADX changes by a specified percentage.
- **ADX % Change for Stop-Loss** (`adx_change_percent`):
- **Default**: `5.0`.
- **Range**: Minimum `0.0`, step `0.1`.
- **Effect**: Specifies the percentage change in ADX (vs. previous bar) that triggers a stop-loss. Higher values reduce premature exits.
- **Use Performance Stop-Loss** (`use_perf_stop`):
- **Default**: `false`.
- **Effect**: If `true`, closes trades when the loss exceeds a percentage threshold.
- **Performance Stop-Loss (%)** (`perf_stop_percent`):
- **Default**: `-10.0`.
- **Range**: `-100.0` to `0.0`, step `0.1`.
- **Effect**: Specifies the loss percentage that triggers a stop-loss. More negative values allow larger losses before exiting.
## 4. Visual and Statistical Output
- **Labels**: Displayed at trade entries/exits with arrows (↑ for buy, ↓ for sell) and text ("BUY," "SELL"). A "No Equity" label appears if equity is zero.
- **Background Coloring**: Optionally colors the chart background (green for long, red for short) to indicate open trades.
- **Statistics Table**: Displayed at the top center of the chart, updated on timeframe changes or trade events. Includes:
- **Capital Metrics**: Initial capital, current capital, capital growth (%).
- **Trade Metrics**: Total trades, long/short trades, win rate, long/short win rates, profit factor.
- **Open Trade Status**: Indicates if a long, short, or no trade is open.
## 5. Alerts
- **Buy Signal Alert**: Triggered when `buy_signal` is true ("Cross Buy Signal").
- **Sell Signal Alert**: Triggered when `sell_signal` is true ("Cross Sell Signal").
- **Usage**: Users can set up TradingView alerts to receive notifications for trade signals.

VWAP-RSI Scalper FINAL v1Description
This script implements a robust, battle-tested intraday scalping strategy designed for prop firm challenges, funded trader programs, and serious futures scalpers.
It combines VWAP, RSI, EMA trend, and ATR-based risk management to capture high-probability mean reversion and momentum moves during the most liquid hours of the trading day.
Core Logic
RSI (Relative Strength Index):
Trades are triggered when the RSI is either oversold or overbought using a short lookback (default: 3). This ensures only the strongest intraday reversals or exhaustion moves are considered.
VWAP Filter:
Longs are only taken above VWAP, shorts only below VWAP, aligning trades with the session’s dominant bias.
EMA Filter:
Additional trend quality filter—longs require price above EMA, shorts below EMA.
Session Control:
Only trades between user-defined session hours (default: US cash session), eliminating overnight/illiquid action.
ATR-based Dynamic Stops & Targets:
Every trade uses a stop loss at 1x ATR and a take profit at 2x ATR for a positive risk/reward ratio.
Max Trades Per Day:
Prevents overtrading and controls risk exposure (default: 3).
Performance (Sample Backtest)
Profit Factor: 1.37+ (prop-firm quality)
Drawdown: <1% (very conservative risk)
Win Rate: 37–48% (RR > 1, so high edge)
Consistency: Smooth, steady equity curve over hundreds of trades.
Best For:
ES/NQ/CL/GC intraday traders
Prop firm evaluation challenges (Tradeify, Topstep, Apex, etc.)
Anyone needing robust, no-nonsense systematic edge for futures or indices.
How to Use & Tune
Apply to 3min, 5min, or 15min charts of liquid futures or indices.
Change parameters in the settings panel to suit your asset, volatility, or session hours.
Use “Strategy Tester” to validate P&L, win rate, and drawdown.
How to Optimize
Raise/lower RSI length or bands to make signals more/less frequent.
Adjust stop/target multiples for your preferred risk/reward profile.
Change session hours to match your broker or market.
Disclaimer
This is not financial advice. Use on a demo or sim account first. Results will vary by market, slippage, and execution speed. Past performance does not guarantee future results.
If you find this useful, please give it a like, follow for more strategies, and comment your results or questions!
Good luck and safe trading!

Enhanced Market Structure StrategyATR-Based Risk Management:
Stop Loss: 2 ATR from entry (configurable)
Take Profit: 3 ATR from entry (configurable)
Dynamic Position Sizing: Based on ATR stop distance and max risk percentage
Advanced Signal Filters:
RSI Filter:
Long trades: RSI < 70 and > 40 (avoiding overbought)
Short trades: RSI > 30 and < 60 (avoiding oversold)
Volume Filter:
Requires volume > 1.2x the 20-period moving average
Ensures institutional participation
MACD Filter (Optional):
Long: MACD line above signal line and rising
Short: MACD line below signal line and falling
EMA Trend Filter:
50-period EMA for trend confirmation
Long trades require price above rising EMA
Short trades require price below falling EMA
Higher Timeframe Filter:
Uses 4H/Daily EMA for multi-timeframe confluence
Enhanced Entry Logic:
Regular Entries: IDM + BOS + ALL filters must pass
Sweep Entries: Failed breakouts with tighter stops (1.6 ATR)
High-Probability Focus: Only trades when multiple confirmations align
Visual Improvements:
Detailed Entry Labels: Show entry, stop, target, and risk percentage
SL/TP Lines: Visual representation of risk/reward
Filter Status: Bar coloring shows when all filters align
Comprehensive Statistics: Real-time performance metrics
Key Strategy Parameters:
pinescript// Recommended Settings for Different Markets:
// Forex (4H-Daily):
// - CHoCH Period: 50-75
// - ATR SL: 2.0, ATR TP: 3.0
// - All filters enabled
// Crypto (1H-4H):
// - CHoCH Period: 30-50
// - ATR SL: 2.5, ATR TP: 4.0
// - Volume filter especially important
// Indices (4H-Daily):
// - CHoCH Period: 50-100
// - ATR SL: 1.8, ATR TP: 2.7
// - EMA and MACD filters crucial
Expected Performance Improvements:
Win Rate: 55-70% (improved filtering)
Profit Factor: 2.0-3.5+ (better risk/reward with ATR)
Reduced Drawdown: Stricter filters reduce false signals
Consistent Risk: ATR-based stops adapt to volatility
This enhanced version provides much more robust signal filtering while maintaining the core market structure edge, resulting in higher-probability trades with consistent risk management.

Fractal Breakout Trend Following StrategyOverview
The Fractal Breakout Trend Following Strategy is a trend-following system which utilizes the Willams Fractals and Alligator to execute the long trades on the fractal's breakouts which have a high probability to be the new uptrend phase beginning. This system also uses the normalized Average True Range indicator to filter trades after a large moves, because it's more likely to see the trend continuation after a consolidation period. Strategy can execute only long trades.
Unique Features
Trend and volatility filtering system: Strategy uses Williams Alligator to filter the counter-trend fractals breakouts and normalized Average True Range to avoid the trades after large moves, when volatility is high
Configurable Trading Periods: Users can tailor the strategy to specific market windows, adapting to different market conditions.
Flexible Risk Management: Users can choose the stop-loss percent (by default = 3%) for trades, but strategy also has the dynamic stop-loss level using down fractals.
Methodology
The strategy places stop order at the last valid fractal breakout level. Validity of this fractal is defined by the Williams Alligator indicator. If at the moment of time when price breaking the last fractal price is higher than Alligator's teeth line (8 period SMA shifted 5 bars in the future) this is a valid breakout. Moreover strategy has the additional volatility filtering system using normalized ATR. It calculates the average normalized ATR for last user-defined number of bars and if this value lower than the user-defined threshold value the long trade is executed.
When trade is opened, script places the stop loss at the price higher of two levels: user defined stop-loss from the position entry price or down fractal validation level. The down fractal is valid with the rule, opposite as the up fractal validation. Price shall break to the downside the last down fractal below the Willians Alligator's teeth line.
Strategy has no fixed take profit. Exit level changes with the down fractal validation level. If price is in strong uptrend trade is going to be active until last down fractal is not valid. Strategy closes trade when price hits the down fractal validation level.
Risk Management
The strategy employs a combined approach to risk management:
It allows positions to ride the trend as long as the price continues to move favorably, aiming to capture significant price movements. It features a user-defined stop-loss parameter to mitigate risks based on individual risk tolerance. By default, this stop-loss is set to a 3% drop from the entry point, but it can be adjusted according to the trader's preferences.
Justification of Methodology
This strategy leverages Williams Fractals to open long trade when price has broken the key resistance level to the upside. This resistance level is the last up fractal and is shall be broken above the Williams Alligator's teeth line to be qualified as the valid breakout according to this strategy. The Alligator filtering increases the probability to avoid the false breakouts against the current trend.
Moreover strategy has an additional filter using Average True Range(ATR) indicator. If average value of ATR for the last user-defined number of bars is lower than user-defined threshold strategy can open the long trade according to open trade condition above. The logic here is following: we want to open trades after period of price consolidation inside the range because before and after a big move price is more likely to be in sideways, but we need a trend move to have a profit.
Another one important feature is how the exit condition is defined. On the one hand, strategy has the user-defined stop-loss (3% below the entry price by default). It's made to give users the opportunity to restrict their losses according to their risk-tolerance. On the other hand, strategy utilizes the dynamic exit level which is defined by down fractal activation. If we assume the breaking up fractal is the beginning of the uptrend, breaking down fractal can be the start of downtrend phase. We don't want to be in long trade if there is a high probability of reversal to the downside. This approach helps to not keep open trade if trend is not developing and hold it if price continues going up.
Backtest Results
Operating window: Date range of backtests is 2023.01.01 - 2024.05.01. It is chosen to let the strategy to close all opened positions.
Commission and Slippage: Includes a standard Binance commission of 0.1% and accounts for possible slippage over 5 ticks.
Initial capital: 10000 USDT
Percent of capital used in every trade: 30%
Maximum Single Position Loss: -3.19%
Maximum Single Profit: +24.97%
Net Profit: +3036.90 USDT (+30.37%)
Total Trades: 83 (28.92% win rate)
Profit Factor: 1.953
Maximum Accumulated Loss: 963.98 USDT (-8.29%)
Average Profit per Trade: 36.59 USDT (+1.12%)
Average Trade Duration: 72 hours
These results are obtained with realistic parameters representing trading conditions observed at major exchanges such as Binance and with realistic trading portfolio usage parameters.
How to Use
Add the script to favorites for easy access.
Apply to the desired timeframe and chart (optimal performance observed on 4h and higher time frames and the BTC/USDT).
Configure settings using the dropdown choice list in the built-in menu.
Set up alerts to automate strategy positions through web hook with the text: {{strategy.order.alert_message}}
Disclaimer:
Educational and informational tool reflecting Skyrex commitment to informed trading. Past performance does not guarantee future results. Test strategies in a simulated environment before live implementation

Momentum Alligator 4h Bitcoin StrategyOverview
The Momentum Alligator 4h Bitcoin Strategy is a trend-following trading system that operates on dual time frames. It utilizes the 1D Williams Alligator indicator to identify the prevailing major price trend and seeks trading opportunities on the 4-hour (4h) time frame when the momentum is turning up. The strategy is designed to close trades if the trend fails to develop or holding position if price continues increasing without any significant correction. Note that this strategy is specifically tailored for the 4-hour time frame.
Unique Features
2-layers market noise filtering system: Trades are only initiated in the direction of the 1D trend, determined by the Williams Alligator indicator. This higher time frame confirmation filters out minor trade signals, focusing on more substantial opportunities. At the same time, strategy has additional filter on 4h time frame with Awesome Oscillator which is showing the current price momentum.
Flexible Risk Management: The strategy exclusively opens long positions, resulting in fewer trades during bear markets. It incorporates a dynamic stop-loss mechanism, which can either follow the jaw line of the 4h Alligator or a user-defined fixed stop-loss. This flexibility helps manage risk and avoid non-trending markets.
Methodology
The strategy initiates a long position when the d-line of Stochastic RSI crosses up it's k-line. It means that there is a high probability that price momentum reversed from down to up. To avoid overtrading in potentially choppy markets, it skips the next two trades following a winning trade, anticipating sideways movement after a significant price surge.
This strategy has two layers trades filtering system: 4h and 1D time frames. The first one is awesome oscillator. It shall be increasing and value has to be higher than it's 5-period SMA. This is an additional confirmation that long trade is opened in the direction of the current momentum. As it was mentioned above, all entry signals are validated against the 1D Williams Alligator indicator. A trade is only opened if the price is above all three lines of the 1D Alligator, ensuring alignment with the major trend.
A trade is closed if the price hits the 4h jaw line of the Alligator or reaches the user-defined stop-loss level.
Risk Management
The strategy employs a combined approach to risk management:
It allows positions to ride the trend as long as the price continues to move favorably, aiming to capture significant price movements. It features a user-defined stop-loss parameter to mitigate risks based on individual risk tolerance. By default, this stop-loss is set to a 2% drop from the entry point, but it can be adjusted according to the trader's preferences.
Justification of Methodology
This strategy leverages Stochastic RSI on 4h time frame to open long trade when momentum started reversing to the upside. On the one hand, Stochastic RSI is one of the most sensitive indicator, which allows to react fast on the potential trend reversal. On the other hand, this indicator can be too sensitive and provide a lot of false trend changing signals. To eliminate this weakness we use two-layers trades filtering system.
The first layer is the 4h Awesome oscillator. This is less sensitive momentum indicator. Usually it starts increasing when price has already passed significant distance from the actual reversal point. The strategy opens long trade only is Awesome oscillator is increasing and above it's 5-period SMA. This approach increases the probability to filter the false signals during the choppy market or if the reversal is false.
The second layer filter is the Williams Alligator indicator on 1D time frame. The 1D Alligator serves as a filter for identifying the primary trend and increases probability to avoid the trades with low potential because trading against major trend usually is more risky. It's much better to catch the trend continuation than local bounce.
Last but not least feature of this strategy is close trades condition. It uses the flexible approach. First of all, user can set up the fixed stop-loss according to his own risk-tolerance, by default this value is 2% of price movement. It restricts the potential loss at the moment when trade has just been opened. Moreover strategy utilizes the 4h Williams Alligator's jaw line to exit the trade. If price fell below it trade is closed. This approach helps to not keep open trade if trend is not developing and hold it if price continues going up.
Backtest Results:
Operating window: Date range of backtests is 2021.01.01 - 2024.05.01. It is chosen to let the strategy to close all opened positions.
Commission and Slippage: Includes a standard Binance commission of 0.1% and accounts for possible slippage over 5 ticks.
Initial capital: 10000 USDT
Percent of capital used in every trade: 50%
Maximum Single Position Loss: -3.04%
Maximum Single Profit: +29.67%
Net Profit: +6228.01 USDT (+62.28%)
Total Trades: 118 (24.58% win rate)
Profit Factor: 1.71
Maximum Accumulated Loss: 1527.69 USDT (-11.52%)
Average Profit per Trade: 52.78 USDT (+0.89%)
Average Trade Duration: 60 hours
These results are obtained with realistic parameters representing trading conditions observed at major exchanges such as Binance and with realistic trading portfolio usage parameters.
How to Use:
Add the script to favorites for easy access.
Apply to the 4h timeframe desired chart (optimal performance observed on the BTC/USDT).
Configure settings using the dropdown choice list in the built-in menu.
Set up alerts to automate strategy positions through web hook with the text: {{strategy.order.alert_message}}
Disclaimer:
Educational and informational tool reflecting Skyrex commitment to informed trading. Past performance does not guarantee future results. Test strategies in a simulated environment before live implementation

Quantitative Backtesting Panel + ROI Table - ShortsThis script is an aggregate of a backtesting panel with quantitative metrics, ROI table and open ROI reader. It also contains a mechanism for having a fixed percentage stop loss, similar to native TV backtester. For shorts only.
Backtesting Panel:
- Certain metrics are color coded, with green being good performance, orange being neutral, red being undesirable.
• ROI : return with the system, in %
• ROI(COMP=1): return if money is compounded at a rate of 100%
• Hit rate: accuracy of the system, as a %
• Profit factor: gross profit/gross loss
• Maximum drawdown: the maximum value from a peak to a successive trough of the system's equity curve
• MAE: Maximum Adverse Excursion. The biggest loss of a trade suffered while the position is still open
• Total trades: total number of closed trades
• Max gain/max loss: shows the biggest win over the biggest loss suffered
• Sharpe ratio: measures the performance of the system with adjusted risk (no comparison to risk-free asset)
• CAGR: Compound Annual Growth Rate. The mean annual rate of growth of the system of n years (provided n>1)
• Kurtosis: measures how heavily the tails of the distribution differ from that of a normal distribution (symmetric on both sides of mean where mean=0, standard deviation=1). A normal distribution has a kurtosis of 3, and skewness of 0. The kurtosis indicates whether or not the tails of the returns contain extreme values
• Skewness: measures the symmetry of the distribution of returns
- Leptokurtic: K > 0. Having more kurtosis than a normal distribution. It's stretched up and to the side too (2nd pic down). High kurtosis (leptokurtic) is bad as the wider tails (called heavy tails) suggest there is relatively high probability of extreme events
- Mesokurtic: K =0. Having the same kurtosis as a normal distribution
- Platykurtic: K < 0. Having less kurtosis than a normal distribution. This suggests there are light tails and fewer extreme events in the distribution
- Skewness is good: +/- 0.5 (fairly symmetrical)
- Skewness is average: -1 to -0.5 or 0.5 to 1 (moderately skewed)
- Skewness is bad: > +/- 1 (highly skewed)
Evolving ROI table:
- The table of ROI values evolve with the year and month. The sum of each year is given. Please avoid using it on non-cryptocurrencies or any market whose trading session is not 24/7
Open ROI reader:
- At the top center is the open ROI of a trade

Quantitative Backtesting Panel + ROI Table - LongsThis script is an aggregate of a backtesting panel with quantitative metrics, ROI table and open ROI reader. It also contains a mechanism for having a fixed percentage stop loss, similar to native TV backtester. For longs only.
Backtesting Panel:
- Certain metrics are color coded, with green being good performance, orange being neutral, red being undesirable.
• ROI : return with the system, in %
• ROI(COMP=1): return if money is compounded at a rate of 100%
• Hit rate: accuracy of the system, as a %
• Profit factor: gross profit/gross loss
• Maximum drawdown: the maximum value from a peak to a successive trough of the system's equity curve
• MAE: Maximum Adverse Excursion. The biggest loss of a trade suffered while the position is still open
• Total trades: total number of closed trades
• Max gain/max loss: shows the biggest win over the biggest loss suffered
• Sharpe ratio: measures the performance of the system with adjusted risk (no comparison to risk-free asset)
• CAGR: Compound Annual Growth Rate. The mean annual rate of growth of the system of n years (provided n>1)
• Kurtosis: measures how heavily the tails of the distribution differ from that of a normal distribution (symmetric on both sides of mean where mean=0, standard deviation=1). A normal distribution has a kurtosis of 3, and skewness of 0. The kurtosis indicates whether or not the tails of the returns contain extreme values
• Skewness: measures the symmetry of the distribution of returns
- Leptokurtic: K > 0. Having more kurtosis than a normal distribution. It's stretched up and to the side too (2nd pic down). High kurtosis (leptokurtic) is bad as the wider tails (called heavy tails) suggest there is relatively high probability of extreme events
- Mesokurtic: K =0. Having the same kurtosis as a normal distribution
- Platykurtic: K < 0. Having less kurtosis than a normal distribution. This suggests there are light tails and fewer extreme events in the distribution
- Skewness is good: +/- 0.5 (fairly symmetrical)
- Skewness is average: -1 to -0.5 or 0.5 to 1 (moderately skewed)
- Skewness is bad: > +/- 1 (highly skewed)
Evolving ROI table:
- The table of ROI values evolve with the year and month. The sum of each year is given. Please avoid using it on non-cryptocurrencies or any market whose trading session is not 24/7
Open ROI reader:
- At the top center is the open ROI of a trade

Close v Open Moving Averages Strategy (Variable) [divonn1994]This is a simple moving average based strategy that works well with a few different coin pairings. It takes the moving average 'opening' price and plots it, then takes the moving average 'closing' price and plots it, and then decides to enter a 'long' position or exit it based on whether the two lines have crossed each other. The reasoning is that it 'enters' a position when the average closing price is increasing. This could indicate upwards momentum in prices in the future. It then exits the position when the average closing price is decreasing. This could indicate downwards momentum in prices in the future. This is only speculative, though, but sometimes it can be a very good indicator/strategy to predict future action.
What I've found is that there are a lot of coins that respond very well when the appropriate combination of: 1) type of moving average is chosen (EMA, SMA, RMA, WMA or VWMA) & 2) number of previous bars averaged (typically 10 - 250 bars) are chosen.
Depending on the coin.. each combination of MA and Number of Bars averaged can have completely different levels of success.
Example of Usage:
An example would be that the VWMA works well for BTCUSD (BitStamp), but it has different successfulness based on the time frame. For the 12 hour bar timeframe, with the 66 bar average with the VWMA I found the most success. The next best successful combo I've found is for the 1 Day bar timeframe with the 35 bar average with the VWMA.. They both have a moving average that records about a month, but each have a different successfulness. Below are a few pair combos I think are noticeable because of the net profit, but there are also have a lot of potential coins with different combos:
It's interesting to see the strategy tester change as you change the settings. The below pairs are just some of the most interesting examples I've found, but there might be other combos I haven't even tried on different coin pairs..
Some strategy settings:
BTCUSD (BitStamp) 12 Hr Timeframe : 66 bars, VWMA=> 10,387x net profit
BTCUSD (BitStamp) 1 Day Timeframe : 35 bars, VWMA=> 7,805x net profit
BNBUSD (Binance) 12 Hr Timeframe : 27 bars, VWMA => 15,484x net profit
ETHUSD (BitStamp) 16 Hr Timeframe : 60 bars, SMA => 5,498x net profit
XRPUSD (BitStamp) 16 Hr Timeframe : 33 bars, SMA => 10,178x net profit
I only chose these coin/combos because of their insane net profit factors. There are far more coins with lower net profits but more reliable trade histories.
Also, usually when I want to see which of these strategies might work for a coin pairing I will check between the different Moving Average types, for example the EMA or the SMA, then I also check between the moving average lengths (the number of bars calculated) to see which is most profitable over time.
Features:
-You can choose your preferred moving average: SMA, EMA, WMA, RMA & VWMA.
-You can also adjust the previous number of calculated bars for each moving average.
-I made the background color Green when you're currently in a long position and Red when not. I made it so you can see when you'd be actively in a trade or not. The Red and Green background colors can be toggled on/off in order to see other indicators more clearly overlayed in the chart, or if you prefer a cleaner look on your charts.
-I also have a plot of the Open moving average and Close moving average together. The Opening moving average is Purple, the Closing moving average is White. White on top is a sign of a potential upswing and purple on top is a sign of a potential downswing. I've made this also able to be toggled on/off.
Please, comment interesting pairs below that you've found for everyone :) thank you!
I will post more pairs with my favorite settings as well. I'll also be considering the quality of the trades.. for example: net profit, total trades, percent profitable, profit factor, trade window and max drawdown.
*if anyone can figure out how to change the date range, I woul really appreciate the help. It confuses me -_- *

SQZ Multiframe StrategyThis is a first attempt to automate what my current strategy when trading is.
It uses 2 timeframes: the one you are currently using to see the chart and an "anchor trend" which is a higher order frame.
Supported timeframes are: 1m, 5m, 15m, 30m, 1H, 4H, 1D, 1W
The Strategy relies on two indicators:
Squeeze Momentum Indicator
CMF
How does it works?
It looks for a moment when the following conditions are met.
For Long:
Positive directionality in SQZM monitor in anchor timeframe
Positive directionality in SQZM monitor in current timeframe
Recent minimum in CMF
For Short:
Negative directionality in SQZM monitor in anchor timeframe
Negative directionality in SQZM monitor in current timeframe
Recent maximum in CMF
After a BUY or SELL order is executed the plot will start showing two lines: A TP line, and a SL line.
The TP and SL move dynamically based on a greedy algorithm based on 3 input parameters.
Min Profit to Start Moving SL (%): Sets an initial target for the trade.
Maximum Possible of SL (%): This is the maximum amount possible for SL. If volatility is not too high, a shorter SL will be chosen based on Kaufman's Stops method
Take profit factor: Is how much portion of the target I am taking as profit once the target is reached
Example for 5% Min profit:
When the first target is reached (+5%), the SL will be updated to 2.5% over the enter price.
When the second target is reached (+10%), the SL will be updated to 5% over the enter price.
Note: The strategy might abandon the position prematurely if a contrary signal is received while the trade is opened, and will change direction.
The Strategy has been backtested mostly for crypto. It might be good for stocks too, but the parameters mentioned might need some adjustments since price moves at a different rate.
Recommended timeframe is 4H for BTC , and 30min/1H for alts.
Comments and ideas are more than welcome!

DNSE VN301!, ADX Momentum StrategyDiscover the tailored Pine Script for trading VN30F1M Futures Contracts intraday.
This strategy applies the Statistical Method (IQR) to break down the components of the ADX, calculating the threshold of "normal" momentum fluctuations in price to identify potential breakouts for entry and exit signals. The script automatically closes all positions by 14:30 to avoid overnight holdings.
www.tradingview.com
Settings & Backtest Results:
- Chart: 30-minute timeframe
- Initial capital: VND 100 million
- Position size: 4 contracts per trade (includes trading fees, excludes tax)
- Backtest period: Sep-2021 to Sep-2025
- Return: over 270% (with 5 ticks slippage)
- Trades executed: 1,000+
- Win rate: ~40%
- Profit factor: 1.2
Default Script Settings:
Calculates the acceleration of changes in the +DI and -DI components of the ADX, using IQR to define "normal" momentum fluctuations (adjustable via Lookback period).
Calculates the difference between each bar’s Open and Close prices, using IQR to define "normal" gaps (adjustable via Lookback period).
Entry & Exit Conditions:
Entry Long: Change in +DI or -DI > Avg IQR Value AND Close Price > Previous Close
Exit Long: (all 4 conditions must be met)
- Change in +DI or -DI > Avg IQR Value
- RSI < Previous RSI
- Close–Open Gap > Avg IQR Gap
- Close Price < Previous Close
Entry Short: Change in +DI or -DI > Avg IQR Value AND Close Price < Previous Close
Exit Short: (all 4 conditions must be met)
- Change in +DI or -DI > Avg IQR Value
- RSI > Previous RSI
- Close–Open Gap > Avg IQR Gap
- Close Price > Previous Close
Disclaimers:
Trading futures contracts carries a high degree of risk, and price movements can be highly volatile. This script is intended as a reference tool only. It should be used by individuals who fully understand futures trading, have assessed their own risk tolerance, and are knowledgeable about the strategy’s logic.
All investment decisions are the sole responsibility of the user. DNSE bears no liability for any potential losses incurred from applying this strategy in real trading. Past performance does not guarantee future results. Please contact us directly if you have specific questions about this script.

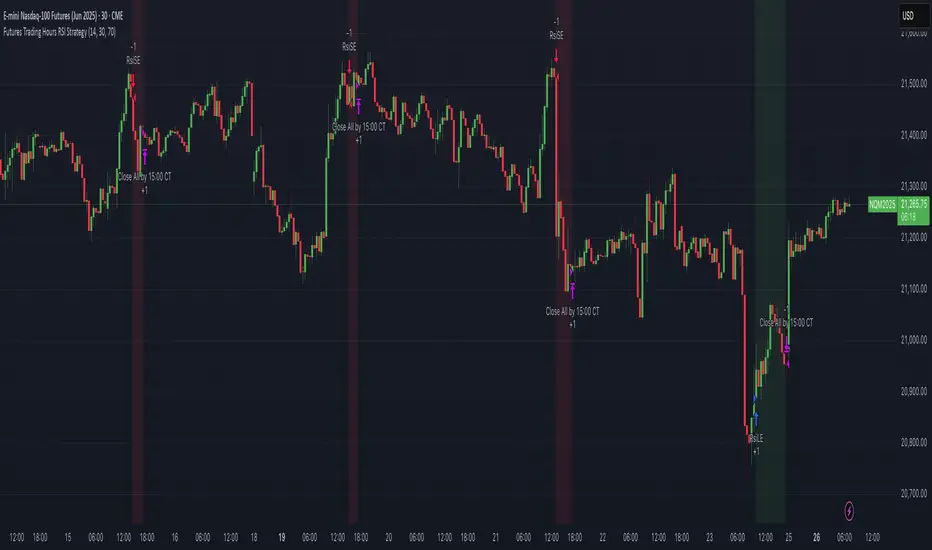
Futures Trading Hours RSI StrategyFutures Trading Hours RSI Strategy
A lightweight, session-filtered RSI strategy designed for equity-index futures (e.g. NQ, ES, YM) on a 30-minute chart. It dynamically enters long when RSI crosses above your oversold threshold and short when RSI crosses below your overbought threshold—but only during regular U.S. trading hours (08:30–15:00 CT, Monday–Friday). All positions are set to close at 15:00 CT to avoid overnight risk, and optional background shading highlights your open longs (green) and shorts (red).
⸻
Key Features
• RSI-based entries: configurable length, oversold, and overbought levels
• Session filter: trades only between 08:30–15:00 CT, Monday through Friday
• Automatic exit: closes all positions at or after 15:00 CT each day
• Visual cues: optional background shading for open long/short positions
• Easy customization: adjust length, overSold, overBought, and time offsets
Backtest Performance (NQ Jun 2025, 30 min)
• Total P&L: +$10,230 (+1.02%)
• Profit Factor: 4.61
• Win Rate: 57.1% (4 wins / 7 trades)
• Max Drawdown: $2,215 (0.22%)
(Results shown are for illustrative purposes only; past performance does not guarantee future returns.)
How to Use
1. Add this script to your 30-minute futures chart.
2. Tweak the RSI parameters and time-zone offset to suit your instrument.
3. Enable “background shading” if you’d like a visual reminder of open positions.
4. Run in paper-trade mode to validate performance before going live.
⸻
⚠️ Disclaimer: Trading carries risk. Always backtest and paper-trade before using real capital. Adjust position sizing and risk controls to your own tolerance.
Equities Risk Tool [vnhilton]To quickly apply this indicator onto the chart, open the source code in Pine Editor & click 'Add to chart'. Perhaps in the future, TradingView will add a feature where you can have favourited indicators on the favourites toolbar alongside the favourited drawing tools. 🤔
Traders will need to calculate how many shares are needed for their position, where if price goes against them towards their stop loss, then they'll lose the amount that they risked on that trade. The formula for this is: Amount willing to risk / Stop loss distance. Traders can carry out these calculations via a calculator, spreadsheet or a simple program with outputs generated from inputs. These 3 methods have 1 thing in common, & it's that you have to manually input the the values, which isn't very convenient, especially for traders trading in a fast paced environment, where milliseconds matter. This indicator is similar to TradingView's Long & Short Position tools, & removes this inconvenience by allowing you to only click to submit your entry & stop out levels, without having to type a single thing (the only thing that would require typing is your account equity in the settings).
This indicator will display lines on the chart showing the entry, stop-out & several profit target levels. The entry & stop-out levels can be moved in any direction as desired, & the profit target levels following suit. You're able to adjust the different profit factors if you're aiming for different reward targets (e.g. You want a 1:2 RR trade, so the profit factor here will be 2 - 2 times the distance between the entry level & stop out level).
A table will also be displayed showing the direction of the position, alongside the shares required for several account risks which is useful if trading different quality setups from A-D for example. The calculated shares displayed are also shown in proportions as well. Here, you're able to see 25%-50%-75%-100% of calculated shares, which may be useful when scaling in/out of trades. All mentioned features are customisable.
Calculated shares for long & short positions can be rounded down to any decimal places. This can be useful if you intend to trade e.g. in batches of 100, then you would use a round down factor of -2.

PineScript v4 - Forex Pin-Bar Trading StrategyPineScript v4, forex trading robot based on the commonly used bullish / bearish pin-bar piercing the moving averages strategy.
I coded this robot to stress-test the PineScript v4 language to see how advanced it is, and whether I could port a forex trading strategy from MT4 to TradingView.
In my opinion, PineScript v4 is still not a professional coding language; for example you cannot use IF-statements to modify the contents of global variables; this makes complex robot behaviour difficult to implement. In addition, it is unclear if the programmer can use nested IF-ELSE, or nested FOR within IF.
The sequence of program execution is also unclear, and although complex order entry and exit appears to function properly, I am not completely comfortable with it.
Recommended Chart Settings:
Asset Class: Forex
Time Frame: H1
Long Entry Conditions:
a) Moving Average up trend, fast crosses above slow
b) Presence of a Bullish Pin Bar
c) Pin Bar pierces either Moving Average
d) Moving Averages must be sloping up, angle threshold (optional)
Short Entry Conditions:
a) Moving Average down trend, fast crosses below slow
b) Presence of a Bearish Pin Bar
c) Pin Bar pierces either Moving Average
d) Moving Averages must be sloping down, angle threshold (optional)
Exit Conditions:
a) Stoploss level is hit
b) Takeprofit level is hit
c) Moving Averages cross-back (optional)
Default Robot Settings:
Equity Risk (%): 3 //how much account balance to risk per trade
Stop Loss (x*ATR, Float): 2.1 //stoploss = x * ATR, you can change x
Risk : Reward (1 : x*SL, Float): 3.1 //takeprofit = x * stop_loss_distance, you can change x
Fast MA (Period): 20 //fast moving average period
Slow MA (Period): 50 //slow moving average period
ATR (Period): 14 //average true range period
Use MA Slope (Boolean): true //toggle the requirement of the moving average slope
Bull Slope Angle (Deg): 1 //angle above which, moving average is considered to be sloping up
Bear Slope Angle (Deg): -1 //angle below which, moving average is considered to be sloping down
Exit When MA Re-Cross (Boolean): true //toggle, close trade if moving average crosses back
Cancel Entry After X Bars (Period): 3 //cancel the order after x bars not triggered, you can change x
Backtest Results (2019 to 2020, H1, Default Settings):
EURJPY - 111% profit, 2.631 profit factor, 16.43% drawdown
EURUSD - 103% profit, 2.899 profit factor, 14.95% drawdown
EURAUD - 76.75% profit, 1.8 profit factor, 17.99% drawdown
NZDUSD - 64.62% profit, 1.727 profit factor, 19.14% drawdown
GBPUSD - 58.73% profit, 1.663 profit factor, 15.44% downdown
AUDJPY - 48.71% profit, 1.635 profit factor, 11.81% drawdown
USDCHF - 30.72% profit, 1.36 profit factor, 22.63% drawdown
AUDUSD - 8.54% profit, 1.092 profit factor, 19.86% drawdown
EURGBP - 0.03% profit, 1.0 profit factor, 29.66% drawdown
USDJPY - 1.96% loss, 0.972 profit factor, 28.37% drawdown
USDCAD - 6.36% loss, 0.891 profit factor, 21.14% drawdown
GBPJPY - 28.27% loss, 0.461 profit factor, 39.13% drawdown
To reduce the possibility of curve-fitting, this robot was backtested on 12 popular forex currencies, as shown above. The robot was profitable on 8 out of 12 currencies, breakeven on 1, and made a loss on 3.
The default robot settings could be over-fitting for the EUR, as we can see out-sized performance for the EUR pairs, with the exception of the EURGBP. We can see that GBPJPY made the largest loss, so these two pairs could be related.
Risk Warning:
This is a forex trading strategy that involves high risk of equity loss, and backtest performance will not equal future results. You agree to use this script at your own risk.

MACD + SMA 200 Strategy (by ChartArt)Here is a combination of the classic MACD (moving average convergence divergence indicator) with the classic slow moving average SMA with period 200 together as a strategy.
This strategy goes long if the MACD histogram and the MACD momentum are both above zero and the fast MACD moving average is above the slow MACD moving average. As additional long filter the recent price has to be above the SMA 200. If the inverse logic is true, the strategy goes short. For the worst case there is a max intraday equity loss of 50% filter.
Save another $999 bucks with my free strategy.
This strategy works in the backtest on the daily chart of Bitcoin, as well as on the S&P 500 and the Dow Jones Industrial Average daily charts. Current performance as of November 30, 2015 on the SPX500 CFD daily is percent profitable: 68% since the year 1970 with a profit factor of 6.4. Current performance as of November 30, 2015 on the DOWI index daily is percent profitable: 51% since the year 1915 with a profit factor of 10.8.
All trading involves high risk; past performance is not necessarily indicative of future results. Hypothetical or simulated performance results have certain inherent limitations. Unlike an actual performance record, simulated results do not represent actual trading. Also, since the trades have not actually been executed, the results may have under- or over-compensated for the impact, if any, of certain market factors, such as lack of liquidity. Simulated trading programs in general are also subject to the fact that they are designed with the benefit of hindsight. No representation is being made that any account will or is likely to achieve profits or losses similar to those shown.

Supertrend - Optimised Exit We created a small script that will allow you to have a quick look into static SL/PT to choose from. This might save you time, replacing the manual search for optimal SL/PT.
We're checking signals of the strategy and computing its performance with a grid of SL/PT selected.
We used SuperTrend signals in this example, but it will be straightforward to integrate your signals.
In addition to total Return, we compute MAX Dd and Profit Factor. Other metrics can be implemented as well.
Thanks to @MUQWISHI for helping code it.
Disclaimer
Please remember that past performance may not indicate future results.
Due to various factors, including changing market conditions, the strategy may no longer perform as well as in historical backtesting.
This post and the script don’t provide any financial advice.

The Lazy Trader - Index (ETF) Trend Following Robot50/150 moving average, index (ETF) trend following robot. Coded for people who cannot psychologically handle dollar-cost-averaging through bear markets and extreme drawdowns (although DCA can produce better results eventually), this robot helps you to avoid bear markets. Be a fair-weathered friend of Mr Market, and only take up his offer when the sun is shining! Designed for the lazy trader who really doesn't care...
Recommended Chart Settings:
Asset Class: ETF
Time Frame: Daily
Necessary ETF Macro Conditions:
a) Country must have healthy demographics, good ratio of young > old
b) Country population must be increasing
c) Country must be experiencing price-inflation
Default Robot Settings:
Slow Moving Average: 50 (integer) //adjust to suit your underlying index
Fast Moving Average: 150 (integer) //adjust to suit your underlying index
Bullish Slope Angle: 5 (degrees) //up angle of moving averages
Bearish Slope Angle: -5 (degrees) //down angle of moving averages
Average True Range: 14 (integer) //input for slope-angle formula
Risk: 100 (%) //100% risk means using all equity per trade
ETF Test Results (Default Settings):
SPY (1993 to 2020, 27 years), 332% profit, 20 trades, 6.4 profit factor, 7% drawdown
EWG (1996 to 2020, 24 years), 310% profit, 18 trades, 3.7 profit factor, 10% drawdown
EWH (1996 to 2020, 24 years), 4% loss, 26 trades, 0.9 profit factor, 36% drawdown
QQQ (1999 to 2020, 21 years), 232% profit, 17 trades, 3.6 profit factor, 2% drawdown
EEM (2003 to 2020, 17 years), 73% profit, 17 trades, 1.1 profit factor, 3% drawdown
GXC (2007 to 2020, 13 years), 18% profit, 14 trades, 1.3 profit factor, 26% drawdown
BKF (2009 to 2020, 11 years), 11% profit, 13 trades, 1.2 profit factor, 33% drawdown
A longer time in the markets is better, with the exception of EWH. 6 out of 7 tested ETFs were profitable, feel free to test on your favourite ETF (default settings) and comment below.
Risk Warning:
Not tested on commodities nor other financial products like currencies (code will not work), feel free to leave comments below.
Moving Average Slope Angle Formula:
Reproduced and modified from source:

Stochastic Hash Strat [Hash Capital Research]# Stochastic Hash Strategy by Hash Capital Research
## 🎯 What Is This Strategy?
The **Stochastic Slow Strategy** is a momentum-based trading system that identifies oversold and overbought market conditions to capture mean-reversion opportunities. Think of it as a "buy low, sell high" approach with smart mathematical filters that remove emotion from your trading decisions.
Unlike fast-moving indicators that generate excessive noise, this strategy uses **smoothed stochastic oscillators** to identify only the highest-probability setups when momentum truly shifts.
---
## 💡 Why This Strategy Works
Most traders fail because they:
- **Chase prices** after big moves (buying high, selling low)
- **Overtrade** in choppy, directionless markets
- **Exit too early** or hold losses too long
This strategy solves all three problems:
1. **Entry Discipline**: Only trades when the stochastic oscillator crosses in extreme zones (oversold for longs, overbought for shorts)
2. **Cooldown Filter**: Prevents revenge trading by forcing a waiting period after each trade
3. **Fixed Risk/Reward**: Pre-defined stop-loss and take-profit levels ensure consistent risk management
**The Math Behind It**: The stochastic oscillator measures where the current price sits relative to its recent high-low range. When it's below 25, the market is oversold (time to buy). When above 70, it's overbought (time to sell). The crossover with its moving average confirms momentum is shifting.
---
## 📊 Best Markets & Timeframes
### ⭐ OPTIMAL PERFORMANCE:
**Crude Oil (WTI) - 12H Timeframe**
- **Why it works**: Oil markets have predictable volatility patterns and respect technical levels
**AAVE/USD - 4H to 12H Timeframe**
- **Why it works**: DeFi tokens exhibit strong momentum cycles with clear extremes
### ✅ Also Works Well On:
- **BTC/USD** (12H, Daily) - Lower frequency but high win rate
- **ETH/USD** (8H, 12H) - Balanced volatility and liquidity
- **Gold (XAU/USD)** (Daily) - Classic mean-reversion asset
- **EUR/USD** (4H, 8H) - Lower volatility, requires patience
### ❌ Avoid Using On:
- Timeframes below 4H (too much noise)
- Low-liquidity altcoins (wide spreads kill performance)
- Strongly trending markets without pullbacks (Bitcoin in 2021)
- News-driven instruments during major events
---
## 🎛️ Understanding The Settings
### Core Stochastic Parameters
**Stochastic Length (Default: 16)**
- Controls the lookback period for price comparison
- Lower = faster reactions, more signals (10-14 for volatile markets)
- Higher = smoother signals, fewer trades (16-21 for stable markets)
- **Pro tip**: Use 10 for crypto 4H, 16 for commodities 12H
**Overbought Level (Default: 70)**
- Threshold for short entries
- Lower values (65-70) = more trades, earlier entries
- Higher values (75-80) = fewer but higher-conviction trades
- **Sweet spot**: 70 works for most assets
**Oversold Level (Default: 25)**
- Threshold for long entries
- Higher values (25-30) = more trades, earlier entries
- Lower values (15-20) = fewer but stronger bounce setups
- **Sweet spot**: 20-25 depending on market conditions
**Smooth K & Smooth D (Default: 7 & 3)**
- Additional smoothing to filter out whipsaws
- K=7 makes the indicator slower and more reliable
- D=3 is the signal line that confirms the trend
- **Don't change these unless you know what you're doing**
---
### Risk Management
**Stop Loss % (Default: 2.2%)**
- Automatically exits losing trades
- Should be 1.5x to 2x your average market volatility
- Too tight = death by a thousand cuts
- Too wide = uncontrolled losses
- **Calibration**: Check ATR indicator and set SL slightly above it
**Take Profit % (Default: 7%)**
- Automatically exits winning trades
- Should be 2.5x to 3x your stop loss (reward-to-risk ratio)
- This default gives 7% / 2.2% = 3.18:1 R:R
- **The golden rule**: Never have R:R below 2:1
---
### Trade Filters
**Bar Cooldown Filter (Default: ON, 3 bars)**
- **What it does**: Forces you to wait X bars after closing a trade before entering a new one
- **Why it matters**: Prevents emotional revenge trading and overtrading in choppy markets
- **Settings guide**:
- 3 bars = Standard (good for most cases)
- 5-7 bars = Conservative (oil, slow-moving assets)
- 1-2 bars = Aggressive (only for experienced traders)
**Exit on Opposite Extreme (Default: ON)**
- Closes your long when stochastic hits overbought (and vice versa)
- Acts as an early profit-taking mechanism
- **Leave this ON** unless you're testing other exit strategies
**Divergence Filter (Default: OFF)**
- Looks for price/momentum divergences for additional confirmation
- **When to enable**: Trending markets where you want fewer but higher-quality trades
- **Keep OFF for**: Mean-reverting markets (oil, forex, most of the time)
---
## 🚀 Quick Start Guide
### Step 1: Set Up in TradingView
1. Open TradingView and navigate to your chart
2. Click "Pine Editor" at the bottom
3. Copy and paste the strategy code
4. Click "Add to Chart"
5. The strategy will appear in a separate pane below your price chart
### Step 2: Choose Your Market
**If you're trading Crude Oil:**
- Timeframe: 12H
- Keep all default settings
- Watch for signals during London/NY overlap (8am-11am EST)
**If you're trading AAVE or crypto:**
- Timeframe: 4H or 12H
- Consider these adjustments:
- Stochastic Length: 10-14 (faster)
- Oversold: 20 (more aggressive)
- Take Profit: 8-10% (higher targets)
### Step 3: Wait for Your First Signal
**LONG Entry** (Green circle appears):
- Stochastic crosses up below oversold level (25)
- Price likely near recent lows
- System places limit order at take profit and stop loss
**SHORT Entry** (Red circle appears):
- Stochastic crosses down above overbought level (70)
- Price likely near recent highs
- System places limit order at take profit and stop loss
**EXIT** (Orange circle):
- Position closes either at stop, target, or opposite extreme
- Cooldown period begins
### Step 4: Let It Run
The biggest mistake? **Interfering with the system.**
- Don't close trades early because you're scared
- Don't skip signals because you "have a feeling"
- Don't increase position size after a big win
- Don't revenge trade after a loss
**Follow the system or don't use it at all.**
---
### Important Risks:
1. **Drawdown Pain**: You WILL experience losing streaks of 5-7 trades. This is mathematically normal.
2. **Whipsaw Markets**: Choppy, range-bound conditions can trigger multiple small losses.
3. **Gap Risk**: Overnight gaps can cause your actual fill to be worse than the stop loss.
4. **Slippage**: Real execution prices differ from backtested prices (factor in 0.1-0.2% slippage).
---
## 🔧 Optimization Guide
### When to Adjust Settings:
**Market Volatility Increased?**
- Widen stop loss by 0.5-1%
- Increase take profit proportionally
- Consider increasing cooldown to 5-7 bars
**Getting Too Few Signals?**
- Decrease stochastic length to 10-12
- Increase oversold to 30, decrease overbought to 65
- Reduce cooldown to 2 bars
**Getting Too Many Losses?**
- Increase stochastic length to 18-21 (slower, smoother)
- Enable divergence filter
- Increase cooldown to 5+ bars
- Verify you're on the right timeframe
### A/B Testing Method:
1. **Run default settings for 50 trades** on your chosen market
2. Document: Win rate, profit factor, max drawdown, emotional tolerance
3. **Change ONE variable** (e.g., oversold from 25 to 20)
4. Run another 50 trades
5. Compare results
6. Keep the better version
**Never change multiple settings at once** or you won't know what worked.
---
## 📚 Educational Resources
### Key Concepts to Learn:
**Stochastic Oscillator**
- Developed by George Lane in the 1950s
- Measures momentum by comparing closing price to price range
- Formula: %K = (Close - Low) / (High - Low) × 100
- Similar to RSI but more sensitive to price movements
**Mean Reversion vs. Trend Following**
- This is a **mean reversion** strategy (price returns to average)
- Works best in ranging markets with defined support/resistance
- Fails in strong trending markets (2017 Bitcoin, 2020 Tech stocks)
- Complement with trend filters for better results
**Risk:Reward Ratio**
- The cornerstone of profitable trading
- Winning 40% of trades with 3:1 R:R = profitable
- Winning 60% of trades with 1:1 R:R = breakeven (after fees)
- **This strategy aims for 45% win rate with 2.5-3:1 R:R**
### Recommended Reading:
- *"Trading Systems and Methods"* by Perry Kaufman (Chapter on Oscillators)
- *"Mean Reversion Trading Systems"* by Howard Bandy
- *"The New Trading for a Living"* by Dr. Alexander Elder
---
## 🛠️ Troubleshooting
### "I'm not seeing any signals!"
**Check:**
- Is your timeframe 4H or higher?
- Is the stochastic actually reaching extreme levels (check if your asset is stuck in middle range)?
- Is cooldown still active from a previous trade?
- Are you on a low-liquidity pair?
**Solution**: Switch to a more volatile asset or lower the overbought/oversold thresholds.
---
### "The strategy keeps losing money!"
**Check:**
- What's your win rate? (Below 35% is concerning)
- What's your profit factor? (Below 0.8 means serious issues)
- Are you trading during major news events?
- Is the market in a strong trend?
**Solution**:
1. Verify you're using recommended markets/timeframes
2. Increase cooldown period to avoid choppy markets
3. Reduce position size to 5% while you diagnose
4. Consider switching to daily timeframe for less noise
---
### "My stop losses keep getting hit!"
**Check:**
- Is your stop loss tighter than the average ATR?
- Are you trading during high-volatility sessions?
- Is slippage eating into your buffer?
**Solution**:
1. Calculate the 14-period ATR
2. Set stop loss to 1.5x the ATR value
3. Avoid trading right after market open or major news
4. Factor in 0.2% slippage for crypto, 0.1% for oil
---
## 💪 Pro Tips from the Trenches
### Psychological Discipline
**The Three Deadly Sins:**
1. **Skipping signals** - "This one doesn't feel right"
2. **Early exits** - "I'll just take profit here to be safe"
3. **Revenge trading** - "I need to make back that loss NOW"
**The Solution:** Treat your strategy like a business system. Would McDonald's skip making fries because the cashier "doesn't feel like it today"? No. Systems work because of consistency.
---
### Position Management
**Scaling In/Out** (Advanced)
- Enter 50% position at signal
- Add 50% if stochastic reaches 10 (oversold) or 90 (overbought)
- Exit 50% at 1.5x take profit, let the rest run
**This is NOT for beginners.** Master the basic system first.
---
### Market Awareness
**Oil Traders:**
- OPEC meetings = volatility spikes (avoid or widen stops)
- US inventory reports (Wed 10:30am EST) = avoid trading 2 hours before/after
- Summer driving season = different patterns than winter
**Crypto Traders:**
- Monday-Tuesday = typically lower volatility (fewer signals)
- Thursday-Sunday = higher volatility (more signals)
- Avoid trading during exchange maintenance windows
---
## ⚖️ Legal Disclaimer
This trading strategy is provided for **educational purposes only**.
- Past performance does not guarantee future results
- Trading involves substantial risk of loss
- Only trade with capital you can afford to lose
- No one associated with this strategy is a licensed financial advisor
- You are solely responsible for your trading decisions
**By using this strategy, you acknowledge that you understand and accept these risks.**
---
## 🙏 Acknowledgments
Strategy development inspired by:
- George Lane's original Stochastic Oscillator work
- Modern quantitative trading research
- Community feedback from hundreds of backtests
Built with ❤️ for retail traders who want systematic, disciplined approaches to the markets.
---
**Good luck, stay disciplined, and trade the system, not your emotions.**

Hellenic EMA Matrix - PremiumHellenic EMA Matrix - Alpha Omega Premium
Complete User Guide
Table of Contents
Introduction
Indicator Philosophy
Mathematical Constants
EMA Types
Settings
Trading Signals
Visualization
Usage Strategies
FAQ
Introduction
Hellenic EMA Matrix is a premium indicator based on mathematical constants of nature: Phi (Phi - Golden Ratio), Pi (Pi), e (Euler's number). The indicator uses these universal constants to create dynamic EMAs that adapt to the natural rhythms of the market.
Key Features:
6 EMA types based on mathematical constants
Premium visualization with Neon Glow and Gradient Clouds
Automatic Fast/Mid/Slow EMA sorting
STRONG signals for powerful trends
Pulsing Ribbon Bar for instant trend assessment
Works on all timeframes (M1 - MN)
Indicator Philosophy
Why Mathematical Constants?
Traditional EMAs use arbitrary periods (9, 21, 50, 200). Hellenic Matrix goes further, using universal mathematical constants found in nature:
Phi (1.618) - Golden Ratio: galaxy spirals, seashells, human body proportions
Pi (3.14159) - Pi: circles, waves, cycles
e (2.71828) - Natural logarithm base: exponential growth, radioactive decay
Markets are also a natural system composed of millions of participants. Using mathematical constants allows tuning into the natural rhythms of market cycles.
Mathematical Constants
Phi (Phi) - Golden Ratio
Phi = 1.618033988749895
Properties:
Phi² = Phi + 1 = 2.618
Phi³ = 4.236
Phi⁴ = 6.854
Application: Ideal for trending movements and Fibonacci corrections
Pi (Pi) - Pi Number
Pi = 3.141592653589793
Properties:
2Pi = 6.283 (full circle)
3Pi = 9.425
4Pi = 12.566
Application: Excellent for cyclical markets and wave structures
e (Euler) - Euler's Number
e = 2.718281828459045
Properties:
e² = 7.389
e³ = 20.085
e⁴ = 54.598
Application: Suitable for exponential movements and volatile markets
EMA Types
1. Phi (Phi) - Golden Ratio EMA
Description: EMA based on the golden ratio
Period Formula:
Period = Phi^n × Base Multiplier
Parameters:
Phi Power Level (1-8): Power of Phi
Phi¹ = 1.618 → ~16 period (with Base=10)
Phi² = 2.618 → ~26 period
Phi³ = 4.236 → ~42 period (recommended)
Phi⁴ = 6.854 → ~69 period
Recommendations:
Phi² or Phi³ for day trading
Phi⁴ or Phi⁵ for swing trading
Works excellently as Fast EMA
2. Pi (Pi) - Circular EMA
Description: EMA based on Pi for cyclical movements
Period Formula:
Period = Pi × Multiple × Base Multiplier
Parameters:
Pi Multiple (1-10): Pi multiplier
1Pi = 3.14 → ~31 period (with Base=10)
2Pi = 6.28 → ~63 period (recommended)
3Pi = 9.42 → ~94 period
Recommendations:
2Pi ideal as Mid or Slow EMA
Excellently identifies cycles and waves
Use on volatile markets (crypto, forex)
3. e (Euler) - Natural EMA
Description: EMA based on natural logarithm
Period Formula:
Period = e^n × Base Multiplier
Parameters:
e Power Level (1-6): Power of e
e¹ = 2.718 → ~27 period (with Base=10)
e² = 7.389 → ~74 period (recommended)
e³ = 20.085 → ~201 period
Recommendations:
e² works excellently as Slow EMA
Ideal for stocks and indices
Filters noise well on lower timeframes
4. Delta (Delta) - Adaptive EMA
Description: Adaptive EMA that changes period based on volatility
Period Formula:
Period = Base Period × (1 + (Volatility - 1) × Factor)
Parameters:
Delta Base Period (5-200): Base period (default 20)
Delta Volatility Sensitivity (0.5-5.0): Volatility sensitivity (default 2.0)
How it works:
During low volatility → period decreases → EMA reacts faster
During high volatility → period increases → EMA smooths noise
Recommendations:
Works excellently on news and sharp movements
Use as Fast EMA for quick adaptation
Sensitivity 2.0-3.0 for crypto, 1.0-2.0 for stocks
5. Sigma (Sigma) - Composite EMA
Description: Composite EMA combining multiple active EMAs
Composition Methods:
Weighted Average (default):
Sigma = (Phi + Pi + e + Delta) / 4
Simple average of all active EMAs
Geometric Mean:
Sigma = fourth_root(Phi × Pi × e × Delta)
Geometric mean (more conservative)
Harmonic Mean:
Sigma = 4 / (1/Phi + 1/Pi + 1/e + 1/Delta)
Harmonic mean (more weight to smaller values)
Recommendations:
Enable for additional confirmation
Use as Mid EMA
Weighted Average - most universal method
6. Lambda (Lambda) - Wave EMA
Description: Wave EMA with sinusoidal period modulation
Period Formula:
Period = Base Period × (1 + Amplitude × sin(2Pi × bar / Frequency))
Parameters:
Lambda Base Period (10-200): Base period
Lambda Wave Amplitude (0.1-2.0): Wave amplitude
Lambda Wave Frequency (10-200): Wave frequency in bars
How it works:
Period pulsates sinusoidally
Creates wave effect following market cycles
Recommendations:
Experimental EMA for advanced users
Works well on cyclical markets
Frequency = 50 for day trading, 100+ for swing
Settings
Matrix Core Settings
Base Multiplier (1-100)
Multiplies all EMA periods
Base = 1: Very fast EMAs (Phi³ = 4, 2Pi = 6, e² = 7)
Base = 10: Standard (Phi³ = 42, 2Pi = 63, e² = 74)
Base = 20: Slow EMAs (Phi³ = 85, 2Pi = 126, e² = 148)
Recommendations by timeframe:
M1-M5: Base = 5-10
M15-H1: Base = 10-15 (recommended)
H4-D1: Base = 15-25
W1-MN: Base = 25-50
Matrix Source
Data source selection for EMA calculation:
close - closing price (standard)
open - opening price
high - high
low - low
hl2 - (high + low) / 2
hlc3 - (high + low + close) / 3
ohlc4 - (open + high + low + close) / 4
When to change:
hlc3 or ohlc4 for smoother signals
high for aggressive longs
low for aggressive shorts
Manual EMA Selection
Critically important setting! Determines which EMAs are used for signal generation.
Use Manual Fast/Slow/Mid Selection
Enabled (default): You select EMAs manually
Disabled: Automatic selection by periods
Fast EMA
Fast EMA - reacts first to price changes
Recommendations:
Phi Golden (recommended) - universal choice
Delta Adaptive - for volatile markets
Must be fastest (smallest period)
Slow EMA
Slow EMA - determines main trend
Recommendations:
Pi Circular (recommended) - excellent trend filter
e Natural - for smoother trend
Must be slowest (largest period)
Mid EMA
Mid EMA - additional signal filter
Recommendations:
e Natural (recommended) - excellent middle level
Pi Circular - alternative
None - for more frequent signals (only 2 EMAs)
IMPORTANT: The indicator automatically sorts selected EMAs by their actual periods:
Fast = EMA with smallest period
Mid = EMA with middle period
Slow = EMA with largest period
Therefore, you can select any combination - the indicator will arrange them correctly!
Premium Visualization
Neon Glow
Enable Neon Glow for EMAs - adds glowing effect around EMA lines
Glow Strength:
Light - subtle glow
Medium (recommended) - optimal balance
Strong - bright glow (may be too bright)
Effect: 2 glow layers around each EMA for 3D effect
Gradient Clouds
Enable Gradient Clouds - fills space between EMAs with gradient
Parameters:
Cloud Transparency (85-98): Cloud transparency
95-97 (recommended)
Higher = more transparent
Dynamic Cloud Intensity - automatically changes transparency based on EMA distance
Cloud Colors:
Phi-Pi Cloud:
Blue - when Pi above Phi (bullish)
Gold - when Phi above Pi (bearish)
Pi-e Cloud:
Green - when e above Pi (bullish)
Blue - when Pi above e (bearish)
2 layers for volumetric effect
Pulsing Ribbon Bar
Enable Pulsing Indicator Bar - pulsing strip at bottom/top of chart
Parameters:
Ribbon Position: Top / Bottom (recommended)
Pulse Speed: Slow / Medium (recommended) / Fast
Symbols and colors:
Green filled square - STRONG BULLISH
Pink filled square - STRONG BEARISH
Blue hollow square - Bullish (regular)
Red hollow square - Bearish (regular)
Purple rectangle - Neutral
Effect: Pulsation with sinusoid for living market feel
Signal Bar Highlights
Enable Signal Bar Highlights - highlights bars with signals
Parameters:
Highlight Transparency (88-96): Highlight transparency
Highlight Style:
Light Fill (recommended) - bar background fill
Thin Line - bar outline only
Highlights:
Golden Cross - green
Death Cross - pink
STRONG BUY - green
STRONG SELL - pink
Show Greek Labels
Shows Greek alphabet letters on last bar:
Phi - Phi EMA (gold)
Pi - Pi EMA (blue)
e - Euler EMA (green)
Delta - Delta EMA (purple)
Sigma - Sigma EMA (pink)
When to use: For education or presentations
Show Old Background
Old background style (not recommended):
Green background - STRONG BULLISH
Pink background - STRONG BEARISH
Blue background - Bullish
Red background - Bearish
Not recommended - use new Gradient Clouds and Pulsing Bar
Info Table
Show Info Table - table with indicator information
Parameters:
Position: Top Left / Top Right (recommended) / Bottom Left / Bottom Right
Size: Tiny / Small (recommended) / Normal / Large
Table contents:
EMA list - periods and current values of all active EMAs
Effects - active visual effects
TREND - current trend state:
STRONG UP - strong bullish
STRONG DOWN - strong bearish
Bullish - regular bullish
Bearish - regular bearish
Neutral - neutral
Momentum % - percentage deviation of price from Fast EMA
Setup - current Fast/Slow/Mid configuration
Trading Signals
Show Golden/Death Cross
Golden Cross - Fast EMA crosses Slow EMA from below (bullish signal) Death Cross - Fast EMA crosses Slow EMA from above (bearish signal)
Symbols:
Yellow dot "GC" below - Golden Cross
Dark red dot "DC" above - Death Cross
Show STRONG Signals
STRONG BUY and STRONG SELL - the most powerful indicator signals
Conditions for STRONG BULLISH:
EMA Alignment: Fast > Mid > Slow (all EMAs aligned)
Trend: Fast > Slow (clear uptrend)
Distance: EMAs separated by minimum 0.15%
Price Position: Price above Fast EMA
Fast Slope: Fast EMA rising
Slow Slope: Slow EMA rising
Mid Trending: Mid EMA also rising (if enabled)
Conditions for STRONG BEARISH:
Same but in reverse
Visual display:
Green label "STRONG BUY" below bar
Pink label "STRONG SELL" above bar
Difference from Golden/Death Cross:
Golden/Death Cross = crossing moment (1 bar)
STRONG signal = sustained trend (lasts several bars)
IMPORTANT: After fixes, STRONG signals now:
Work on all timeframes (M1 to MN)
Don't break on small retracements
Work with any Fast/Mid/Slow combination
Automatically adapt thanks to EMA sorting
Show Stop Loss/Take Profit
Automatic SL/TP level calculation on STRONG signal
Parameters:
Stop Loss (ATR) (0.5-5.0): ATR multiplier for stop loss
1.5 (recommended) - standard
1.0 - tight stop
2.0-3.0 - wide stop
Take Profit R:R (1.0-5.0): Risk/reward ratio
2.0 (recommended) - standard (risk 1.5 ATR, profit 3.0 ATR)
1.5 - conservative
3.0-5.0 - aggressive
Formulas:
LONG:
Stop Loss = Entry - (ATR × Stop Loss ATR)
Take Profit = Entry + (ATR × Stop Loss ATR × Take Profit R:R)
SHORT:
Stop Loss = Entry + (ATR × Stop Loss ATR)
Take Profit = Entry - (ATR × Stop Loss ATR × Take Profit R:R)
Visualization:
Red X - Stop Loss
Green X - Take Profit
Levels remain active while STRONG signal persists
Trading Signals
Signal Types
1. Golden Cross
Description: Fast EMA crosses Slow EMA from below
Signal: Beginning of bullish trend
How to trade:
ENTRY: On bar close with Golden Cross
STOP: Below local low or below Slow EMA
TARGET: Next resistance level or 2:1 R:R
Strengths:
Simple and clear
Works well on trending markets
Clear entry point
Weaknesses:
Lags (signal after movement starts)
Many false signals in ranging markets
May be late on fast moves
Optimal timeframes: H1, H4, D1
2. Death Cross
Description: Fast EMA crosses Slow EMA from above
Signal: Beginning of bearish trend
How to trade:
ENTRY: On bar close with Death Cross
STOP: Above local high or above Slow EMA
TARGET: Next support level or 2:1 R:R
Application: Mirror of Golden Cross
3. STRONG BUY
Description: All EMAs aligned + trend + all EMAs rising
Signal: Powerful bullish trend
How to trade:
ENTRY: On bar close with STRONG BUY or on pullback to Fast EMA
STOP: Below Fast EMA or automatic SL (if enabled)
TARGET: Automatic TP (if enabled) or by levels
TRAILING: Follow Fast EMA
Entry strategies:
Aggressive: Enter immediately on signal
Conservative: Wait for pullback to Fast EMA, then enter on bounce
Pyramiding: Add positions on pullbacks to Mid EMA
Position management:
Hold while STRONG signal active
Exit on STRONG SELL or Death Cross appearance
Move stop behind Fast EMA
Strengths:
Most reliable indicator signal
Doesn't break on pullbacks
Catches large moves
Works on all timeframes
Weaknesses:
Appears less frequently than other signals
Requires confirmation (multiple conditions)
Optimal timeframes: All (M5 - D1)
4. STRONG SELL
Description: All EMAs aligned down + downtrend + all EMAs falling
Signal: Powerful bearish trend
How to trade: Mirror of STRONG BUY
Visual Signals
Pulsing Ribbon Bar
Quick market assessment at a glance:
Symbol Color State
Filled square Green STRONG BULLISH
Filled square Pink STRONG BEARISH
Hollow square Blue Bullish
Hollow square Red Bearish
Rectangle Purple Neutral
Pulsation: Sinusoidal, creates living effect
Signal Bar Highlights
Bars with signals are highlighted:
Green highlight: STRONG BUY or Golden Cross
Pink highlight: STRONG SELL or Death Cross
Gradient Clouds
Colored space between EMAs shows trend strength:
Wide clouds - strong trend
Narrow clouds - weak trend or consolidation
Color change - trend change
Info Table
Quick reference in corner:
TREND: Current state (STRONG UP, Bullish, Neutral, Bearish, STRONG DOWN)
Momentum %: Movement strength
Effects: Active visual effects
Setup: Fast/Slow/Mid configuration
Usage Strategies
Strategy 1: "Golden Trailing"
Idea: Follow STRONG signals using Fast EMA as trailing stop
Settings:
Fast: Phi Golden (Phi³)
Mid: Pi Circular (2Pi)
Slow: e Natural (e²)
Base Multiplier: 10
Timeframe: H1, H4
Entry rules:
Wait for STRONG BUY
Enter on bar close or on pullback to Fast EMA
Stop below Fast EMA
Management:
Hold position while STRONG signal active
Move stop behind Fast EMA daily
Exit on STRONG SELL or Death Cross
Take Profit:
Partially close at +2R
Trail remainder until exit signal
For whom: Swing traders, trend followers
Pros:
Catches large moves
Simple rules
Emotionally comfortable
Cons:
Requires patience
Possible extended drawdowns on pullbacks
Strategy 2: "Scalping Bounces"
Idea: Scalp bounces from Fast EMA during STRONG trend
Settings:
Fast: Delta Adaptive (Base 15, Sensitivity 2.0)
Mid: Phi Golden (Phi²)
Slow: Pi Circular (2Pi)
Base Multiplier: 5
Timeframe: M5, M15
Entry rules:
STRONG signal must be active
Wait for price pullback to Fast EMA
Enter on bounce (candle closes above/below Fast EMA)
Stop behind local extreme (15-20 pips)
Take Profit:
+1.5R or to Mid EMA
Or to next level
For whom: Active day traders
Pros:
Many signals
Clear entry point
Quick profits
Cons:
Requires constant monitoring
Not all bounces work
Requires discipline for frequent trading
Strategy 3: "Triple Filter"
Idea: Enter only when all 3 EMAs and price perfectly aligned
Settings:
Fast: Phi Golden (Phi³)
Mid: e Natural (e²)
Slow: Pi Circular (3Pi)
Base Multiplier: 15
Timeframe: H4, D1
Entry rules (LONG):
STRONG BUY active
Price above all three EMAs
Fast > Mid > Slow (all aligned)
All EMAs rising (slope up)
Gradient Clouds wide and bright
Entry:
On bar close meeting all conditions
Or on next pullback to Fast EMA
Stop:
Below Mid EMA or -1.5 ATR
Take Profit:
First target: +3R
Second target: next major level
Trailing: Mid EMA
For whom: Conservative swing traders, investors
Pros:
Very reliable signals
Minimum false entries
Large profit potential
Cons:
Rare signals (2-5 per month)
Requires patience
Strategy 4: "Adaptive Scalper"
Idea: Use only Delta Adaptive EMA for quick volatility reaction
Settings:
Fast: Delta Adaptive (Base 10, Sensitivity 3.0)
Mid: None
Slow: Delta Adaptive (Base 30, Sensitivity 2.0)
Base Multiplier: 3
Timeframe: M1, M5
Feature: Two different Delta EMAs with different settings
Entry rules:
Golden Cross between two Delta EMAs
Both Delta EMAs must be rising/falling
Enter on next bar
Stop:
10-15 pips or below Slow Delta EMA
Take Profit:
+1R to +2R
Or Death Cross
For whom: Scalpers on cryptocurrencies and forex
Pros:
Instant volatility adaptation
Many signals on volatile markets
Quick results
Cons:
Much noise on calm markets
Requires fast execution
High commissions may eat profits
Strategy 5: "Cyclical Trader"
Idea: Use Pi and Lambda for trading cyclical markets
Settings:
Fast: Pi Circular (1Pi)
Mid: Lambda Wave (Base 30, Amplitude 0.5, Frequency 50)
Slow: Pi Circular (3Pi)
Base Multiplier: 10
Timeframe: H1, H4
Entry rules:
STRONG signal active
Lambda Wave EMA synchronized with trend
Enter on bounce from Lambda Wave
For whom: Traders of cyclical assets (some altcoins, commodities)
Pros:
Catches cyclical movements
Lambda Wave provides additional entry points
Cons:
More complex to configure
Not for all markets
Lambda Wave may give false signals
Strategy 6: "Multi-Timeframe Confirmation"
Idea: Use multiple timeframes for confirmation
Scheme:
Higher TF (D1): Determine trend direction (STRONG signal)
Middle TF (H4): Wait for STRONG signal in same direction
Lower TF (M15): Look for entry point (Golden Cross or bounce from Fast EMA)
Settings for all TFs:
Fast: Phi Golden (Phi³)
Mid: e Natural (e²)
Slow: Pi Circular (2Pi)
Base Multiplier: 10
Rules:
All 3 TFs must show one trend
Entry on lower TF
Stop by lower TF
Target by higher TF
For whom: Serious traders and investors
Pros:
Maximum reliability
Large profit targets
Minimum false signals
Cons:
Rare setups
Requires analysis of multiple charts
Experience needed
Practical Tips
DOs
Use STRONG signals as primary - they're most reliable
Let signals develop - don't exit on first pullback
Use trailing stop - follow Fast EMA
Combine with levels - S/R, Fibonacci, volumes
Test on demo before real
Adjust Base Multiplier for your timeframe
Enable visual effects - they help see the picture
Use Info Table - quick situation assessment
Watch Pulsing Bar - instant state indicator
Trust auto-sorting of Fast/Mid/Slow
DON'Ts
Don't trade against STRONG signal - trend is your friend
Don't ignore Mid EMA - it adds reliability
Don't use too small Base Multiplier on higher TFs
Don't enter on Golden Cross in range - check for trend
Don't change settings during open position
Don't forget risk management - 1-2% per trade
Don't trade all signals in row - choose best ones
Don't use indicator in isolation - combine with Price Action
Don't set too tight stops - let trade breathe
Don't over-optimize - simplicity = reliability
Optimal Settings by Asset
US Stocks (SPY, AAPL, TSLA)
Recommendation:
Fast: Phi Golden (Phi³)
Mid: e Natural (e²)
Slow: Pi Circular (2Pi)
Base: 10-15
Timeframe: H4, D1
Features:
Use on daily for swing
STRONG signals very reliable
Works well on trending stocks
Forex (EUR/USD, GBP/USD)
Recommendation:
Fast: Delta Adaptive (Base 15, Sens 2.0)
Mid: Phi Golden (Phi²)
Slow: Pi Circular (2Pi)
Base: 8-12
Timeframe: M15, H1, H4
Features:
Delta Adaptive works excellently on news
Many signals on M15-H1
Consider spreads
Cryptocurrencies (BTC, ETH, altcoins)
Recommendation:
Fast: Delta Adaptive (Base 10, Sens 3.0)
Mid: Pi Circular (2Pi)
Slow: e Natural (e²)
Base: 5-10
Timeframe: M5, M15, H1
Features:
High volatility - adaptation needed
STRONG signals can last days
Be careful with scalping on M1-M5
Commodities (Gold, Oil)
Recommendation:
Fast: Pi Circular (1Pi)
Mid: Phi Golden (Phi³)
Slow: Pi Circular (3Pi)
Base: 12-18
Timeframe: H4, D1
Features:
Pi works excellently on cyclical commodities
Gold responds especially well to Phi
Oil volatile - use wide stops
Indices (S&P500, Nasdaq, DAX)
Recommendation:
Fast: Phi Golden (Phi³)
Mid: e Natural (e²)
Slow: Pi Circular (2Pi)
Base: 15-20
Timeframe: H4, D1, W1
Features:
Very trending instruments
STRONG signals last weeks
Good for position trading
Alerts
The indicator supports 6 alert types:
1. Golden Cross
Message: "Hellenic Matrix: GOLDEN CROSS - Fast EMA crossed above Slow EMA - Bullish trend starting!"
When: Fast EMA crosses Slow EMA from below
2. Death Cross
Message: "Hellenic Matrix: DEATH CROSS - Fast EMA crossed below Slow EMA - Bearish trend starting!"
When: Fast EMA crosses Slow EMA from above
3. STRONG BULLISH
Message: "Hellenic Matrix: STRONG BULLISH SIGNAL - All EMAs aligned for powerful uptrend!"
When: All conditions for STRONG BUY met (first bar)
4. STRONG BEARISH
Message: "Hellenic Matrix: STRONG BEARISH SIGNAL - All EMAs aligned for powerful downtrend!"
When: All conditions for STRONG SELL met (first bar)
5. Bullish Ribbon
Message: "Hellenic Matrix: BULLISH RIBBON - EMAs aligned for uptrend"
When: EMAs aligned bullish + price above Fast EMA (less strict condition)
6. Bearish Ribbon
Message: "Hellenic Matrix: BEARISH RIBBON - EMAs aligned for downtrend"
When: EMAs aligned bearish + price below Fast EMA (less strict condition)
How to Set Up Alerts:
Open indicator on chart
Click on three dots next to indicator name
Select "Create Alert"
In "Condition" field select needed alert:
Golden Cross
Death Cross
STRONG BULLISH
STRONG BEARISH
Bullish Ribbon
Bearish Ribbon
Configure notification method:
Pop-up in browser
Email
SMS (in Premium accounts)
Push notifications in mobile app
Webhook (for automation)
Select frequency:
Once Per Bar Close (recommended) - once on bar close
Once Per Bar - during bar formation
Only Once - only first time
Click "Create"
Tip: Create separate alerts for different timeframes and instruments
FAQ
1. Why don't STRONG signals appear?
Possible reasons:
Incorrect Fast/Mid/Slow order
Solution: Indicator automatically sorts EMAs by periods, but ensure selected EMAs have different periods
Base Multiplier too large
Solution: Reduce Base to 5-10 on lower timeframes
Market in range
Solution: STRONG signals appear only in trends - this is normal
Too strict EMA settings
Solution: Try classic combination: Phi³ / Pi×2 / e² with Base=10
Mid EMA too close to Fast or Slow
Solution: Select Mid EMA with period between Fast and Slow
2. How often should STRONG signals appear?
Normal frequency:
M1-M5: 5-15 signals per day (very active markets)
M15-H1: 2-8 signals per day
H4: 3-10 signals per week
D1: 2-5 signals per month
W1: 2-6 signals per year
If too many signals - market very volatile or Base too small
If too few signals - market in range or Base too large
4. What are the best settings for beginners?
Universal "out of the box" settings:
Matrix Core:
Base Multiplier: 10
Source: close
Phi Golden: Enabled, Power = 3
Pi Circular: Enabled, Multiple = 2
e Natural: Enabled, Power = 2
Delta Adaptive: Enabled, Base = 20, Sensitivity = 2.0
Manual Selection:
Fast: Phi Golden
Mid: e Natural
Slow: Pi Circular
Visualization:
Gradient Clouds: ON
Neon Glow: ON (Medium)
Pulsing Bar: ON (Medium)
Signal Highlights: ON (Light Fill)
Table: ON (Top Right, Small)
Signals:
Golden/Death Cross: ON
STRONG Signals: ON
Stop Loss: OFF (while learning)
Timeframe for learning: H1 or H4
5. Can I use only one EMA?
No, minimum 2 EMAs (Fast and Slow) for signal generation.
Mid EMA is optional:
With Mid EMA = more reliable but rarer signals
Without Mid EMA = more signals but less strict filtering
Recommendation: Start with 3 EMAs (Fast/Mid/Slow), then experiment
6. Does the indicator work on cryptocurrencies?
Yes, works excellently! Especially good on:
Bitcoin (BTC)
Ethereum (ETH)
Major altcoins (SOL, BNB, XRP)
Recommended settings for crypto:
Fast: Delta Adaptive (Base 10-15, Sensitivity 2.5-3.0)
Mid: Pi Circular (2Pi)
Slow: e Natural (e²)
Base: 5-10
Timeframe: M15, H1, H4
Crypto market features:
High volatility → use Delta Adaptive
24/7 trading → set alerts
Sharp movements → wide stops
7. Can I trade only with this indicator?
Technically yes, but NOT recommended.
Best approach - combine with:
Price Action - support/resistance levels, candle patterns
Volume - movement strength confirmation
Fibonacci - retracement and extension levels
RSI/MACD - divergences and overbought/oversold
Fundamental analysis - news, company reports
Hellenic Matrix:
Excellently determines trend and its strength
Provides clear entry/exit points
Doesn't consider fundamentals
Doesn't see major levels
8. Why do Gradient Clouds change color?
Color depends on EMA order:
Phi-Pi Cloud:
Blue - Pi EMA above Phi EMA (bullish alignment)
Gold - Phi EMA above Pi EMA (bearish alignment)
Pi-e Cloud:
Green - e EMA above Pi EMA (bullish alignment)
Blue - Pi EMA above e EMA (bearish alignment)
Color change = EMA order change = possible trend change
9. What is Momentum % in the table?
Momentum % = percentage deviation of price from Fast EMA
Formula:
Momentum = ((Close - Fast EMA) / Fast EMA) × 100
Interpretation:
+0.5% to +2% - normal bullish momentum
+2% to +5% - strong bullish momentum
+5% and above - overheating (correction possible)
-0.5% to -2% - normal bearish momentum
-2% to -5% - strong bearish momentum
-5% and below - oversold (bounce possible)
Usage:
Monitor momentum during STRONG signals
Large momentum = don't enter (wait for pullback)
Small momentum = good entry point
10. How to configure for scalping?
Settings for scalping (M1-M5):
Base Multiplier: 3-5
Source: close or hlc3 (smoother)
Fast: Delta Adaptive (Base 8-12, Sensitivity 3.0)
Mid: None (for more signals)
Slow: Phi Golden (Phi²) or Pi Circular (1Pi)
Visualization:
- Gradient Clouds: ON (helps see strength)
- Neon Glow: OFF (doesn't clutter chart)
- Pulsing Bar: ON (quick assessment)
- Signal Highlights: ON
Signals:
- Golden/Death Cross: ON
- STRONG Signals: ON
- Stop Loss: ON (1.0-1.5 ATR, R:R 1.5-2.0)
Scalping rules:
Trade only STRONG signals
Enter on bounce from Fast EMA
Tight stops (10-20 pips)
Quick take profit (+1R to +2R)
Don't hold through news
11. How to configure for long-term investing?
Settings for investing (D1-W1):
Base Multiplier: 20-30
Source: close
Fast: Phi Golden (Phi³ or Phi⁴)
Mid: e Natural (e²)
Slow: Pi Circular (3Pi or 4Pi)
Visualization:
- Gradient Clouds: ON
- Neon Glow: ON (Medium)
- Everything else - to taste
Signals:
- Golden/Death Cross: ON
- STRONG Signals: ON
- Stop Loss: OFF (use percentage stop)
Investing rules:
Enter only on STRONG signals
Hold while STRONG active (weeks/months)
Stop below Slow EMA or -10%
Take profit: by company targets or +50-100%
Ignore short-term pullbacks
12. What if indicator slows down chart?
Indicator is optimized, but if it slows:
Disable unnecessary visual effects:
Neon Glow: OFF (saves 8 plots)
Gradient Clouds: ON but low quality
Lambda Wave EMA: OFF (if not using)
Reduce number of active EMAs:
Sigma Composite: OFF
Lambda Wave: OFF
Leave only Phi, Pi, e, Delta
Simplify settings:
Pulsing Bar: OFF
Greek Labels: OFF
Info Table: smaller size
13. Can I use on different timeframes simultaneously?
Yes! Multi-timeframe analysis is very powerful:
Classic scheme:
Higher TF (D1, W1) - determine global trend
Wait for STRONG signal
This is our trading direction
Middle TF (H4, H1) - look for confirmation
STRONG signal in same direction
Precise entry zone
Lower TF (M15, M5) - entry point
Golden Cross or bounce from Fast EMA
Precise stop loss
Example:
W1: STRONG BUY active (global uptrend)
H4: STRONG BUY appeared (confirmation)
M15: Wait for Golden Cross or bounce from Fast EMA → ENTRY
Advantages:
Maximum reliability
Clear timeframe hierarchy
Large targets
14. How does indicator work on news?
Delta Adaptive EMA adapts excellently to news:
Before news:
Low volatility → Delta EMA becomes fast → pulls to price
During news:
Sharp volatility spike → Delta EMA slows → filters noise
After news:
Volatility normalizes → Delta EMA returns to normal
Recommendations:
Don't trade at news release moment (spreads widen)
Wait for STRONG signal after news (2-5 bars)
Use Delta Adaptive as Fast EMA for quick reaction
Widen stops by 50-100% during important news
Advanced Techniques
Technique 1: "Divergences with EMA"
Idea: Look for discrepancies between price and Fast EMA
Bullish divergence:
Price makes lower low
Fast EMA makes higher low
= Possible reversal up
Bearish divergence:
Price makes higher high
Fast EMA makes lower high
= Possible reversal down
How to trade:
Find divergence
Wait for STRONG signal in divergence direction
Enter on confirmation
Technique 2: "EMA Tunnel"
Idea: Use space between Fast and Slow EMA as "tunnel"
Rules:
Wide tunnel - strong trend, hold position
Narrow tunnel - weak trend or consolidation, caution
Tunnel narrowing - trend weakening, prepare to exit
Tunnel widening - trend strengthening, can add
Visually: Gradient Clouds show this automatically!
Trading:
Enter on STRONG signal (tunnel starts widening)
Hold while tunnel wide
Exit when tunnel starts narrowing
Technique 3: "Wave Analysis with Lambda"
Idea: Lambda Wave EMA creates sinusoid matching market cycles
Setup:
Lambda Base Period: 30
Lambda Wave Amplitude: 0.5
Lambda Wave Frequency: 50 (adjusted to asset cycle)
How to find correct Frequency:
Look at historical cycles (distance between local highs)
Average distance = your Frequency
Example: if highs every 40-60 bars, set Frequency = 50
Trading:
Enter when Lambda Wave at bottom of sinusoid (growth potential)
Exit when Lambda Wave at top (fall potential)
Combine with STRONG signals
Technique 4: "Cluster Analysis"
Idea: When all EMAs gather in narrow cluster = powerful breakout soon
Cluster signs:
All EMAs (Phi, Pi, e, Delta) within 0.5-1% of each other
Gradient Clouds almost invisible
Price jumping around all EMAs
Trading:
Identify cluster (all EMAs close)
Determine breakout direction (where more volume, higher TFs direction)
Wait for breakout and STRONG signal
Enter on confirmation
Target = cluster size × 3-5
This is very powerful technique for big moves!
Technique 5: "Sigma as Dynamic Level"
Idea: Sigma Composite EMA = average of all EMAs = magnetic level
Usage:
Enable Sigma Composite (Weighted Average)
Sigma works as dynamic support/resistance
Price often returns to Sigma before trend continuation
Trading:
In trend: Enter on bounces from Sigma
In range: Fade moves from Sigma (trade return to Sigma)
On breakout: Sigma becomes support/resistance
Risk Management
Basic Rules
1. Position Size
Conservative: 1% of capital per trade
Moderate: 2% of capital per trade (recommended)
Aggressive: 3-5% (only for experienced)
Calculation formula:
Lot Size = (Capital × Risk%) / (Stop in pips × Pip value)
2. Risk/Reward Ratio
Minimum: 1:1.5
Standard: 1:2 (recommended)
Optimal: 1:3
Aggressive: 1:5+
3. Maximum Drawdown
Daily: -3% to -5%
Weekly: -7% to -10%
Monthly: -15% to -20%
Upon reaching limit → STOP trading until end of period
Position Management Strategies
1. Fixed Stop
Method:
Stop below/above Fast EMA or local extreme
DON'T move stop against position
Can move to breakeven
For whom: Beginners, conservative traders
2. Trailing by Fast EMA
Method:
Each day (or bar) move stop to Fast EMA level
Position closes when price breaks Fast EMA
Advantages:
Stay in trend as long as possible
Automatically exit on reversal
For whom: Trend followers, swing traders
3. Partial Exit
Method:
50% of position close at +2R
50% hold with trailing by Mid EMA or Slow EMA
Advantages:
Lock profit
Leave position for big move
Psychologically comfortable
For whom: Universal method (recommended)
4. Pyramiding
Method:
First entry on STRONG signal (50% of planned position)
Add 25% on pullback to Fast EMA
Add another 25% on pullback to Mid EMA
Overall stop below Slow EMA
Advantages:
Average entry price
Reduce risk
Increase profit in strong trends
Caution:
Works only in trends
In range leads to losses
For whom: Experienced traders
Trading Psychology
Correct Mindset
1. Indicator is a tool, not holy grail
Indicator shows probability, not guarantee
There will be losing trades - this is normal
Important is series statistics, not one trade
2. Trust the system
If STRONG signal appeared - enter
Don't search for "perfect" moment
Follow trading plan
3. Patience
STRONG signals don't appear every day
Better miss signal than enter against trend
Quality over quantity
4. Discipline
Always set stop loss
Don't move stop against position
Don't increase risk after losses
Beginner Mistakes
1. "I know better than indicator"
Indicator says STRONG BUY, but you think "too high, will wait for pullback"
Result: miss profitable move
Solution: Trust signals or don't use indicator
2. "Will reverse now for sure"
Trading against STRONG trend
Result: stops, stops, stops
Solution: Trend is your friend, trade with trend
3. "Will hold a bit more"
Don't exit when STRONG signal disappears
Greed eats profit
Solution: If signal gone - exit!
4. "I'll recover"
After losses double risk
Result: huge losses
Solution: Fixed % risk ALWAYS
5. "I don't like this signal"
Skip signals because of "feeling"
Result: inconsistency, no statistics
Solution: Trade ALL signals or clearly define filters
Trading Journal
What to Record
For each trade:
1. Entry/exit date and time
2. Instrument and timeframe
3. Signal type
Golden Cross
STRONG BUY
STRONG SELL
Death Cross
4. Indicator settings
Fast/Mid/Slow EMA
Base Multiplier
Other parameters
5. Chart screenshot
Entry moment
Exit moment
6. Trade parameters
Position size
Stop loss
Take Profit
R:R
7. Result
Profit/Loss in $
Profit/Loss in %
Profit/Loss in R
8. Notes
What was right
What was wrong
Emotions during trade
Lessons
Journal Analysis
Analyze weekly:
1. Win Rate
Win Rate = (Profitable trades / All trades) × 100%
Good: 50-60%
Excellent: 60-70%
Exceptional: 70%+
2. Average R
Average R = Sum of all R / Number of trades
Good: +0.5R
Excellent: +1.0R
Exceptional: +1.5R+
3. Profit Factor
Profit Factor = Total profit / Total losses
Good: 1.5+
Excellent: 2.0+
Exceptional: 3.0+
4. Maximum Drawdown
Track consecutive losses
If more than 5 in row - stop, check system
5. Best/Worst Trades
What was common in best trades? (do more)
What was common in worst trades? (avoid)
Pre-Trade Checklist
Technical Analysis
STRONG signal active (BUY or SELL)
All EMAs properly aligned (Fast > Mid > Slow or reverse)
Price on correct side of Fast EMA
Gradient Clouds confirm trend
Pulsing Bar shows STRONG state
Momentum % in normal range (not overheated)
No close strong levels against direction
Higher timeframe doesn't contradict
Risk Management
Position size calculated (1-2% risk)
Stop loss set
Take profit calculated (minimum 1:2)
R:R satisfactory
Daily/weekly risk limit not exceeded
No other open correlated positions
Fundamental Analysis
No important news in coming hours
Market session appropriate (liquidity)
No contradicting fundamentals
Understand why asset is moving
Psychology
Calm and thinking clearly
No emotions from previous trades
Ready to accept loss at stop
Following trading plan
Not revenging market for past losses
If at least one point is NO - think twice before entering!
Learning Roadmap
Week 1: Familiarization
Goals:
Install and configure indicator
Study all EMA types
Understand visualization
Tasks:
Add indicator to chart
Test all Fast/Mid/Slow settings
Play with Base Multiplier on different timeframes
Observe Gradient Clouds and Pulsing Bar
Study Info Table
Result: Comfort with indicator interface
Week 2: Signals
Goals:
Learn to recognize all signal types
Understand difference between Golden Cross and STRONG
Tasks:
Find 10 Golden Cross examples in history
Find 10 STRONG BUY examples in history
Compare their results (which worked better)
Set up alerts
Get 5 real alerts
Result: Understanding signals
Week 3: Demo Trading
Goals:
Start trading signals on demo account
Gather statistics
Tasks:
Open demo account
Trade ONLY STRONG signals
Keep journal (minimum 20 trades)
Don't change indicator settings
Strictly follow stop losses
Result: 20+ documented trades
Week 4: Analysis
Goals:
Analyze demo trading results
Optimize approach
Tasks:
Calculate win rate and average R
Find patterns in profitable trades
Find patterns in losing trades
Adjust approach (not indicator!)
Write trading plan
Result: Trading plan on 1 page
Month 2: Improvement
Goals:
Deepen understanding
Add additional techniques
Tasks:
Study multi-timeframe analysis
Test combinations with Price Action
Try advanced techniques (divergences, tunnels)
Continue demo trading (minimum 50 trades)
Achieve stable profitability on demo
Result: Win rate 55%+ and Profit Factor 1.5+
Month 3: Real Trading
Goals:
Transition to real account
Maintain discipline
Tasks:
Open small real account
Trade minimum lots
Strictly follow trading plan
DON'T increase risk
Focus on process, not profit
Result: Psychological comfort on real
Month 4+: Scaling
Goals:
Increase account
Become consistently profitable
Tasks:
With 60%+ win rate can increase risk to 2%
Upon doubling account can add capital
Continue keeping journal
Periodically review and improve strategy
Share experience with community
Result: Stable profitability month after month
Additional Resources
Recommended Reading
Technical Analysis:
"Technical Analysis of Financial Markets" - John Murphy
"Trading in the Zone" - Mark Douglas (psychology)
"Market Wizards" - Jack Schwager (trader interviews)
EMA and Moving Averages:
"Moving Averages 101" - Steve Burns
Articles on Investopedia about EMA
Risk Management:
"The Mathematics of Money Management" - Ralph Vince
"Trade Your Way to Financial Freedom" - Van K. Tharp
Trading Journals:
Edgewonk (paid, very powerful)
Tradervue (free version + premium)
Excel/Google Sheets (free)
Screeners:
TradingView Stock Screener
Finviz (stocks)
CoinMarketCap (crypto)
Conclusion
Hellenic EMA Matrix is a powerful tool based on universal mathematical constants of nature. The indicator combines:
Mathematical elegance - Phi, Pi, e instead of arbitrary numbers
Premium visualization - Neon Glow, Gradient Clouds, Pulsing Bar
Reliable signals - STRONG BUY/SELL work on all timeframes
Flexibility - 6 EMA types, adaptation to any trading style
Automation - auto-sorting EMAs, SL/TP calculation, alerts
Key Success Principles:
Simplicity - start with basic settings (Phi/Pi/e, Base=10)
Discipline - follow STRONG signals strictly
Patience - wait for quality setups
Risk Management - 1-2% per trade, ALWAYS
Journal - document every trade
Learning - constantly improve skills
Remember:
Indicator shows probability, not guarantee
Important is series statistics, not one trade
Psychology more important than technique
Quality more important than quantity
Process more important than result
Acknowledgments
Thank you for using Hellenic EMA Matrix - Alpha Omega Premium!
The indicator was created with love for mathematics, markets, and beautiful visualization.
Wishing you profitable trading!
Guide Version: 1.0
Date: 2025
Compatibility: Pine Script v6, TradingView
"In the simplicity of mathematical constants lies the complexity of market movements"

Boilerplate Configurable Strategy [Yosiet]This is a Boilerplate Code!
Hello! First of all, let me introduce myself a little bit. I don't come from the world of finance, but from the world of information and communication technologies (ICT) where we specialize in data processing with the aim of automating it and eliminating all human factors and actors in the processes. You could say that I am an algotrader.
That said, in my journey through trading in recent years I have understood that this world is often shown to be incomplete. All those who want to learn about trading only end up learning a small part of what it really entails, they only seek to learn how to read candlesticks. Therefore, I want to share with the entire community a fraction of what I have really understood it to be.
As a computer scientist, the most important thing is the data, it is the raw material of our work and without data you simply cannot do anything. Entropy is simple: Data in -> Data is transformed -> Data out.
The quality of the outgoing data will directly depend on the incoming data, there is no greater mystery or magic in the process. In trading it is no different, because at the end of the day it is nothing more than data. As we often say, if garbage comes in, garbage comes out.
Most people focus on the results only, on the outgoing data, because in the end we all want the same thing, to make easy money. Very few pay attention to the input data, much less to the process.
Now, I am not here to delude you, because there is no bigger lie than easy money, but I am here to give you a boilerplate code that will help you create strategies where you only have to concentrate on the quality of the incoming data.
To the Point
The code is a strategy boilerplate that applies the technique that you decide to customize for the criteria for opening a position. It already has the other factors involved in trading programmed and automated.
1. The Entry
This section of the boilerplate is the one that each individual must customize according to their needs and knowledge. The code is offered with two simple, well-known strategies to exemplify how the code can be reused for your own benefits.
For the purposes of this post on tradingview, I am going to use the simplest of the known strategies in trading for entries: SMA Crossing
// SMA Cross Settings
maFast = ta.sma(close, length)
maSlow = ta.sma(open, length)
The Strategy Properties for all cases published here:
For Stock TSLA H1 From 01/01/2025 To 02/15/2025
For Crypto XMR-USDT 30m From 01/01/2025 To 02/15/2025
For Forex EUR-USD 5m From 01/01/2025 To 02/15/2025
But the goal of this post is not to sell you a dream, else to show you that the same Entry decision works very well for some and does not for others and with this boilerplate code you only have to think of entries, not exits.
2. Schedules, Days, Sessions
As you know, there are an infinite number of markets that are susceptible to the sessions of each country and the news that they announce during those sessions, so the code already offers parameters so that you can condition the days and hours of operation, filter the best time parameters for a specific market and time frame.
3. Data Filtering
The data offered in trading are numerical series presented in vectors on a time axis where an endless number of mathematical equations can be applied to process them, with matrix calculation and non-linear regressions being the best, in my humble opinion.
4. Read Fundamental Macroeconomic Events, News
The boilerplate has integration with the tradingview SDK to detect when news will occur and offers parameters so that you can enable an exclusion time margin to not operate anything during that time window.
5. Direction and Sense
In my experience I have found the peculiarity that the same algorithm works very well for a market in a time frame, but for the same market in another time frame it is only a waste of time and money. So now you can easily decide if you only want to open LONG, SHORT or both side positions and know how effective your strategy really is.
6. Reading the money, THE PURPOSE OF EVERYTHING
The most important section in trading and the reason why many clients usually hire me as a financial programmer, is reading and controlling the money, because in the end everyone wants to win and no one wants to lose. Now they can easily parameterize how the money should flow and this is the genius of this boilerplate, because it is what will really decide if an algorithm (Indicator: A bunch of math equations) for entries will really leave you good money over time.
7. Managing the Risk, The Ego Destroyer
Many trades, little money. Most traders focus on making money and none of them know about statistics and the few who do know something about it, only focus on the winrate. Well, with this code you can unlock what really matters, the true success criteria to be able to live off of trading: Profit Factor, Sortino Ratio, Sharpe Ratio and most importantly, will you really make money?
8. Managing Emotions
Finally, the main reason why many lose money is because they are very bad at managing their emotions, because with this they will no longer need to do so because the boilerplate has already programmed criteria to chase the price in a position, cut losses and maximize profits.
In short, this is a boilerplate code that already has the data processing and data output ready, you only have to worry about the data input.
“And so the trader learned: the greatest edge was not in predicting the storm, but in building a boat that could not sink.”
DISCLAIMER
This post is intended for programmers and quantitative traders who already have a certain level of knowledge and experience. It is not intended to be financial advice or to sell you any money-making script, if you use it, you do so at your own risk.
