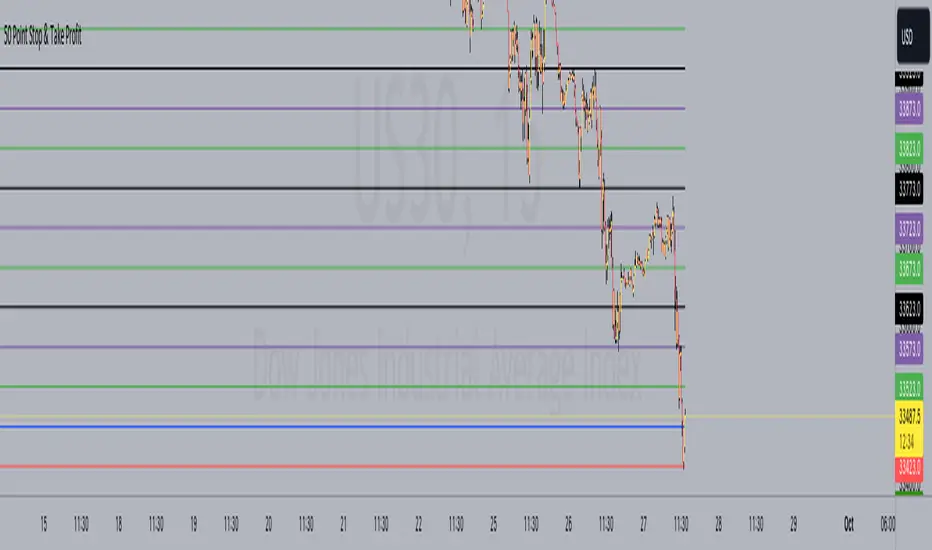
50 Point Stop & Take Profit**50 Point Stop & Take Profit**
This custom TradingView indicator is designed for instruments like US30 or any asset following a point system. It assists traders in setting precise stop-loss and take-profit levels based on different risk-reward ratios. It calculates and plots horizontal lines at various price levels above and below your specified entry price, with a 50-point difference between each ratio.
**How It Benefits Your Strategy:**
- Each risk-reward ratio, whether it's 1:1, 2:1, 3:1, and so on, is separated by precisely 50 points. This deliberate spacing is tailored to provide you with clear and consistent reference points for managing trades in instruments using a point-based system.
- The 50-point increments make it easy to adjust your positions, ensuring that your risk and reward levels align with your trading strategy and objectives.
**Usage:**
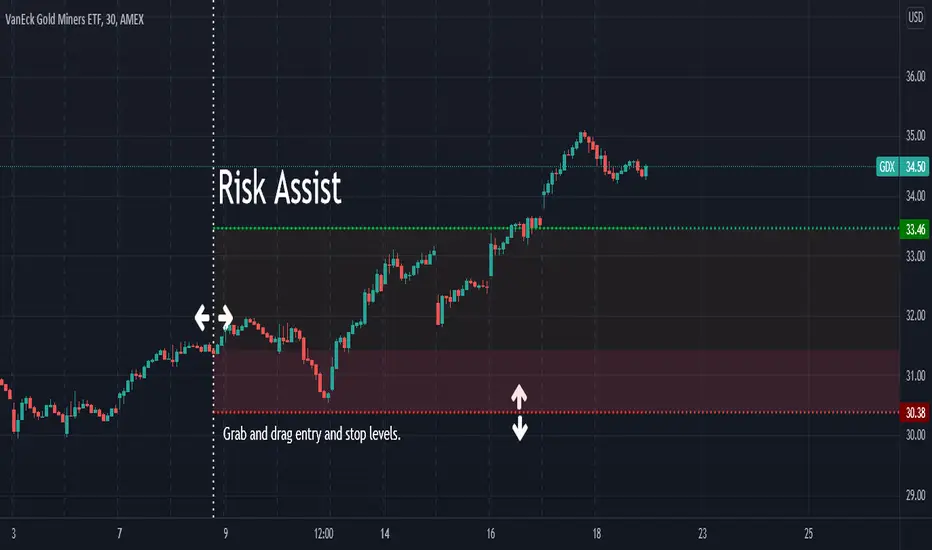
1. Set your desired entry price using the "Entry Price" input.
2. The indicator is ideally suited for instruments like US30, where each point represents a distinct price movement. It will automatically calculate and plot multiple lines at the following levels, both for Long (L) and Short (S) positions:
- 1:1 Risk-Reward Ratio (±50 points)
- 2:1 Risk-Reward Ratio (±100 points)
- 3:1 Risk-Reward Ratio (±150 points)
- 4:1 Risk-Reward Ratio (±200 points)
- 5:1 Risk-Reward Ratio (±250 points)
- 6:1 Risk-Reward Ratio (±300 points)
- 7:1 Risk-Reward Ratio (±350 points)
- 8:1 Risk-Reward Ratio (±400 points)
- 9:1 Risk-Reward Ratio (±450 points)
- 10:1 Risk-Reward Ratio (±500 points)
**Customization Options:**
- **Alerts:** You can set alerts for each level to receive notifications when the price reaches a specific risk-reward ratio.
- **Color Customization:** Customize the colors of the plotted lines to suit your chart preferences.
- **Toggle Ratios:** Easily toggle on/off different risk-reward ratios to focus on specific levels that align with your trading strategy.
**How to Use:**
- Use the plotted lines as reference points for setting stop-loss and take-profit orders at your preferred risk-reward ratios.
- The blue horizontal line represents your specified entry price.
This indicator simplifies your trading strategy by providing clear visual cues for managing risk and reward levels, with each level thoughtfully spaced 50 points apart to cater to your strategy's precision.
*Note: Always use risk management and proper trade sizing in your trading strategy.*
**Version:** Pine Script version 5
Penunjuk Pine Script®