HOD/LOD/PMH/PML/PDH/PDL Strategy by @tradingbauhaus This script is a trading strategy @tradingbauhaus designed to trade based on key price levels, such as the High of Day (HOD), Low of Day (LOD), Premarket High (PMH), Premarket Low (PML), Previous Day High (PDH), and Previous Day Low (PDL). Below, I’ll explain in detail what the script does:
Core Functionality of the Script:
Calculates Key Price Levels:
HOD (High of Day): The highest price of the current day.
LOD (Low of Day): The lowest price of the current day.
PMH (Premarket High): The highest price during the premarket session (before the market opens).
PML (Premarket Low): The lowest price during the premarket session.
PDH (Previous Day High): The highest price of the previous day.
PDL (Previous Day Low): The lowest price of the previous day.
Draws Horizontal Lines on the Chart:
Plots horizontal lines on the chart for each key level (HOD, LOD, PMH, PML, PDH, PDL) with specific colors for easy visual identification.
Defines Entry and Exit Rules:
Long Entry (Buy): If the price crosses above the PMH (Premarket High) or the PDH (Previous Day High).
Short Entry (Sell): If the price crosses below the PML (Premarket Low) or the PDL (Previous Day Low).
Long Exit: If the price reaches the HOD (High of Day) during a long position.
Short Exit: If the price reaches the LOD (Low of Day) during a short position.
How the Script Works Step by Step:
Calculates Key Levels:
Uses the request.security function to fetch the HOD and LOD of the current day, as well as the highs and lows of the previous day (PDH and PDL).
Calculates the PMH and PML during the premarket session (before 9:30 AM).
Plots Levels on the Chart:
Uses the plot function to draw horizontal lines on the chart representing the key levels (HOD, LOD, PMH, PML, PDH, PDL).
Each level has a specific color for easy identification:
HOD: White.
LOD: Purple.
PDH: Orange.
PDL: Blue.
PMH: Green.
PML: Red.
Defines Trading Rules:
Uses conditions with ta.crossover and ta.crossunder to detect when the price crosses key levels.
Long Entry: If the price crosses above the PMH or PDH, a long position (buy) is opened.
Short Entry: If the price crosses below the PML or PDL, a short position (sell) is opened.
Long Exit: If the price reaches the HOD during a long position, the position is closed.
Short Exit: If the price reaches the LOD during a short position, the position is closed.
Executes Orders Automatically:
Uses the strategy.entry and strategy.close functions to open and close positions automatically based on the defined rules.
Advantages of This Strategy:
Based on Key Levels: Uses important price levels that often act as support and resistance.
Easy to Visualize: Horizontal lines on the chart make it easy to identify levels.
Automated: Entries and exits are executed automatically based on the defined rules.
Limitations of This Strategy:
Dependent on Volatility: Works best in markets with significant price movements.
False Crosses: There may be false crosses that generate incorrect signals.
No Advanced Risk Management: Does not include dynamic stop-loss or take-profit mechanisms.
How to Improve the Strategy:
Add Stop-Loss and Take-Profit: To limit losses and lock in profits.
Filter Signals with Indicators: Use RSI, MACD, or other indicators to confirm signals.
Optimize Levels: Adjust key levels based on the asset’s behavior.
In summary, this script is a trading strategy that operates based on key price levels, such as HOD, LOD, PMH, PML, PDH, and PDL. It is useful for traders who want to trade based on significant support and resistance levels.
Cari dalam skrip untuk "profit"

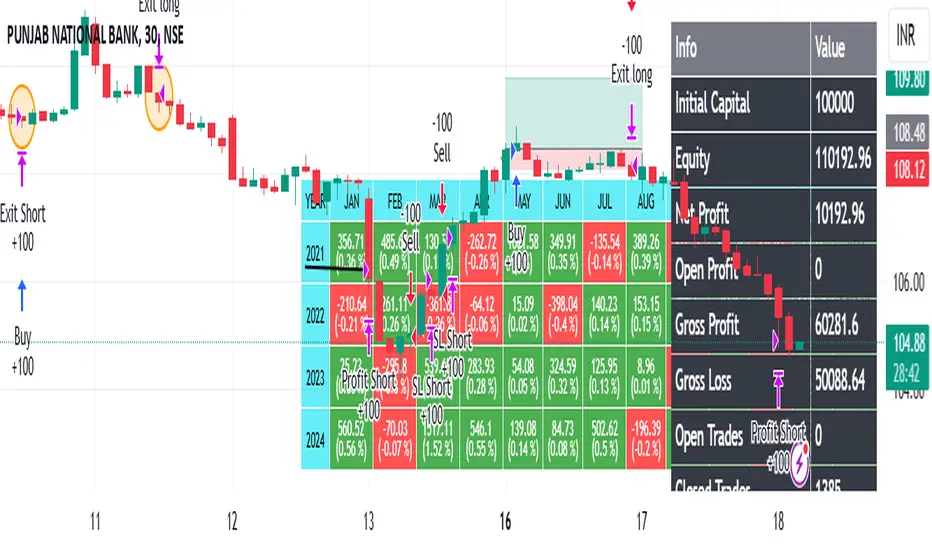
ROBO STB GainCraft strategyPure Price Action Candlestick Strategy by ROBO STB
Overview
This strategy is built entirely on the principles of price action and candlestick analysis, designed for traders who prefer raw market data over traditional indicators. By focusing solely on candlestick patterns and their context within recent price movements, the strategy identifies high-probability entry and exit points in liquid markets.
Entry signals are generated based on these patterns appearing at significant market locations, such as after consolidations, pullbacks, or at key support/resistance levels.
Price Action Integration:
Instead of relying on oscillators or moving averages, the script leverages the inherent market structure provided by candlesticks to interpret potential trend reversals or continuations.
This approach provides a clearer view of market sentiment.
No External Indicators:
This script avoids the use of traditional indicators like RSI, MACD, or Bollinger Bands, offering a clean, uncluttered chart.
Risk Management (Optional):
Fixed-percentage risk management options can also be enabled, ensuring trades remain within acceptable risk parameters.
How the Strategy Works
Entry Conditions:
Buy Entry: A bullish candlestick pattern (e.g., bullish engulfing) forms after a period of consolidation or pullback, indicating potential upward momentum.
Sell Entry: A bearish candlestick pattern (e.g., bearish engulfing) suggests a downturn is likely.
Exit Conditions:
Exits are triggered by the appearance of reversal candlestick patterns or through predefined SL/TP levels.
The strategy adapts to varying market conditions by analyzing candlestick structures dynamically.
Ideal Use Cases
Short-Term Trading: Designed for day traders and scalpers targeting quick moves on shorter timeframes.
Highly Liquid Markets: Performs best in markets with high liquidity, such as Nifty, Bank Nifty, or major forex pairs, where candlestick patterns provide reliable signals.
30-Minute Timeframe: For optimal results, the strategy is recommended for use on a 30-minute timeframe.
Transparency and Realism
Backtesting Parameters:
The default backtesting settings simulate realistic trading conditions, including commissions and slippage, ensuring that results are not misleading.
Trade sizes are calibrated to risk sustainable amounts (.05% maximum equity per trade).
Dataset Selection:
This strategy has been tested on diverse datasets to produce a statistically significant number of trades, ensuring robust performance evaluation.
Why This Strategy is Unique
This script stands apart by offering a refined approach to price action trading. Unlike generic indicator mashups, it provides traders with an actionable, candlestick-focused methodology tailored for volatile, high-liquidity markets.
The strategy is both simple to understand and powerful in execution, making it an excellent tool for traders who want to develop their skills in raw price action analysis while maintaining strict risk management.
Key Features
Candlestick-Based Entry and Exit Signals:
1. Risk Management:
- Risk-to-Reward Ratio (RTR):
Set a customizable risk-to-reward ratio to calculate target prices based on stop-loss levels.
Default: 3:1
order size added -100
2. Opening Range Identification
- Opening Range High and Low:
The script detects the high and low of the first trading session using Pine Script's session functions.
These levels are plotted as visual guides on the chart:
- High: Lime-colored circles.
- Low: Red-colored circles.
3. Trade Entry Logic
- Long Entry:
A long trade is triggered when the price closes above the opening range high.
- Entry condition: Crossover of the price above the opening range high.
-Short Entry:
A short trade is triggered when the price closes below the opening range low.
- Entry condition: Crossunder of the price below the opening range low.
Both entries are conditional on the absence of an existing position.
4. Stop Loss and Take Profit
- Long Position:
- Stop Loss: Previous candle's low.
- Take Profit: Calculated based on the RTR.
- **Short Position:**
- **Stop Loss:** Previous candle's high.
- **Take Profit:** Calculated based on the RTR.
The strategy plots these levels for visual reference:
- Stop Loss: Red dashed lines.
- Take Profit: Green dashed lines.
5. Visual Enhancements
-Trade Level Highlighting:
The script dynamically shades the areas between the entry price and SL/TP levels:
- Red shading for the stop-loss region.
- Green shading for the take-profit region.
How to Use:
1.Input Configuration:
Adjust the Risk-to-Reward ratio, max trades per day, and session end time to suit your trading preferences.
2.Visual Cues:
Use the opening range high/low lines and shading to identify potential breakout opportunities.
3.Execution:
The strategy will automatically enter and exit trades based on the conditions. Review the plotted SL and TP levels to monitor the risk-reward setup.
Important Notes:
- This strategy is designed for intraday trading and works best in markets with high volatility during the opening session.
- Backtest the strategy on your preferred market and timeframe to ensure compatibility.
- Proper risk management and position sizing are essential when using this strategy in live markets.
Please let me know if you have any doubts.
IU Opening range Breakout StrategyIU Opening Range Breakout Strategy
This Pine Script strategy is designed to capitalize on the breakout of the opening range, which is a popular trading approach. The strategy identifies the high and low prices of the opening session and takes trades based on price crossing these levels, with built-in risk management and trade limits for intraday trading.
Key Features:
1. Risk Management:
- Risk-to-Reward Ratio (RTR):
Set a customizable risk-to-reward ratio to calculate target prices based on stop-loss levels.
Default: 2:1
- Max Trades in a Day:
Specify the maximum number of trades allowed per day to avoid overtrading.
Default: 2 trades in a day.
- End-of-Day Close:
Automatically closes all open positions at a user-defined session end time to ensure no overnight exposure.
Default: 3:15 PM
2. Opening Range Identification
- Opening Range High and Low:
The script detects the high and low of the first trading session using Pine Script's session functions.
These levels are plotted as visual guides on the chart:
- High: Lime-colored circles.
- Low: Red-colored circles.
3. Trade Entry Logic
- Long Entry:
A long trade is triggered when the price closes above the opening range high.
- Entry condition: Crossover of the price above the opening range high.
-Short Entry:
A short trade is triggered when the price closes below the opening range low.
- Entry condition: Crossunder of the price below the opening range low.
Both entries are conditional on the absence of an existing position.
4. Stop Loss and Take Profit
- Long Position:
- Stop Loss: Previous candle's low.
- Take Profit: Calculated based on the RTR.
- **Short Position:**
- **Stop Loss:** Previous candle's high.
- **Take Profit:** Calculated based on the RTR.
The strategy plots these levels for visual reference:
- Stop Loss: Red dashed lines.
- Take Profit: Green dashed lines.
5. Visual Enhancements
-Trade Level Highlighting:
The script dynamically shades the areas between the entry price and SL/TP levels:
- Red shading for the stop-loss region.
- Green shading for the take-profit region.
- Entry Price Line:
A silver-colored line marks the average entry price for active trades.
How to Use:
1.Input Configuration:
Adjust the Risk-to-Reward ratio, max trades per day, and session end time to suit your trading preferences.
2.Visual Cues:
Use the opening range high/low lines and shading to identify potential breakout opportunities.
3.Execution:
The strategy will automatically enter and exit trades based on the conditions. Review the plotted SL and TP levels to monitor the risk-reward setup.
Important Notes:
- This strategy is designed for intraday trading and works best in markets with high volatility during the opening session.
- Backtest the strategy on your preferred market and timeframe to ensure compatibility.
- Proper risk management and position sizing are essential when using this strategy in live markets.

linreg-gridbotLinreg-GridBot
>release note version 1<
Introduction
This script is a powerful trading strategy tool designed to help users identify market reversal points and make smarter trading decisions using grid thinking.
Background
Traditional grid/martingale strategies have several drawbacks: inefficient use of capital, premature grid boundaries, and trading at fixed intervals, all of which significantly reduce profitability. Since, there is not a gridbot can trail-stop at each level, stay close with the trend, and do better capital usage, tradalive has created this advanced gridbot to address these issues, and enhance the profitability.
How does it work?
Imagine plotting closes on a graph, where the x-axis represents the time-intervals and the y-axis represents the price. Linear regression would fit a straight line through these points that best represents the trend of the data.
In this script utilize the built-in to find consecutive slopes at each moment, and combine them to a smooth trend line. When turning point censored, an entry is placed right after the next bar. Then the gridbot starts working, the upper limit and lower limit is calculated by built-in , for example 3 ATRs above and under the entry price.
There is a 0.2 trailing stop for each step level. Also, when built-in VWMA is rising, this script uses built-in ROC to find the average change of lookback length, then move the grid upwards accordingly.
Size trading is crucial, in gridbot all-in when beginning the trade is risky, because turning point does not guarantee a reversal market upcoming. As a grid trader, we believe the price is relatively cheap near the lower limit, and the price is relatively expensive near the upper limit. Properly sized orders help prevent overexposure and reduce the potential for significant losses.
Features
Trend Detection: Utilizes linear regression to differentiate between upward and downward trends, displaying them as (orange) trend lines on the chart.
Signal Generation: Provides buy or sell signals at reversal points, helping users trade at optimal times.
Adjustable Parameters: Allows users to customize different indicator parameters to fit various trading strategies.
Backtested Device Parameters (see appendix)
Grid Parameters
🔃: Cyclic Trading
💰: Capital Turnover Ratio (Grid capital difference per level: 0.5 to 2)
⬆️ / ⬇️ Expected Number of Upward and Downward Grids.
The minimum number of grids is three: one level above and below the current price.
The maximum number of grids is seven: three levels above and below the current price.
🧭: Trade Signal: Controls the trading direction, long or short;
📏: Linear regression length value.
⏳⌛Backtest Period: Set the time range for users to analyze the performance of the strategy over different periods.
Analytic Toolbox (upper right corner) :
Usage Instructions
Add this script to your TradingView account.
Apply the script to your chart.
Adjust the parameters to fit your trading needs.
Make trading decisions based on the buy and sell signals.
Manually place orders on your trading platform using the parameters provided.
Enter grid parameters according to the highest and lowest prices.
Fill in the number of grid levels (the number of grids equals the number of upward grids plus the number of downward grids plus one).
Set stop-loss and take-profit values.
Alternatively, use a webhook to connect to your trading platform for automated trading.
Important Notes
This script currently only supports 4-hour and daily charts!
This script relies on historical data for calculations and may not be suitable for all market conditions.
Trading carries risks, so please use this script cautiously for trading decisions.
User has to update the backtest period, or else the strategy might not be seen.
Demostration
Phase one, the orange line is about to turn up.
Phase two, the reversal point is located, and right after the next bar start an entry of gridbot.
Phase Three, the gridbot operates, once level touches, then a 0.2ATR trailing stop is applied on each step.
Phase four, when vwma rises, the grid window follows it by the rate of change of lookback price. If vwma does not move up, then the grid boundaries remain.
Phase five, either side when the current price breaks through the white limits, the gridbot stops. And the trading strategy is done for this round.

Triple CCI Strategy MFI Confirmed [Skyrexio]Overview
Triple CCI Strategy MFI Confirmed leverages 3 different periods Commodity Channel Index (CCI) indicator in conjunction Money Flow Index (MFI) and Exponential Moving Average (EMA) to obtain the high probability setups. Fast period CCI is used for having the high probability to enter in the direction of short term trend, middle and slow period CCI are used for confirmation, if market now likely in the mid and long-term uptrend. MFI is used to confirm trade with the money inflow/outflow with the high probability. EMA is used as an additional trend filter. Moreover, strategy uses exponential moving average (EMA) to trail the price when it reaches the specific level. More information in "Methodology" and "Justification of Methodology" paragraphs. The strategy opens only long trades.
Unique Features
Dynamic stop-loss system: Instead of fixed stop-loss level strategy utilizes average true range (ATR) multiplied by user given number subtracted from the position entry price as a dynamic stop loss level.
Configurable Trading Periods: Users can tailor the strategy to specific market windows, adapting to different market conditions.
Four layers trade filtering system: Strategy utilizes two different period CCI indicators, MFI and EMA indicators to confirm the signals produced by fast period CCI.
Trailing take profit level: After reaching the trailing profit activation level scrip activate the trailing of long trade using EMA. More information in methodology.
Methodology
The strategy opens long trade when the following price met the conditions:
Fast period CCI shall crossover the zero-line.
Slow and Middle period CCI shall be above zero-lines.
Price shall close above the EMA. Crossover is not obligatory
MFI shall be above 50
When long trade is executed, strategy set the stop-loss level at the price ATR multiplied by user-given value below the entry price. This level is recalculated on every next candle close, adjusting to the current market volatility.
At the same time strategy set up the trailing stop validation level. When the price crosses the level equals entry price plus ATR multiplied by user-given value script starts to trail the price with EMA. If price closes below EMA long trade is closed. When the trailing starts, script prints the label “Trailing Activated”.
Strategy settings
In the inputs window user can setup the following strategy settings:
ATR Stop Loss (by default = 1.75)
ATR Trailing Profit Activation Level (by default = 2.25)
CCI Fast Length (by default = 14, used for calculation short term period CCI)
CCI Middle Length (by default = 25, used for calculation short term period CCI)
CCI Slow Length (by default = 50, used for calculation long term period CCI)
MFI Length (by default = 14, used for calculation MFI
EMA Length (by default = 50, period of EMA, used for trend filtering EMA calculation)
Trailing EMA Length (by default = 20)
User can choose the optimal parameters during backtesting on certain price chart.
Justification of Methodology
Before understanding why this particular combination of indicator has been chosen let's briefly explain what is CCI, MFI and EMA.
The Commodity Channel Index (CCI) is a momentum-based technical indicator that measures the deviation of a security's price from its average price over a specific period. It helps traders identify overbought or oversold conditions and potential trend reversals.
The CCI formula is:
CCI = (Typical Price − SMA) / (0.015 × Mean Deviation)
Typical Price (TP): This is calculated as the average of the high, low, and closing prices for the period.
Simple Moving Average (SMA): This is the average of the Typical Prices over a specific number of periods.
Mean Deviation: This is the average of the absolute differences between the Typical Price and the SMA.
The result is a value that typically fluctuates between +100 and -100, though it is not bounded and can go higher or lower depending on the price movement.
The Money Flow Index (MFI) is a technical indicator that measures the strength of money flowing into and out of a security. It combines price and volume data to assess buying and selling pressure and is often used to identify overbought or oversold conditions. The formula for MFI involves several steps:
1. Calculate the Typical Price (TP):
TP = (high + low + close) / 3
2. Calculate the Raw Money Flow (RMF):
Raw Money Flow = TP × Volume
3. Determine Positive and Negative Money Flow:
If the current TP is greater than the previous TP, it's Positive Money Flow.
If the current TP is less than the previous TP, it's Negative Money Flow.
4. Calculate the Money Flow Ratio (MFR):
Money Flow Ratio = Sum of Positive Money Flow (over n periods) / Sum of Negative Money Flow (over n periods)
5. Calculate the Money Flow Index (MFI):
MFI = 100 − (100 / (1 + Money Flow Ratio))
MFI above 80 can be considered as overbought, below 20 - oversold.
The Exponential Moving Average (EMA) is a type of moving average that places greater weight and significance on the most recent data points. It is widely used in technical analysis to smooth price data and identify trends more quickly than the Simple Moving Average (SMA).
Formula:
1. Calculate the multiplier
Multiplier = 2 / (n + 1) , Where n is the number of periods.
2. EMA Calculation
EMA = (Current Price) × Multiplier + (Previous EMA) × (1 − Multiplier)
This strategy leverages Fast period CCI, which shall break the zero line to the upside to say that probability of short term trend change to the upside increased. This zero line crossover shall be confirmed by the Middle and Slow periods CCI Indicators. At the moment of breakout these two CCIs shall be above 0, indicating that there is a high probability that price is in middle and long term uptrend. This approach increases chances to have a long trade setup in the direction of mid-term and long-term trends when the short-term trend starts to reverse to the upside.
Additionally strategy uses MFI to have a greater probability that fast CCI breakout is confirmed by this indicator. We consider the values of MFI above 50 as a higher probability that trend change from downtrend to the uptrend is real. Script opens long trades only if MFI is above 50. As you already know from the MFI description, it incorporates volume in its calculation, therefore we have another one confirmation factor.
Finally, strategy uses EMA an additional trend filter. It allows to open long trades only if price close above EMA (by default 50 period). It increases the probability of taking long trades only in the direction of the trend.
ATR is used to adjust the strategy risk management to the current market volatility. If volatility is low, we don’t need the large stop loss to understand the there is a high probability that we made a mistake opening the trade. User can setup the settings ATR Stop Loss and ATR Trailing Profit Activation Level to realize his own risk to reward preferences, but the unique feature of a strategy is that after reaching trailing profit activation level strategy is trying to follow the trend until it is likely to be finished instead of using fixed risk management settings. It allows sometimes to be involved in the large movements. It’s also important to make a note, that script uses another one EMA (by default = 20 period) as a trailing profit level.
Backtest Results
Operating window: Date range of backtests is 2022.04.01 - 2024.11.25. It is chosen to let the strategy to close all opened positions.
Commission and Slippage: Includes a standard Binance commission of 0.1% and accounts for possible slippage over 5 ticks.
Initial capital: 10000 USDT
Percent of capital used in every trade: 50%
Maximum Single Position Loss: -4.13%
Maximum Single Profit: +19.66%
Net Profit: +5421.21 USDT (+54.21%)
Total Trades: 108 (44.44% win rate)
Profit Factor: 2.006
Maximum Accumulated Loss: 777.40 USDT (-7.77%)
Average Profit per Trade: 50.20 USDT (+0.85%)
Average Trade Duration: 44 hours
These results are obtained with realistic parameters representing trading conditions observed at major exchanges such as Binance and with realistic trading portfolio usage parameters.
How to Use
Add the script to favorites for easy access.
Apply to the desired timeframe and chart (optimal performance observed on 2h BTC/USDT).
Configure settings using the dropdown choice list in the built-in menu.
Set up alerts to automate strategy positions through web hook with the text: {{strategy.order.alert_message}}
Disclaimer:
Educational and informational tool reflecting Skyrex commitment to informed trading. Past performance does not guarantee future results. Test strategies in a simulated environment before live implementation

Breaks and Retests - Free990Strategy Description: "Breaks and Retests - Free990"
The "Breaks and Retests - Free990" strategy is based on identifying breakout and retest opportunities for potential entries in both long and short trades. The idea is to detect price breakouts above resistance levels or below support levels, and subsequently identify retests that confirm the breakout levels. The strategy offers an automated approach to enter trades after a breakout followed by a retest, which serves as a confirmation of trend continuation.
Key Components:
Support and Resistance Detection:
The strategy calculates pivot levels based on historical price movements to define support and resistance areas. A lookback range is used to determine these key levels.
Breakouts and Retests:
The system identifies when a breakout occurs above a resistance level or below a support level.
It then waits for a retest of the previously broken level as confirmation, which is often a better entry opportunity.
Trade Direction Selection:
Users can choose between "Long Only," "Short Only," or "Both" directions for trading based on their market view.
Stop Loss and Trailing Stop:
An initial stop loss is placed at a defined percentage away from the entry.
The trailing stop loss is activated after the position gains a specified percentage in profit.
Long Entry:
A long entry is triggered if the price breaks above a resistance level and subsequently retests that level successfully.
The entry condition checks if the breakout was confirmed and if a retest was valid.
The long entry is only executed if the user-selected direction is either "Long Only" or "Both."
Short Entry:
A short entry is triggered if the price breaks below a support level and subsequently retests that level.
The short entry is only executed if the user-selected direction is either "Short Only" or "Both."
sell_condition checks whether the support has been broken and whether the retest condition is valid.
An initial stop loss is placed when the trade is opened to limit the risk if the trade moves against the position.
The stop loss is calculated based on a user-defined percentage (stop_loss_percent) of the entry price.
pinescript
Copy code
stop_loss_price := strategy.position_avg_price * (1 - stop_loss_percent / 100)
For long positions, the stop loss is placed below the entry price.
For short positions, the stop loss is placed above the entry price.
Trailing Stop:
When a position achieves a certain profit threshold (profit_threshold_percent), the trailing stop mechanism is activated.
For long positions, the trailing stop follows the highest price reached, ensuring that some profit is locked in if the price reverses.
For short positions, the trailing stop follows the lowest price reached.
Code Logic for Trailing Stop:
Exit Execution:
The strategy exits the position when the price hits the calculated stop loss level.
This includes both the initial stop loss and the trailing stop that adjusts as the trade progresses.
Code Logic for Exit:
Summary:
Breaks and Retests - Free990 uses support and resistance levels to identify breakouts, followed by retests for confirmation.
Entry Points: Triggered when a breakout is confirmed and a retest occurs, for both long and short trades.
Exit Points:
Initial Stop Loss: Limits risk for both long and short trades.
Trailing Stop Loss: Locks in profits as the price moves in favor of the position.
This strategy aims to capture the momentum after breakouts and minimize losses through effective use of stop loss and trailing stops. It gives the flexibility of selecting trade direction and ensures trades are taken with confirmation through the retest, which helps to reduce false breakouts.
Original Code by @HoanGhetti

Dual Strategy Selector V2 - CryptogyaniOverview:
This script provides traders with a dual-strategy system that they can toggle between using a simple dropdown menu in the input settings. It is designed to cater to different trading styles and needs, offering both simplicity and advanced filtering techniques. The strategies are built around moving average crossovers, enhanced by configurable risk management tools like take profit levels, trailing stops, and ATR-based stop-loss.
Key Features:
Two Strategies in One Script:
Strategy 1: A classic moving average crossover strategy for identifying entry signals based on trend reversals. Includes user-defined take profit and trailing stop-loss options for profit locking.
Strategy 2: An advanced trend-following system that incorporates:
A higher timeframe trend filter to confirm entry signals.
ATR-based stop-loss for dynamic risk management.
Configurable partial take profit to secure gains while letting the trade run.
Highly Customizable:
All key parameters such as SMA lengths, take profit levels, ATR multiplier, and timeframe for the trend filter are adjustable via the input settings.
Dynamic Toggle:
Traders can switch between Strategy 1 and Strategy 2 with a single dropdown, allowing them to adapt the strategy to market conditions.
How It Works:
Strategy 1:
Entry Logic: A long trade is triggered when the fast SMA crosses above the slow SMA.
Exit Logic: The trade exits at either a user-defined take profit level (percentage or pips) or via an optional trailing stop that dynamically adjusts based on price movement.
Strategy 2:
Entry Logic: Builds on the SMA crossover logic but adds a higher timeframe trend filter to align trades with the broader market direction.
Risk Management:
ATR-Based Stop-Loss: Protects against adverse moves with a volatility-adjusted stop-loss.
Partial Take Profit: Allows traders to secure a percentage of gains while keeping some exposure for extended trends.
How to Use:
Select Your Strategy:
Use the dropdown in the input settings to choose Strategy 1 or Strategy 2.
Configure Parameters:
Adjust SMA lengths, take profit, and risk management settings to align with your trading style.
For Strategy 2, specify the higher timeframe for trend filtering.
Deploy and Monitor:
Apply the script to your preferred asset and timeframe.
Use the backtest results to fine-tune settings for optimal performance.
Why Choose This Script?:
This script stands out due to its dual-strategy flexibility and enhanced features:
For beginners: Strategy 1 provides a simple yet effective trend-following system with minimal setup.
For advanced traders: Strategy 2 includes powerful tools like trend filters and ATR-based stop-loss, making it ideal for challenging market conditions.
By combining simplicity with advanced features, this script offers something for everyone while maintaining full transparency and user customization.
Default Settings:
Strategy 1:
Fast SMA: 21, Slow SMA: 49
Take Profit: 7% or 50 pips
Trailing Stop: Optional (disabled by default)
Strategy 2:
Fast SMA: 20, Slow SMA: 50
ATR Multiplier: 1.5
Partial Take Profit: 50%
Higher Timeframe: 1 Day (1D)

Fractional Accumulation Distribution Strategy🔹 INTRODUCTION:
As traders and investors, we often find ourselves searching for ways to maximize our market positioning—trying to capture the best price, manage risk, and adapt to ever-changing volatility. Through years of working with a variety of traders and investors, a common theme emerged: the most successful market participants were those who accumulated positions strategically over time, rather than relying on one-off, rigid entry points. However, even the best of them struggled to consistently time their entries and exits for optimal results.
That's why I created the Fractional Accumulation/Distribution Strategy (FADS)—an adaptable solution designed to dynamically adjust position sizing and entry points based on changing market conditions, enabling both passive and active market participants to optimize their approach.
The FADS trading strategy combines volatility-based trend detection and adaptive position scaling to maximize profitability across varied market conditions. By using the price ranges from higher timeframes, FADS pinpoints extreme demand and supply zones with a high statistical probability of reversal, making it effective in both high and low volatility environments. By applying adjustable threshold settings, users can focus on meaningful price movements to reduce unnecessary trades. Adaptive position scaling further enhances this approach by adjusting position sizes based on entry level distances, allowing for strategic position building that balances risk and reward in uncertain markets. This systematic scaling begins with smaller positions, expanding as the trend solidifies, creating a refined, robust trading experience.
🔹 FEATURES:
Multi-Timeframe Volatility-Based Trend Detection
Accumulation/Distribution Level Filter
Customizable Period for Highest/Lowest Prices Capture
Adjustable Sensitivity & Frequency in Positioning
Broad control settings of Strategy
Adaptive Position Scaling
🔹 SETTINGS:
Volatility : Determines trading range based on market volatility . Highest range value number of periods.
Factor : Adjusts the width of the Accumulation & Distribution bands separately. The Level Filter feature offers customizable triggering bands, allowing users to fine-tune the initiation point for the Accumulation/Distribution sequence. This flexibility enables traders to align entries more precisely with market conditions, setting optimal thresholds for initiating trade chains, whether in accumulating positions during uptrends or distributing in downtrends.
Lowest : Choose the price source (e.g., Close, Low). Number of bars considered when determining the lowest price level. Selecting the checkbox generate a signal when the price crosses below the previous lowest value for calculating the lowest value used for trade signals.
Highest : Choose the price source (e.g., Close, High). Number of bars considered when determining the highest price levels. Selecting the checkbox generate a signal when the price crosses above the previous highest value for calculating the highest value used for trade signals.
Accumulation Spread : Adjusts the buying frequency sensitivity by setting the distance between entries based on personal risk tolerance. Larger values for less frequent buys; smaller values for more frequent buys.
Distribution Spread : Adjusts the selling frequency sensitivity by setting the distance between exits based on reward preference. Larger values for less frequent sells; smaller values for more frequent sells.
Percentage of Capital Allocation : Sets the portion of total capital used for the initial trade in a strategy. It sets the scale for subsequent trades during accumulation phase.
🔹 APPLICATIONS:
❖ Accumulation and Distribution Phases
Early entries are avoided by initiating accumulation only after a trend reversal is confirmed and price breaks below long-term range.
Position sizes are determined by the distance between consecutive trades, smaller distance results in smaller position sizes and vice versa.
Average position cost is reduced by accumulating larger positions at the lower prices, potentially resulting in improved profitability.
Early exits are avoided by initiating distribution only after trend reversal is confirmed and price breaks above long-term range.
The pace of distribution can be tracked by the violet line that represents average positions during distribution phase
❖ Use Cases (Different than default setting input is used for illustration purposes)
If the starting point of accumulation starts too high for the risk preference, Accumulation Level Filter can be lowered by increasing the 🟢 threshold Factor.
If the starting point of distribution is too low for the reward preference, the Distribution Level Filter can be raised by increasing the 🔴 threshold Factor.
In lower timeframes, positions during the accumulation phase could be purchased at higher levels relative to prior entry positions. To optimize for this, consider extending the period used to capture the lowest prices. Similarly, during the distribution phase, increasing the period for identifying higher prices can improve accuracy.
🔹 Strategy Properties:
Adjusting properties within the script settings is recommended to align with specific accounts and trading platforms, ensuring realistic strategy results.
Balance (default): $100,000
Initial Order Size: 1% of the default balance
Commission: 0.1%
Slippage: 5 Ticks
Backtesting: Backtested using TradingView’s built-in strategy testing tool with default commission rates of 0.1% and slippage of 5 ticks. It reflects average market conditions for Apple Inc. (APPL) on 1-hour timeframe
Disclaimers: Commission and slippage varies with market conditions and brokerage policies. The assumed value may not represent all trading environments.
PAST PERFORMANCE DOESN’T GUARANTEE FUTURE RESULTS!
Disclaimer: Please remember that past performance may not be indicative of future results. Due to various factors, including changing market conditions, the strategy may no longer perform as well as in historical backtesting. This post and the script don’t provide any financial advice.
This invite-only script is being published as part of my commitment to developing tools that align with TradingView’s community standards. Access requests will be reviewed carefully after the script passes TradingView's moderation process.

Fibonacci ATR Fusion - Strategy [presentTrading]Open-script again! This time is also an ATR-related strategy. Enjoy! :)
If you have any questions, let me know, and I'll help make this as effective as possible.
█ Introduction and How It Is Different
The Fibonacci ATR Fusion Strategy is an advanced trading approach that uniquely integrates Fibonacci-based weighted averages with the Average True Range (ATR) to identify and capitalize on significant market trends.
Unlike traditional strategies that rely on single indicators or static parameters, this method combines multiple timeframes and dynamic volatility measurements to enhance precision and adaptability. Additionally, it features a 4-step Take Profit (TP) mechanism, allowing for systematic profit-taking at various levels, which optimizes both risk management and return potential in long and short market positions.
BTCUSD 6hr Performance
█ Strategy, How It Works: Detailed Explanation
The Fibonacci ATR Fusion Strategy utilizes a combination of technical indicators and weighted averages to determine optimal entry and exit points. Below is a breakdown of its key components and operational logic.
🔶 1. Enhanced True Range Calculation
The strategy begins by calculating the True Range (TR) to measure market volatility accurately.
TR = max(High - Low, abs(High - Previous Close), abs(Low - Previous Close))
High and Low: Highest and lowest prices of the current trading period.
Previous Close: Closing price of the preceding trading period.
max: Selects the largest value among the three calculations to account for gaps and limit movements.
🔶 2. Buying Pressure (BP) Calculation
Buying Pressure (BP) quantifies the extent to which buyers are driving the price upwards within a period.
BP = Close - True Low
Close: Current period's closing price.
True Low: The lower boundary determined in the True Range calculation.
🔶 3. Ratio Calculation for Different Periods
To assess the strength of buying pressure relative to volatility, the strategy calculates a ratio over various Fibonacci-based timeframes.
Ratio = 100 * (Sum of BP over n periods) / (Sum of TR over n periods)
n: Length of the period (e.g., 8, 13, 21, 34, 55).
Sum of BP: Cumulative Buying Pressure over n periods.
Sum of TR: Cumulative True Range over n periods.
This ratio normalizes buying pressure, making it comparable across different timeframes.
🔶 4. Weighted Average Calculation
The strategy employs a weighted average of ratios from multiple Fibonacci-based periods to smooth out signals and enhance trend detection.
Weighted Avg = (w1 * Ratio_p1 + w2 * Ratio_p2 + w3 * Ratio_p3 + w4 * Ratio_p4 + Ratio_p5) / (w1 + w2 + w3 + w4 + 1)
w1, w2, w3, w4: Weights assigned to each ratio period.
Ratio_p1 to Ratio_p5: Ratios calculated for periods p1 to p5 (e.g., 8, 13, 21, 34, 55).
This weighted approach emphasizes shorter periods more heavily, capturing recent market dynamics while still considering longer-term trends.
🔶 5. Simple Moving Average (SMA) of Weighted Average
To further smooth the weighted average and reduce noise, a Simple Moving Average (SMA) is applied.
Weighted Avg SMA = SMA(Weighted Avg, m)
- m: SMA period (e.g., 3).
This smoothed line serves as the primary signal generator for trade entries and exits.
🔶 6. Trading Condition Thresholds
The strategy defines specific threshold values to determine optimal entry and exit points based on crossovers and crossunders of the SMA.
Long Condition = Crossover(Weighted Avg SMA, Long Entry Threshold)
Short Condition = Crossunder(Weighted Avg SMA, Short Entry Threshold)
Long Exit = Crossunder(Weighted Avg SMA, Long Exit Threshold)
Short Exit = Crossover(Weighted Avg SMA, Short Exit Threshold)
Long Entry Threshold (T_LE): Level at which a long position is triggered.
Short Entry Threshold (T_SE): Level at which a short position is triggered.
Long Exit Threshold (T_LX): Level at which a long position is exited.
Short Exit Threshold (T_SX): Level at which a short position is exited.
These conditions ensure that trades are only executed when clear trends are identified, enhancing the strategy's reliability.
Previous local performance
🔶 7. ATR-Based Take Profit Mechanism
When enabled, the strategy employs a 4-step Take Profit system to systematically secure profits as the trade moves in the desired direction.
TP Price_1 Long = Entry Price + (TP1ATR * ATR Value)
TP Price_2 Long = Entry Price + (TP2ATR * ATR Value)
TP Price_3 Long = Entry Price + (TP3ATR * ATR Value)
TP Price_1 Short = Entry Price - (TP1ATR * ATR Value)
TP Price_2 Short = Entry Price - (TP2ATR * ATR Value)
TP Price_3 Short = Entry Price - (TP3ATR * ATR Value)
- ATR Value: Calculated using ATR over a specified period (e.g., 14).
- TPxATR: User-defined multipliers for each take profit level.
- TPx_percent: Percentage of the position to exit at each TP level.
This multi-tiered exit strategy allows for partial position closures, optimizing profit capture while maintaining exposure to potential further gains.
█ Trade Direction
The Fibonacci ATR Fusion Strategy is designed to operate in both long and short market conditions, providing flexibility to traders in varying market environments.
Long Trades: Initiated when the SMA of the weighted average crosses above the Long Entry Threshold (T_LE), indicating strong upward momentum.
Short Trades: Initiated when the SMA of the weighted average crosses below the Short Entry Threshold (T_SE), signaling robust downward momentum.
Additionally, the strategy can be configured to trade exclusively in one direction—Long, Short, or Both—based on the trader’s preference and market analysis.
█ Usage
Implementing the Fibonacci ATR Fusion Strategy involves several steps to ensure it aligns with your trading objectives and market conditions.
1. Configure Strategy Parameters:
- Trading Direction: Choose between Long, Short, or Both based on your market outlook.
- Trading Condition Thresholds: Set the Long Entry, Short Entry, Long Exit, and Short Exit thresholds to define when to enter and exit trades.
2. Set Take Profit Levels (if enabled):
- ATR Multipliers: Define how many ATRs away from the entry price each take profit level is set.
- Take Profit Percentages: Allocate what percentage of the position to close at each TP level.
3. Apply to Desired Chart:
- Add the strategy to the chart of the asset you wish to trade.
- Observe the plotted Fibonacci ATR and SMA Fibonacci ATR indicators for visual confirmation.
4. Monitor and Adjust:
- Regularly review the strategy’s performance through backtesting.
- Adjust the input parameters based on historical performance and changing market dynamics.
5. Risk Management:
- Ensure that the sum of take profit percentages does not exceed 100% to avoid over-closing positions.
- Utilize the ATR-based TP levels to adapt to varying market volatilities, maintaining a balanced risk-reward ratio.
█ Default Settings
Understanding the default settings is crucial for optimizing the Fibonacci ATR Fusion Strategy's performance. Here's a precise and simple overview of the key parameters and their effects:
🔶 Key Parameters and Their Effects
1. Trading Direction (`tradingDirection`)
- Default: Both
- Effect: Determines whether the strategy takes both long and short positions or restricts to one direction. Selecting Both allows maximum flexibility, while Long or Short can be used for directional bias.
2. Trading Condition Thresholds
Long Entry (long_entry_threshold = 58.0): Higher values reduce false positives but may miss trades.
Short Entry (short_entry_threshold = 42.0): Lower values capture early short trends but may increase false signals.
Long Exit (long_exit_threshold = 42.0): Exits long positions early, securing profits but potentially cutting trends short.
Short Exit (short_exit_threshold = 58.0): Delays short exits to capture favorable movements, avoiding premature exits.
3. Take Profit Configuration (`useTakeProfit` = false)
- Effect: When enabled, the strategy employs a 4-step TP mechanism to secure profits at multiple levels. By default, it is disabled to allow users to opt-in based on their trading style.
4. ATR-Based Take Profit Multipliers
TP1 (tp1ATR = 3.0): Sets the first TP at 3 ATRs for initial profit capture.
TP2 (tp2ATR = 8.0): Targets larger trends, though less likely to be reached.
TP3 (tp3ATR = 14.0): Optimizes for extreme price moves, seldom triggered.
5. Take Profit Percentages
TP Level 1 (tp1_percent = 12%): Secures 12% at the first TP.
TP Level 2 (tp2_percent = 12%): Exits another 12% at the second TP.
TP Level 3 (tp3_percent = 12%): Closes an additional 12% at the third TP.
6. Weighted Average Parameters
Ratio Periods: Fibonacci-based intervals (8, 13, 21, 34, 55) balance responsiveness.
Weights: Emphasizes recent data for timely responses to market trends.
SMA Period (weighted_avg_sma_period = 3): Smoothens data with minimal lag, balancing noise reduction and responsiveness.
7. ATR Period (`atrPeriod` = 14)
Effect: Sets the ATR calculation length, impacting TP sensitivity to volatility.
🔶 Impact on Performance
- Sensitivity and Responsiveness:
- Shorter Ratio Periods and Higher Weights: Make the weighted average more responsive to recent price changes, allowing quicker trade entries and exits but increasing the likelihood of false signals.
- Longer Ratio Periods and Lower Weights: Provide smoother signals with fewer false positives but may delay trade entries, potentially missing out on significant price moves.
- Profit Taking:
- ATR Multipliers: Higher multipliers set take profit levels further away, targeting larger price movements but reducing the probability of reaching these levels.
- Fixed Percentages: Allocating equal percentages at each TP level ensures consistent profit realization and risk management, preventing overexposure.
- Trade Direction Control:
- Selecting Specific Directions: Restricting trades to Long or Short can align the strategy with market trends or personal biases, potentially enhancing performance in trending markets.
- Risk Management:
- Take Profit Percentages: Dividing the position into smaller percentages at multiple TP levels helps lock in profits progressively, reducing risk and allowing the remaining position to ride further trends.
- Market Adaptability:
- Weighted Averages and ATR: By combining multiple timeframes and adjusting to volatility, the strategy adapts to different market conditions, maintaining effectiveness across various asset classes and timeframes.
---
If you want to know more about ATR, can also check "SuperATR 7-Step Profit".
Enjoy trading.

XAUUSD 10-Minute StrategyThis XAUUSD 10-Minute Strategy is designed for trading Gold vs. USD on a 10-minute timeframe. By combining multiple technical indicators (MACD, RSI, Bollinger Bands, and ATR), the strategy effectively captures both trend-following and reversal opportunities, with adaptive risk management for varying market volatility. This approach balances high-probability entries with robust volatility management, making it suitable for traders seeking to optimise entries during significant price movements and reversals.
Key Components and Logic:
MACD (12, 26, 9):
Generates buy signals on MACD Line crossovers above the Signal Line and sell signals on crossovers below the Signal Line, helping to capture momentum shifts.
RSI (14):
Utilizes oversold (below 35) and overbought (above 65) levels as a secondary filter to validate entries and avoid overextended price zones.
Bollinger Bands (20, 2):
Uses upper and lower Bollinger Bands to identify potential overbought and oversold conditions, aiming to enter long trades near the lower band and short trades near the upper band.
ATR-Based Stop Loss and Take Profit:
Stop Loss and Take Profit levels are dynamically set as multiples of ATR (3x for stop loss, 5x for take profit), ensuring flexibility with market volatility to optimise exit points.
Entry & Exit Conditions:
Buy Entry: T riggered when any of the following conditions are met:
MACD Line crosses above the Signal Line
RSI is oversold
Price drops below the lower Bollinger Band
Sell Entry: Triggered when any of the following conditions are met:
MACD Line crosses below the Signal Line
RSI is overbought
Price moves above the upper Bollinger Band
Exit Strategy: Trades are closed based on opposing entry signals, with adaptive spread adjustments for realistic exit points.
Backtesting Configuration & Results:
Backtesting Period: July 21, 2024, to October 30, 2024
Symbol Info: XAUUSD, 10-minute timeframe, OANDA data source
Backtesting Capital: Initial capital of $700, with each trade set to 10 contracts (equivalent to approximately 0.1 lots based on the broker’s contract size for gold).
Users should confirm their broker's contract size for gold, as this may differ. This script uses 10 contracts for backtesting purposes, aligned with 0.1 lots on brokers offering a 100-contract specification.
Key Backtesting Performance Metrics:
Net Profit: $4,733.90 USD (676.27% increase)
Total Closed Trades: 526
Win Rate: 53.99%
Profit Factor: 1.44 (1.96 for Long trades, 1.14 for Short trades)
Max Drawdown: $819.75 USD (56.33% of equity)
Sharpe Ratio: 1.726
Average Trade: $9.00 USD (0.04% of equity per trade)
This backtest reflects realistic conditions, with a spread adjustment of 38 points and no slippage or commission applied. The settings aim to simulate typical retail trading conditions. However, please adjust the initial capital, contract size, and other settings based on your account specifics for best results.
Usage:
This strategy is tuned specifically for XAUUSD on a 10-minute timeframe, ideal for both trend-following and reversal trades. The ATR-based stop loss and take profit levels adapt dynamically to market volatility, optimising entries and exits in varied conditions. To backtest this script accurately, ensure your broker’s contract specifications for gold align with the parameters used in this strategy.

Supertrend StrategyThe Supertrend Strategy was created based on the Supertrend and Relative Strength Index (RSI) indicators, widely respected tools in technical analysis. This strategy combines these two indicators to capture market trends with precision and reliability, looking for optimizing exit levels at oversold or overbought price levels.
The Supertrend indicator identifies trend direction based on price and volatility by using the Average True Range (ATR). The ATR measures market volatility by calculating the average range between an asset’s high and low prices over a set period. It provides insight into price fluctuations, with higher ATR values indicating increased volatility and lower values suggesting stability. The Supertrend Indicator plots a line above or below the price, signaling potential buy or sell opportunities: when the price closes above the Supertrend line, an uptrend is indicated, while a close below the line suggests a downtrend. This line shifts as price movements and volatility levels change, acting as both a trailing stop loss and trend confirmation.
To enhance the Supertrend strategy, the Relative Strength Index (RSI) has been added as an exit criterion. As a momentum oscillator, the RSI indicates overbought (usually above 70) or oversold (usually below 30) conditions. This integration allows trades to close when the asset is overbought or oversold, capturing gains before a possible reversal, even if the percentage take profit level has not been reached. This mechanism aims to prevent losses due to market reversals before the Supertrend signal changes.
### Key Features
1. **Entry criteria**:
- The strategy uses the Supertrend indicator calculated by adding or subtracting a multiple of the ATR from the closing price, depending on the trend direction.
- When the price crosses above the Supertrend line, the strategy signals a long (buy) entry. Conversely, when the price crosses below, it signals a short (sell) entry.
- The strategy performs a reversal if there is an open position and a change in the direction of the supertrend occurs
2. **Exit criteria**:
- Take profit of 30% (default) on the average position price.
- Oversold (≤ 5) or overbought (≥ 95) RSI
- Reversal when there is a change in direction of the Supertrend
3. **No Repainting**:
- This strategy is not subject to repainting, as long as the timeframe configured on your chart is the same as the supertrend timeframe .
4. **Position Sizing by Equity and risk management**:
- This strategy has a default configuration to operate with 35% of the equity. At the time of opening the position, the supertrend line is typically positioned at about 12 to 16% of the entry price. This way, the strategy is putting at risk about 16% of 35% of equity, that is, around 5.6% of equity for each trade. The percentage of equity can be adjusted by the user according to their risk management.
5. **Backtest results**:
- This strategy was subjected to deep backtesting and operations in replay mode, including transaction fees of 0.12%, and slippage of 5 ticks.
- The past results in deep backtest and replay mode were compatible and profitable (Variable results depending on the take profit used, supertrend and RSI parameters). However, it should be noted that few operations were evaluated, since the currency in question has been created for a short time and the frequency of operations is relatively small.
- Past results are no guarantee of future results. The strategy's backtest results may even be due to overfitting with past data.
Default Settings
Chart timeframe: 2h
Supertrend Factor: 3.42
ATR period: 14
Supertrend timeframe: 2 h
RSI timeframe: 15 min
RSI Lenght: 5 min
RSI Upper limit: 95
RSI Lower Limit: 5
Take Profit: 30%
BYBIT:1000000MOGUSDT.P

Statistical ArbitrageThe Statistical Arbitrage Strategy, also known as pairs trading, is a quantitative trading method that capitalizes on price discrepancies between two correlated assets. The strategy assumes that over time, the prices of these two assets will revert to their historical relationship. The core idea is to take advantage of mean reversion, a principle suggesting that asset prices will revert to their long-term average after deviating significantly.
Strategy Mechanics:
1. Selection of Correlated Assets:
• The strategy focuses on two historically correlated assets (e.g., equity index futures like Dow Jones Mini and S&P 500 Mini). These assets tend to move in the same direction due to similar underlying fundamentals, such as overall market conditions. By tracking their relative prices, the strategy seeks to exploit temporary mispricings.
2. Spread Calculation:
• The spread is the difference between the prices of the two assets. This spread represents the relationship between the assets and serves as the basis for determining when to enter or exit trades.
3. Mean and Standard Deviation:
• The historical average (mean) of the spread is calculated using a Simple Moving Average (SMA) over a chosen period. The strategy also computes the standard deviation (volatility) of the spread, which measures how far the spread has deviated from the mean over time. This allows the strategy to define statistically significant price deviations.
4. Entry Signal (Mean Reversion):
• A buy signal is triggered when the spread falls below the mean by a multiple (e.g., two) of the standard deviation. This indicates that one asset is temporarily undervalued relative to the other, and the strategy expects the spread to revert to its mean, generating profits as the prices converge.
5. Exit Signal:
• The strategy exits the trade when the spread reverts to the mean. At this point, the mispricing has been corrected, and the profit from the mean reversion is realized.
Academic Support:
Statistical arbitrage has been widely studied in finance and economics. Gatev, Goetzmann, and Rouwenhorst’s (2006) landmark study on pairs trading demonstrated that this strategy could generate excess returns in equity markets. Their research found that by focusing on historically correlated stocks, traders could identify pricing anomalies and profit from their eventual correction.
Additionally, Avellaneda and Lee (2010) explored statistical arbitrage in different asset classes and found that exploiting deviations in price relationships can offer a robust, market-neutral trading strategy. In these studies, the strategy’s success hinges on the stability of the relationship between the assets and the timely execution of trades when deviations occur.
Risks of Statistical Arbitrage:
1. Correlation Breakdown:
• One of the primary risks is the breakdown of correlation between the two assets. Statistical arbitrage assumes that the historical relationship between the assets will hold in the future. However, market conditions, company fundamentals, or external shocks (e.g., macroeconomic changes) can cause these assets to deviate permanently, leading to potential losses.
• For instance, if two equity indices historically move together but experience divergent economic conditions or policy changes, their prices may no longer revert to the expected mean.
2. Execution Risk:
• This strategy relies on efficient execution and tight spreads. In volatile or illiquid markets, the actual price at which trades are executed may differ significantly from expected prices, leading to slippage and reduced profits.
3. Market Risk:
• Although statistical arbitrage is designed to be market-neutral (i.e., not dependent on the overall market direction), it is not entirely risk-free. Systematic market shocks, such as financial crises or sudden shifts in market sentiment, can affect both assets simultaneously, causing the spread to widen rather than revert to the mean.
4. Model Risk:
• The assumptions underlying the strategy, particularly regarding mean reversion, may not always hold true. The model assumes that asset prices will return to their historical averages within a certain timeframe, but the timing and magnitude of mean reversion can be uncertain. Misestimating this timeframe can lead to extended drawdowns or unrealized losses.
5. Overfitting:
• Over-reliance on historical data to fine-tune the strategy parameters (e.g., the lookback period or standard deviation thresholds) may result in overfitting. This means that the strategy works well on past data but fails to perform in live markets due to changing conditions.
Conclusion:
The Statistical Arbitrage Strategy offers a systematic and quantitative approach to trading that capitalizes on temporary price inefficiencies between correlated assets. It has been proven to generate returns in academic studies and is widely used by hedge funds and institutional traders for its market-neutral characteristics. However, traders must be aware of the inherent risks, including correlation breakdown, execution risks, and the potential for prolonged deviations from the mean. Effective risk management, diversification, and constant monitoring are essential for successfully implementing this strategy in live markets.

Velocity/Volatility/Volume StrategyThe "Vel/Vty/Vol Strategy" is a momentum-based trading approach designed to take advantage of strong price movements that are confirmed by both volatility and volume (if enabled). It provides a high level of customization, allowing traders to adjust various settings based on market conditions and individual preferences. By combining three critical indicators—velocity, volatility (measured through Bollinger Band Width), and an optional volume filter—the strategy generates trade signals for both long and short positions. Here’s a comprehensive explanation of how the strategy works, how the parameters can be customized, and how those adjustments benefit users.
At its core, the strategy focuses on velocity, which measures the speed at which price is changing over time. This is a key indicator of momentum, with a "StrongUp" signal indicating bullish momentum and a "StrongDown" signal suggesting bearish momentum. In addition to velocity, the strategy factors in acceleration, which helps gauge whether momentum is building or weakening. The second essential component is Bollinger Band Width (BBW), which measures volatility in the market. When the BBW expands, it signals increasing volatility, a condition that must be met in combination with a velocity signal to generate a trade. Lastly, the strategy includes an optional Volume Oscillator to filter trades. When this volume filter is enabled, trades will only be executed if there’s an increase in volume, further validating market activity.
The strategy generates long and short trade signals based on specific conditions. A long trade is triggered when there is a strong upward velocity, accompanied by an increase in Bollinger Band Width, indicating both momentum and heightened volatility. If the volume filter is toggled on, a rise in volume must also confirm the signal. Similarly, a short trade is initiated when a strong downward velocity is detected, again paired with an increase in volatility and, optionally, a volume rise. This ensures that trades occur during periods of heightened market activity, reducing the likelihood of false signals.
To help manage risk, the strategy includes several customizable tools. Users can set take profit levels to automatically close positions and lock in gains once a predefined profit percentage is reached. For example, if a 2% take profit is set, a long position will be closed once the price has risen by 2%. Additionally, a trailing take profit option can be enabled, allowing the strategy to dynamically adjust the take-profit target as the market moves in the user’s favor. This ensures that profits are locked in as long as the market continues to trend positively, while providing protection in case of a reversal. The strategy also includes a trailing stop-loss feature, which adjusts the stop price as the market moves in favor of the trade, helping to minimize losses and protect gains.
The strategy offers a variety of parameters that can be customized to suit different trading styles and market conditions. The velocity lookback period controls how far back the strategy looks to calculate velocity. A shorter lookback makes the strategy more sensitive to recent price changes, generating more signals, which can benefit day traders or those seeking to capture short-term price swings. Conversely, a longer lookback smooths out the velocity calculation, reducing false signals and making the strategy more suitable for traders seeking to capture larger trends. Similarly, the Bollinger Band Width (BBW) length can be adjusted to control how far back the strategy looks to calculate volatility. A shorter BBW length makes the strategy more sensitive to volatility spikes, useful in rapidly changing markets. In contrast, a longer BBW length filters out short-term noise and focuses on more sustainable volatility shifts, better suited for slower, more stable markets.
The volume filter is another powerful feature that can be toggled on or off. When turned on, the strategy will only execute trades if there is an increase in volume alongside velocity and volatility signals. This helps filter out false signals in low-volume markets, ensuring that price movements are supported by actual market activity. If the volume filter is turned off, the strategy focuses purely on price and volatility changes, which can be useful in markets where volume data is unreliable or less relevant.
The take profit percentage can be adjusted to define how aggressively or conservatively profits are locked in. A lower take profit percentage allows traders to capture smaller, quicker profits, which can be advantageous in volatile markets. A higher take profit percentage suits traders who prefer to capture larger moves, allowing them to stay in trades longer to benefit from extended trends. Similarly, the trailing take profit percentage determines how tightly the strategy follows market prices as they move in favor of the trade. A tighter trailing percentage ensures that profits are locked in quickly, while a wider trailing percentage gives trades more room to run, ideal for capturing large trends.
The stop loss percentage is another key setting that controls how much risk a trader is willing to take before the position is closed. A tighter stop loss minimizes losses but may result in more frequent stop-outs, particularly in volatile markets. A wider stop loss provides more room for trades to develop, which is useful for traders aiming to capture longer trends despite short-term fluctuations. Additionally, the velocity thresholds can be adjusted to set how sensitive the strategy is to price movements. Lower thresholds increase sensitivity, generating more signals in fast-moving markets, while higher thresholds filter out weaker signals, focusing on larger momentum shifts.
The strategy also allows users to define a time range during which it is active, offering flexibility in backtesting and optimizing for specific market conditions. By limiting the strategy to certain periods, users can tailor it to seasonal trends or historical data that matches their current trading environment.
The flexibility of this strategy makes it suitable for a wide range of traders. Day traders can benefit from adjusting the velocity and BBW lookback periods, tightening take profit and stop loss settings to capture short, fast price movements in highly volatile markets. Trend traders can lengthen the lookback periods and widen the velocity thresholds to capture larger, sustained moves while riding out short-term volatility. Traders with a lower risk tolerance can enable the volume filter and tighten stop losses to reduce false signals and minimize losses. On the other hand, aggressive traders can widen the take profit and trailing stop percentages to allow trades to develop fully, maximizing potential gains in trending markets.
Ultimate Oscillator Trading StrategyThe Ultimate Oscillator Trading Strategy implemented in Pine Script™ is based on the Ultimate Oscillator (UO), a momentum indicator developed by Larry Williams in 1976. The UO is designed to measure price momentum over multiple timeframes, providing a more comprehensive view of market conditions by considering short-term, medium-term, and long-term trends simultaneously. This strategy applies the UO as a mean-reversion tool, seeking to capitalize on temporary deviations from the mean price level in the asset’s movement (Williams, 1976).
Strategy Overview:
Calculation of the Ultimate Oscillator (UO):
The UO combines price action over three different periods (short-term, medium-term, and long-term) to generate a weighted momentum measure. The default settings used in this strategy are:
Short-term: 6 periods (adjustable between 2 and 10).
Medium-term: 14 periods (adjustable between 6 and 14).
Long-term: 20 periods (adjustable between 10 and 20).
The UO is calculated as a weighted average of buying pressure and true range across these periods. The weights are designed to give more emphasis to short-term momentum, reflecting the short-term mean-reversion behavior observed in financial markets (Murphy, 1999).
Entry Conditions:
A long position is opened when the UO value falls below 30, indicating that the asset is potentially oversold. The value of 30 is a common threshold that suggests the price may have deviated significantly from its mean and could be due for a reversal, consistent with mean-reversion theory (Jegadeesh & Titman, 1993).
Exit Conditions:
The long position is closed when the current close price exceeds the previous day’s high. This rule captures the reversal and price recovery, providing a defined point to take profits.
The use of previous highs as exit points aligns with breakout and momentum strategies, as it indicates sufficient strength for a price recovery (Fama, 1970).
Scientific Basis and Rationale:
Momentum and Mean-Reversion:
The strategy leverages two well-established phenomena in financial markets: momentum and mean-reversion. Momentum, identified in earlier studies like those by Jegadeesh and Titman (1993), describes the tendency of assets to continue in their direction of movement over short periods. Mean-reversion, as discussed by Poterba and Summers (1988), indicates that asset prices tend to revert to their mean over time after short-term deviations. This dual approach aims to buy assets when they are temporarily oversold and capitalize on their return to the mean.
Multi-timeframe Analysis:
The UO’s incorporation of multiple timeframes (short, medium, and long) provides a holistic view of momentum, unlike single-period oscillators such as the RSI. By combining data across different timeframes, the UO offers a more robust signal and reduces the risk of false entries often associated with single-period momentum indicators (Murphy, 1999).
Trading and Market Efficiency:
Studies in behavioral finance, such as those by Shiller (2003), show that short-term inefficiencies and behavioral biases can lead to overreactions in the market, resulting in price deviations. This strategy seeks to exploit these temporary inefficiencies, using the UO as a signal to identify potential entry points when the market sentiment may have overly pushed the price away from its average.
Strategy Performance:
Backtests of this strategy show promising results, with profit factors exceeding 2.5 when the default settings are optimized. These results are consistent with other studies on short-term trading strategies that capitalize on mean-reversion patterns (Jegadeesh & Titman, 1993). The use of a dynamic, multi-period indicator like the UO enhances the strategy’s adaptability, making it effective across different market conditions and timeframes.
Conclusion:
The Ultimate Oscillator Trading Strategy effectively combines momentum and mean-reversion principles to trade on temporary market inefficiencies. By utilizing multiple periods in its calculation, the UO provides a more reliable and comprehensive measure of momentum, reducing the likelihood of false signals and increasing the profitability of trades. This aligns with modern financial research, showing that strategies based on mean-reversion and multi-timeframe analysis can be effective in capturing short-term price movements.
References:
Fama, E. F. (1970). Efficient Capital Markets: A Review of Theory and Empirical Work. The Journal of Finance, 25(2), 383-417.
Jegadeesh, N., & Titman, S. (1993). Returns to Buying Winners and Selling Losers: Implications for Stock Market Efficiency. The Journal of Finance, 48(1), 65-91.
Murphy, J. J. (1999). Technical Analysis of the Financial Markets: A Comprehensive Guide to Trading Methods and Applications. New York Institute of Finance.
Poterba, J. M., & Summers, L. H. (1988). Mean Reversion in Stock Prices: Evidence and Implications. Journal of Financial Economics, 22(1), 27-59.
Shiller, R. J. (2003). From Efficient Markets Theory to Behavioral Finance. Journal of Economic Perspectives, 17(1), 83-104.
Williams, L. (1976). Ultimate Oscillator. Market research and technical trading analysis.

Central Pivot Point Cross & Retrace Strategy // AlgoFyreThe Central Pivot Point Cross & Retrace Strategy uses pivot points for trend identification and trade entry. It combines accumulation/distribution indicators with pivot point levels to generate signals. The strategy incorporates dynamic position sizing based on a fixed risk amount and allows for both long and short positions with customizable stop-loss levels.
TABLE OF CONTENTS
🔶 ORIGINALITY
🔸Pivot Point-Based Trading
🔸Accumulation/Distribution
🔸Dynamic Position Sizing
🔸Customizable Risk Management
🔶 FUNCTIONALITY
🔸Indicators
🞘 Pivot Points
🞘 Accumulation/Distribution
🔸Conditions
🞘 Long Entry
🞘 Short Entry
🞘 Take Profit
🞘 Stop Loss
🔶 INSTRUCTIONS
🔸Adding the Strategy to the Chart
🔸Configuring the Strategy
🔸Backtesting and Practice
🔸Market Awareness
🔸Visual Customization
🔶 CONCLUSION
▅▅▅▅▅▅▅▅▅▅▅▅▅▅▅▅▅▅▅▅▅▅▅▅▅▅▅▅▅▅▅▅▅▅▅▅▅▅▅▅▅▅▅▅▅
🔶 ORIGINALITY The Central Pivot Point Cross & Retrace Strategy uniquely combines pivot point analysis with accumulation/distribution indicators to identify optimal entry and exit points. It employs dynamic position sizing based on a fixed risk amount, ensuring consistent risk management across trades. This approach allows traders to adapt to varying market conditions by adjusting position sizes according to predefined risk parameters, enhancing both flexibility and control in trading decisions. The strategy's integration of customizable stop-loss levels further refines its risk management capabilities.
🔸Pivot Point-Based Trading This strategy utilizes daily pivot points to identify key support and resistance levels, providing a framework for trend identification and trade entry. The central pivot point serves as the intraday point of balance between buyers and sellers, with the largest amount of trading volume assumed to take place in this area.
🔸Accumulation/Distribution The strategy incorporates the Accumulation/Distribution (A/D) line, an underrated volume-based indicator, to establish the main trend. The A/D line is used in conjunction with a trend based indicator like the 200-period Exponential Moving Average (EMA) to confirm trend direction and strength.
🔸Dynamic Position Sizing Position sizes are calculated dynamically based on a fixed risk amount, allowing traders to maintain consistent risk exposure across trades.
🔸Customizable Risk Management Traders can set flexible risk-reward ratios and adjust stop-loss and take-profit levels, tailoring the strategy to their risk tolerance and market conditions. The strategy recommends taking partial profits at S1 or R1 levels and moving the stop-loss to break-even for remaining positions.
🔶 FUNCTIONALITY The Central Pivot Point Cross & Retrace Strategy leverages pivot points and accumulation/distribution indicators to identify optimal trading opportunities. This strategy is designed to capitalize on price movements around key pivot levels by dynamically adjusting position sizes based on predefined risk parameters. It allows traders to manage risk effectively while taking advantage of both long and short positions.
🔸Indicators 🞘 Pivot Points: Calculates daily pivot points (PP, R1, R2, S1, S2) to identify key support and resistance levels. The central pivot point is crucial for determining market bias and entry points.
🞘 Accumulation/Distribution: Uses the A/D line and with a trend based indicator like the 200 EMA to determine market direction and trend strength. This combination helps eliminate noise and provides more reliable trend signals. We recommend using the Adaptive MAs (Hurst, CVaR, Fractal) // AlgoFyre , but any moving average could be used.
🔸Conditions 🞘 Long Entry: Initiates a long position when the price crosses above the central pivot point (PP), retraces back to it and the A/D line is above its 200 EMA, indicating an uptrend. A limit entry order is set at the PP for entering the long trade.
🞘 Short Entry: Initiates a short position when the price crosses below the central pivot point (PP), retraces back to it and the A/D line is below its 200 EMA, indicating a downtrend. A limit entry order is set at the PP for entering the short trade.
🞘 Take Profit: 50% of the position is closed as profit when R1 for Longs and S1 for Shorts is reached. The position is fully closed when R2 for Longs and S2 for Shorts is reached.
🞘 Stop Loss: Stop loss is set via strategy settings. When the first 50% take profit for both long and shorts is taken, stop loss for both will be moved to break-even/entry.
🔶 INSTRUCTIONS
The Central Pivot Point Cross & Retrace Strategy can be set up by adding it to your TradingView chart and configuring parameters such as the accumulation/distribution source, stop-loss percentage, and risk management settings. This strategy is designed to capitalize on price movements around key pivot levels by dynamically adjusting position sizes based on predefined risk parameters. Enhance the accuracy of signals by combining this strategy with additional indicators like trend-following or momentum-based tools. Adjust settings to better manage risk and optimize entry and exit points.
🔸Adding the Strategy to the Chart Go to your TradingView chart.
Click on the "Pine Editor" button at the bottom of the chart.
Copy and paste the strategy code into the Pine Editor.
Click "Add to Chart" to apply the strategy.
Add the technical indicator "Accumulation/Distribution" to the chart.
Add the trend indicator " Adaptive MAs (Hurst, CVaR, Fractal) // AlgoFyre " or any other MA to the chart and move it to the "Accumulation/Distribution" pane.
Set the source of your trend indicator to "Accumulation/Distribution".
🔸Configuring the Strategy Open the strategy settings by clicking on the gear icon next to its name on the chart.
Accumulation/Distribution Source: Select the source for the accumulation/distribution indicator.
Accumulation/Distribution EMA Source: Select the source for the trend indicator.
Stop Loss Percentage: Set the stop loss distance from the pivot point as a percentage.
Risk Amount: Define the fixed risk amount for position sizing.
Base Order Size: Set the base order size for position calculations.
Number of Positions: Specify the maximum number of positions allowed.
Time Frame: Adjust the time frame based on the currency pair or asset being traded (e.g., 15-minute for EUR/USD, 30-minute for GBP/USD).
🔸Backtesting and Practice Backtest the strategy on historical data to understand how it performs in various market environments.
Practice using the strategy on a demo account before implementing it in live trading.
Test different time frames and asset pairs to find the most suitable combinations.
🔸Market Awareness Keep an eye on market news and events that might cause extreme price movements. The strategy reacts to price data and might not account for news-driven events that can cause large deviations.
Remember that this strategy is not recommended for stocks due to the A/D line's inability to account for gaps in its calculation.
🔸Visual Customization Visualization Settings: Customize the display of entry price, take profit, and stop loss levels.
Color Settings: Switch to the AlgoFyre theme or set custom colors for bullish, bearish, and neutral states.
Table Settings: Enable or disable the information table and adjust its position.
🔶 CONCLUSION
The Central Pivot Point Cross & Retrace Strategy provides a robust framework for capitalizing on price movements around key pivot levels by combining pivot point analysis with accumulation/distribution indicators. This strategy leverages pivot point crossovers to identify entry points and utilizes the A/D line crossover with its 200 EMA for trend confirmation, ensuring trades align with prevailing market conditions. By incorporating dynamic position sizing based on a fixed risk amount, traders can effectively manage risk and adapt to varying market conditions. The strategy's focus on trading around the central pivot point and its customizable stop-loss and take-profit levels further enhance its risk management capabilities, making it a versatile tool for both trending and ranging markets. With its strategic blend of technical indicators and risk management, the Central Pivot Point Cross & Retrace Strategy offers traders a comprehensive approach to optimizing trade execution and maximizing potential returns across various currency pairs and commodities.

Gauss KenJi Robot
Gauss KenJi Trading Robot: Precision and Automation for Traders
The Gauss KenJi robot is a cutting-edge trading solution designed for experienced traders seeking to enhance their decision-making through advanced statistical models and automation. Unlike traditional trading tools that rely on generic indicators prone to false signals, the Gauss KenJi robot offers an innovative approach by utilizing two unique indicators: the Kenji Indicator v.2.0 and the Gauss Indicator .
Kenji Indicator v.2.0
Traditional moving averages and related indicators often fail in flat market conditions, where frequent crossovers lead to confusing signals and false trends. The Kenji Indicator addresses this issue by using a combination of correlation analysis and moving averages to more accurately identify the market’s state. This real-time insight allows for better navigation of local trends, reducing noise and increasing the precision of trade signals.
Gauss Indicator
The Gauss Indicator brings the power of statistical analysis into trading by applying the 3 sigmas rule. It calculates and predicts the likely price ranges for specific time frames (hourly, daily, weekly) with probabilities of 68%, 95%, and 99%. This offers traders an actionable framework for setting stop-loss, take-profit, and identifying key support and resistance levels. By providing a clearer view of potential price movements, the Gauss Indicator improves decision-making, ensuring that traders enter and exit the market at optimal points.
Gauss KenJi Robot: How it Works
The Gauss KenJi robot operates on a statistical algorithm based on the Gaussian function, which uses market volatility as a core indicator of price movements. The robot opens positions in the direction of the trend when the price reaches the predetermined Gauss border. Position sizes are calculated according to the “Initial_lot” parameter, with stop-loss and take-profit levels defined by the “Pips” parameter. Trades are automatically closed either when profit targets or stop-loss limits are reached, or if local trend reversals are detected by the Kenji Indicator.
This highly adaptable algorithm can be applied to any asset class (stocks, forex, crypto, commodities) and any time frame, providing traders with a versatile tool to navigate various markets.
Why Gauss KenJi is Essential for Traders
1. Time Efficiency: The robot operates autonomously, allowing traders to step away from constant chart monitoring while still capitalizing on market movements.
2. Profit Maximization: By leveraging machine learning and advanced statistical models, the robot identifies opportunities faster than human traders, ensuring more profitable trades.
3. Risk Management: The robot strictly adheres to predefined rules, helping traders minimize losses and protect their capital in volatile market conditions.
4. Cross-market Versatility: Whether you’re trading forex, stocks, crypto, or commodities, Gauss KenJi adapts to different markets and time frames, making it a versatile tool for professional traders.
The Gauss KenJi robot is a comprehensive, scientifically driven trading solution designed to eliminate common pitfalls associated with traditional indicators. Its combination of the Kenji Indicator’s trend identification and the Gauss Indicator’s price prediction capabilities makes it an indispensable tool for traders looking to enhance both the precision of their trades and the automation of their strategies. Whether you are aiming for consistent daily profits or optimizing long-term trading strategies, Gauss KenJi offers the efficiency and accuracy required to stay ahead in today’s competitive markets.

Simple RSI stock Strategy [1D] The "Simple RSI Stock Strategy " is designed to long-term traders. Strategy uses a daily time frame to capitalize on signals generated by the Relative Strength Index (RSI) and the Simple Moving Average (SMA). This strategy is suitable for low-leverage trading environments and focuses on identifying potential buy opportunities when the market is oversold, while incorporating strong risk management with both dynamic and static Stop Loss mechanisms.
This strategy is recommended for use with a relatively small amount of capital and is best applied by diversifying across multiple stocks in a strong uptrend, particularly in the S&P 500 stock market. It is specifically designed for equities, and may not perform well in other markets such as commodities, forex, or cryptocurrencies, where different market dynamics and volatility patterns apply.
Indicators Used in the Strategy:
1. RSI (Relative Strength Index):
- The RSI is a momentum oscillator used to identify overbought and oversold conditions in the market.
- This strategy enters long positions when the RSI drops below the oversold level (default: 30), indicating a potential buying opportunity.
- It focuses on oversold conditions but uses a filter (SMA 200) to ensure trades are only made in the context of an overall uptrend.
2. SMA 200 (Simple Moving Average):
- The 200-period SMA serves as a trend filter, ensuring that trades are only executed when the price is above the SMA, signaling a bullish market.
- This filter helps to avoid entering trades in a downtrend, thereby reducing the risk of holding positions in a declining market.
3. ATR (Average True Range):
- The ATR is used to measure market volatility and is instrumental in setting the Stop Loss.
- By multiplying the ATR value by a custom multiplier (default: 1.5), the strategy dynamically adjusts the Stop Loss level based on market volatility, allowing for flexibility in risk management.
How the Strategy Works:
Entry Signals:
The strategy opens long positions when RSI indicates that the market is oversold (below 30), and the price is above the 200-period SMA. This ensures that the strategy buys into potential market bottoms within the context of a long-term uptrend.
Take Profit Levels:
The strategy defines three distinct Take Profit (TP) levels:
TP 1: A 5% from the entry price.
TP 2: A 10% from the entry price.
TP 3: A 15% from the entry price.
As each TP level is reached, the strategy closes portions of the position to secure profits: 33% of the position is closed at TP 1, 66% at TP 2, and 100% at TP 3.
Visualizing Target Points:
The strategy provides visual feedback by plotting plotshapes at each Take Profit level (TP 1, TP 2, TP 3). This allows traders to easily see the target profit levels on the chart, making it easier to monitor and manage positions as they approach key profit-taking areas.
Stop Loss Mechanism:
The strategy uses a dual Stop Loss system to effectively manage risk:
ATR Trailing Stop: This dynamic Stop Loss adjusts based on the ATR value and trails the price as the position moves in the trader’s favor. If a price reversal occurs and the market begins to trend downward, the trailing stop closes the position, locking in gains or minimizing losses.
Basic Stop Loss: Additionally, a fixed Stop Loss is set at 25%, limiting potential losses. This basic Stop Loss serves as a safeguard, automatically closing the position if the price drops 25% from the entry point. This higher Stop Loss is designed specifically for low-leverage trading, allowing more room for market fluctuations without prematurely closing positions.
to determine the level of stop loss and target point I used a piece of code by RafaelZioni, here is the script from which a piece of code was taken
Together, these mechanisms ensure that the strategy dynamically manages risk while offering robust protection against significant losses in case of sharp market downturns.
The position size has been estimated by me at 75% of the total capital. For optimal capital allocation, a recommended value based on the Kelly Criterion, which is calculated to be 59.13% of the total capital per trade, can also be considered.
Enjoy !

InvoTrading - Swing High and Low with BreakoutInvoTrading - Swing High and Low with Breakout Strategy
This strategy is designed to identify trading opportunities based on swing highs and lows, combined with breakout confirmations. It utilizes pivot points to detect potential reversal levels and initiates trades when the price breaks out of these levels under specific conditions.
Key Features:
- Pivot Points: The strategy calculates pivot highs and lows using customizable left and right bars. These pivots represent potential swing points in the market.
- Breakout Detection: It monitors for breakouts above pivot highs (Bullish Break of Structure - BOS) and below pivot lows (Bearish Break of Structure).
- Strong Swings (Optional): You can enable "Strong Swing" detection, which considers only those pivots where the price attempted but failed to break the pivot level, indicating stronger support or resistance.
- Trade Management: The strategy sets entry points, stop losses, and take profits based on a customizable risk-reward ratio.
- Trade Table: An optional table displays recent trades, including their status (Pending, Success, or Failed).
- Visual Aids: Customizable colors and line settings help visualize pivot points, strong swings, and breakout candles on the chart.
---
Settings:
1. Pivot Settings:
- Left Bars: Number of bars to the left of the pivot point (default: 5).
- Right Bars: Number of bars to the right of the pivot point (default: 5).
- Pivot Based On: Choose between "High/Low" or "Close" prices for pivot calculations.
2. Color Settings:
- Pivot High Color: Color for Pivot High markers (default: Blue).
- Pivot Low Color: Color for Pivot Low markers (default: Red).
- Strong Swing High Color: Color for Strong Swing High markers (default: Black).
- Strong Swing Low Color: Color for Strong Swing Low markers (default: Black).
- Breakout Candle Color (BOS): Color for the breakout candle (default: Yellow).
3. Line Settings:
- Line Width: Width of the pivot lines (default: 1).
- Line Length (Bars): Length of the pivot lines in bars (default: 20).
- Maximum Number of Lines to Keep: Limits the number of pivot lines displayed to avoid clutter (default: 100).
4. Trade Settings:
- Enable Buy and Sell Signals: Activates trade entries and exits on the chart (default: False).
- Show Trades Table: Displays a table summarizing recent trades (default: False).
- Risk-Reward Ratio: Sets the desired risk-reward ratio for trades (default: 1.5).
- Number of Trades to Display: Maximum number of recent trades shown in the table (default: 5).
- Enable Strong Trade: Only triggers trades when a "Strong Swing" is detected (default: False).
---
How It Works:
- Pivot Detection: The script identifies pivot highs and lows based on the specified number of left and right bars.
- Strong Swings: If enabled, the strategy marks a pivot as a strong swing if the price attempts to break it but closes back within the pivot level.
- Breakout Confirmation:
- Long Entry: Occurs when the price closes above a pivot high, signaling a bullish breakout. If "Strong Trade" is enabled, it must be a strong swing high.
- Short Entry: Occurs when the price closes below a pivot low, signaling a bearish breakout. If "Strong Trade" is enabled, it must be a strong swing low.
- Trade Execution: Upon a valid breakout, the strategy places a trade with a stop loss set at the previous candle's low (for longs) or high (for shorts). The take profit is calculated based on the specified risk-reward ratio.
- Trade Monitoring: The strategy updates the status of each trade (Pending, Success, Failed) based on whether the take profit or stop loss is hit.
- Visualization: Breakout candles are highlighted, and pivot lines are drawn with customizable colors and widths. Strong swings are marked distinctly.
---
Usage Tips:
- Backtesting: Before using this strategy live, backtest it on different time frames and instruments to assess its performance.
- Customization: Adjust the pivot settings and risk-reward ratio to match your trading style and the volatility of the instrument you're trading.
- Risk Management: Always use proper risk management techniques, even though the strategy calculates stop losses and take profits.
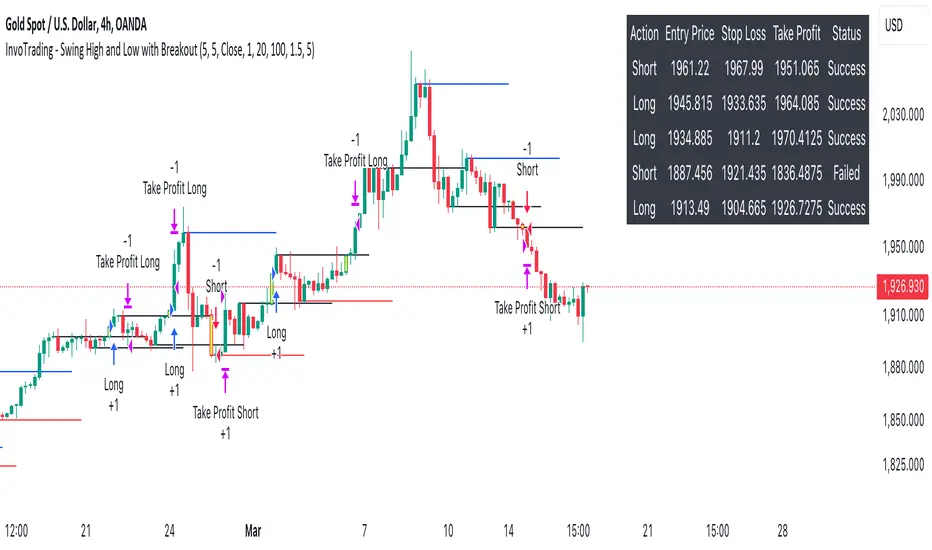
Multi-Step FlexiMA - Strategy [presentTrading]It's time to come back! hope I can not to be busy for a while.
█ Introduction and How It Is Different
The FlexiMA Variance Tracker is a unique trading strategy that calculates a series of deviations between the price (or another indicator source) and a variable-length moving average (MA). Unlike traditional strategies that use fixed-length moving averages, the length of the MA in this system varies within a defined range. The length changes dynamically based on a starting factor and an increment factor, creating a more adaptive approach to market conditions.
This strategy integrates Multi-Step Take Profit (TP) levels, allowing for partial exits at predefined price increments. It enables traders to secure profits at different stages of a trend, making it ideal for volatile markets where taking full profits at once might lead to missed opportunities if the trend continues.
BTCUSD 6hr Performance
█ Strategy, How It Works: Detailed Explanation
🔶 FlexiMA Concept
The FlexiMA (Flexible Moving Average) is at the heart of this strategy. Unlike traditional MA-based strategies where the MA length is fixed (e.g., a 50-period SMA), the FlexiMA varies its length with each iteration. This is done using a **starting factor** and an **increment factor**.
The formula for the moving average length at each iteration \(i\) is:
`MA_length_i = indicator_length * (starting_factor + i * increment_factor)`
Where:
- `indicator_length` is the user-defined base length.
- `starting_factor` is the initial multiplier of the base length.
- `increment_factor` increases the multiplier in each iteration.
Each iteration applies a **simple moving average** (SMA) to the chosen **indicator source** (e.g., HLC3) with a different length based on the above formula. The deviation between the current price and the moving average is then calculated as follows:
`deviation_i = price_current - MA_i`
These deviations are normalized using one of the following methods:
- **Max-Min normalization**:
`normalized_i = (deviation_i - min(deviations)) / range(deviations)`
- **Absolute Sum normalization**:
`normalized_i = deviation_i / sum(|deviation_i|)`
The **median** and **standard deviation (stdev)** of the normalized deviations are then calculated as follows:
`median = median(normalized deviations)`
For the standard deviation:
`stdev = sqrt((1/(N-1)) * sum((normalized_i - mean)^2))`
These values are plotted to provide a clear indication of how the price is deviating from its variable-length moving averages.
For more detail:
🔶 Multi-Step Take Profit
This strategy uses a multi-step take profit system, allowing for exits at different stages of a trade based on the percentage of price movement. Three take-profit levels are defined:
- Take Profit Level 1 (TP1): A small, quick profit level (e.g., 2%).
- Take Profit Level 2 (TP2): A medium-level profit target (e.g., 8%).
- Take Profit Level 3 (TP3): A larger, more ambitious target (e.g., 18%).
At each level, a corresponding percentage of the trade is exited:
- TP Percent 1: E.g., 30% of the position.
- TP Percent 2: E.g., 20% of the position.
- TP Percent 3: E.g., 15% of the position.
This approach ensures that profits are locked in progressively, reducing the risk of market reversals wiping out potential gains.
Local
🔶 Trade Entry and Exit Conditions
The entry and exit signals are determined by the interaction between the **SuperTrend Polyfactor Oscillator** and the **median** value of the normalized deviations:
- Long entry: The SuperTrend turns bearish, and the median value of the deviations is positive.
- Short entry: The SuperTrend turns bullish, and the median value is negative.
Similarly, trades are exited when the SuperTrend flips direction.
* The SuperTrend Toolkit is made by @EliCobra
█ Trade Direction
The strategy allows users to specify the desired trade direction:
- Long: Only long positions will be taken.
- Short: Only short positions will be taken.
- Both: Both long and short positions are allowed based on the conditions.
This flexibility allows the strategy to adapt to different market conditions and trading styles, whether you're looking to buy low and sell high, or sell high and buy low.
█ Usage
This strategy can be applied across various asset classes, including stocks, cryptocurrencies, and forex. The primary use case is to take advantage of market volatility by using a flexible moving average and multiple take-profit levels to capture profits incrementally as the market moves in your favor.
How to Use:
1. Configure the Inputs: Start by adjusting the **Indicator Length**, **Starting Factor**, and **Increment Factor** to suit your chosen asset. The defaults work well for most markets, but fine-tuning them can improve performance.
2. Set the Take Profit Levels: Adjust the three **TP levels** and their corresponding **percentages** based on your risk tolerance and the expected volatility of the market.
3. Monitor the Strategy: The SuperTrend and the FlexiMA variance tracker will provide entry and exit signals, automatically managing the positions and taking profits at the pre-set levels.
█ Default Settings
The default settings for the strategy are configured to provide a balanced approach that works across different market conditions:
Indicator Length (10):
This controls the base length for the moving average. A lower length makes the moving average more responsive to price changes, while a higher length smooths out fluctuations, making the strategy less sensitive to short-term price movements.
Starting Factor (1.0):
This determines the initial multiplier applied to the moving average length. A higher starting factor will increase the average length, making it slower to react to price changes.
Increment Factor (1.0):
This increases the moving average length in each iteration. A larger increment factor creates a wider range of moving average lengths, allowing the strategy to track both short-term and long-term trends simultaneously.
Normalization Method ('None'):
Three methods of normalization can be applied to the deviations:
- None: No normalization applied, using raw deviations.
- Max-Min: Normalizes based on the range between the maximum and minimum deviations.
- Absolute Sum: Normalizes based on the total sum of absolute deviations.
Take Profit Levels:
- TP1 (2%): A quick exit to capture small price movements.
- TP2 (8%): A medium-term profit target for stronger trends.
- TP3 (18%): A long-term target for strong price moves.
Take Profit Percentages:
- TP Percent 1 (30%): Exits 30% of the position at TP1.
- TP Percent 2 (20%): Exits 20% of the position at TP2.
- TP Percent 3 (15%): Exits 15% of the position at TP3.
Effect of Variables on Performance:
- Short Indicator Lengths: More responsive to price changes but prone to false signals.
- Higher Starting Factor: Slows down the response, useful for longer-term trend following.
- Higher Increment Factor: Widens the variability in moving average lengths, making the strategy adapt to both short-term and long-term price trends.
- Aggressive Take Profit Levels: Allows for quick profit-taking in volatile markets but may exit positions prematurely in strong trends.
The default configuration offers a moderate balance between short-term responsiveness and long-term trend capturing, suitable for most traders. However, users can adjust these variables to optimize performance based on market conditions and personal preferences.

ETH Signal 15m
This strategy uses the Supertrend indicator combined with RSI to generate buy and sell signals, with stop loss (SL) and take profit (TP) conditions based on ATR (Average True Range). Below is a detailed explanation of each part:
1. General Information BINANCE:ETHUSDT.P
Strategy Name: "ETH Signal 15m"
Designed for use on the 15-minute time frame for the ETH pair.
Default capital allocation is 15% of total equity for each trade.
2. Backtest Period
start_time and end_time: Define the start and end time of the backtest period.
start_time = 2024-08-01: Start date of the backtest.
end_time = 2054-01-01: End date of the backtest.
The strategy will only run when the current time falls within this specified range.
3. Supertrend Indicator
Supertrend is a trend-following indicator that provides buy or sell signals based on the direction of price changes.
factor = 2.76: The multiplier used in the Supertrend calculation (increasing this value makes the Supertrend less sensitive to price movements).
atrPeriod = 12: Number of periods used to calculate ATR.
Output:
direction: Determines the buy/sell direction based on Supertrend.
If direction decreases, it signals a buy (Long).
If direction increases, it signals a sell (Short).
4. RSI Indicator
RSI (Relative Strength Index) is a momentum indicator, often used to identify overbought or oversold conditions.
rsiLength = 12: Number of periods used to calculate RSI.
rsiOverbought = 70: RSI level considered overbought.
rsiOversold = 30: RSI level considered oversold.
5. Entry Conditions
Long Entry:
Supertrend gives a buy signal (ta.change(direction) < 0).
RSI must be below the overbought level (rsi < rsiOverbought).
Short Entry:
Supertrend gives a sell signal (ta.change(direction) > 0).
RSI must be above the oversold level (rsi > rsiOversold).
The strategy will only execute trades if the current time is within the backtest period (in_date_range).
6. Stop Loss (SL) and Take Profit (TP) Conditions
ATR (Average True Range) is used to calculate the distance for Stop Loss and Take Profit based on price volatility.
atr = ta.atr(atrPeriod): ATR is calculated using 12 periods.
Stop Loss and Take Profit are calculated as follows:
Long Trade:
Stop Loss: Set at close - 4 * atr (current price minus 4 times the ATR).
Take Profit: Set at close + 2 * atr (current price plus 2 times the ATR).
Short Trade:
Stop Loss: Set at close + 4 * atr (current price plus 4 times the ATR).
Take Profit: Set at close - 2.237 * atr (current price minus 2.237 times the ATR).
Summary:
This strategy enters a Long trade when the Supertrend indicates an upward trend and RSI is not in the overbought region. Conversely, a Short trade is entered when Supertrend signals a downtrend, and RSI is not oversold.
The trade is exited when the price reaches the Stop Loss or Take Profit levels, which are determined based on price volatility (ATR).
Disclaimer:
The content provided in this strategy is for informational and educational purposes only. It is not intended as financial, investment, or trading advice. Trading in cryptocurrency, stocks, or any financial markets involves significant risk, and you may lose more than your initial investment. Past performance is not indicative of future results, and no guarantee of profit can be made. You should consult with a professional financial advisor before making any investment decisions. The creator of this strategy is not responsible for any financial losses or damages incurred as a result of following this strategy. All trades are executed at your own risk.

HFT V.2 EnhancedTitle: HFT V.2 Enhanced - ATR Dynamic Stop-Loss & Take-Profit
Description:
The HFT V.2 Enhanced strategy is designed for high-frequency trading with dynamic trade management and robust entry/exit logic. This strategy uses simple moving averages (SMA) for trend identification and the relative strength index (RSI) for momentum confirmation. In this enhanced version, the strategy also incorporates dynamic stop-loss and take-profit levels based on the Average True Range (ATR), offering better adaptability to market volatility.
Features:
Moving Average Crossover: Uses a fast and slow SMA to capture trend reversals and generate trade entries.
RSI Confirmation: Ensures momentum is in the direction of the trade by incorporating the RSI threshold for both long and short entries.
Dynamic Stop-Loss and Take-Profit: Stop-loss and take-profit levels are calculated based on the ATR, allowing the strategy to adjust its exit points according to market volatility. This helps manage risk more effectively and capture larger trends.
Auto-Close Opposing Positions: Automatically closes any open long positions when a short entry is triggered, and vice versa.
Once-Per-Bar Execution: Ensures that a position is entered only once per bar, avoiding multiple trades within the same bar.
Parameters:
Fast MA Length: Defines the length of the fast-moving average.
Slow MA Length: Defines the length of the slow-moving average.
RSI Length: Sets the period for the RSI indicator.
RSI Threshold: Controls the RSI level for confirming momentum (50 by default).
ATR Length: Determines the period for the ATR calculation.
ATR Multiplier for Stop-Loss/Take-Profit: Adjusts the sensitivity of the stop-loss and take-profit levels based on ATR.
How it Works:
Long Entry: The strategy opens a long trade when the fast SMA crosses above the slow SMA, and the RSI is above the user-defined threshold. A dynamic stop-loss is placed below the entry price, and a take-profit target is set based on ATR.
Short Entry: The strategy opens a short trade when the fast SMA crosses below the slow SMA, and the RSI is below the inverse threshold. A stop-loss is placed above the entry price, and a take-profit target is set using ATR.
Risk Management: The strategy adapts to changing market conditions by dynamically adjusting its stop-loss and take-profit levels, ensuring it remains responsive to market volatility.
This script is ideal for traders looking for a high-frequency strategy with advanced trade management, including dynamic exits and volatility-based risk management.
Disclaimer: Always backtest and optimize the parameters to fit your trading style and risk tolerance before using the strategy in live trading.

Larry Conners SMTP StrategyThe Spent Market Trading Pattern is a strategy developed by Larry Connors, typically used for short-term mean reversion trading. This strategy takes advantage of the exhaustion in market momentum by entering trades when the market is perceived as "spent" after extended trends or extreme moves, expecting a short-term reversal. Connors uses indicators like RSI (Relative Strength Index) and price action patterns to identify these opportunities.
Key Elements of the Strategy:
Overbought/Oversold Conditions: The strategy looks for extreme overbought or oversold conditions, often indicated by low RSI values (below 30 for oversold and above 70 for overbought).
Mean Reversion: Connors believed that markets, especially in short-term scenarios, tend to revert to the mean after periods of strong momentum. The "spent" market is assumed to have expended its energy, making a reversal likely.
Entry Signals:
In an uptrend, a stock or market index making a significant number of consecutive up days (e.g., 5-7 consecutive days with higher closes) indicates overbought conditions.
In a downtrend, a similar number of consecutive down days indicates oversold conditions.
Reversal Anticipation: Once an extreme in price movement is identified (such as consecutive gains or losses), the strategy places trades anticipating a reversion to the mean, which is usually the 5-day or 10-day moving average.
Exit Points: Trades are exited when prices move back toward their mean or when the extreme conditions dissipate, usually based on RSI or moving average thresholds.
Why the Strategy Works:
Human Psychology: The strategy capitalizes on the fact that markets, in the short term, often behave irrationally due to the emotions of traders—fear and greed lead to overextended moves.
Mean Reversion Tendency: Financial markets often exhibit mean-reverting behavior, where prices temporarily deviate from their historical norms but eventually return. Short-term exhaustion after a strong rally or sell-off offers opportunities for quick profits.
Overextended Moves: Markets that rise or fall too quickly tend to become overextended, as buyers or sellers get exhausted, making reversals more probable. Connors’ approach identifies these moments when the market is "spent" and ripe for a reversal.
Risks of the Spent Market Trading Pattern Strategy:
Trend Continuation: One of the key risks is that the market may not revert as expected and instead continues in the same direction. In trending markets, mean-reversion strategies can suffer because strong trends can last longer than anticipated.
False Signals: The strategy relies heavily on technical indicators like RSI, which can produce false signals in volatile or choppy markets. There can be times when a market appears "spent" but continues in its current direction.
Market Timing: Mean reversion strategies often require precise market timing. If the entry or exit points are mistimed, it can lead to losses, especially in short-term trades where small price movements can significantly impact profitability.
High Transaction Costs: This strategy requires frequent trades, which can lead to higher transaction costs, especially in markets with wide bid-ask spreads or high commissions.
Conclusion:
Larry Connors’ Spent Market Trading Pattern strategy is built on the principle of mean reversion, leveraging the concept that markets tend to revert to a mean after extreme moves. While effective in certain conditions, such as range-bound markets, it carries risks—especially during strong trends—where price momentum may not reverse as quickly as expected.
For a more in-depth explanation, Larry Connors’ books such as "Short-Term Trading Strategies That Work" provide a comprehensive guide to this and other strategies .
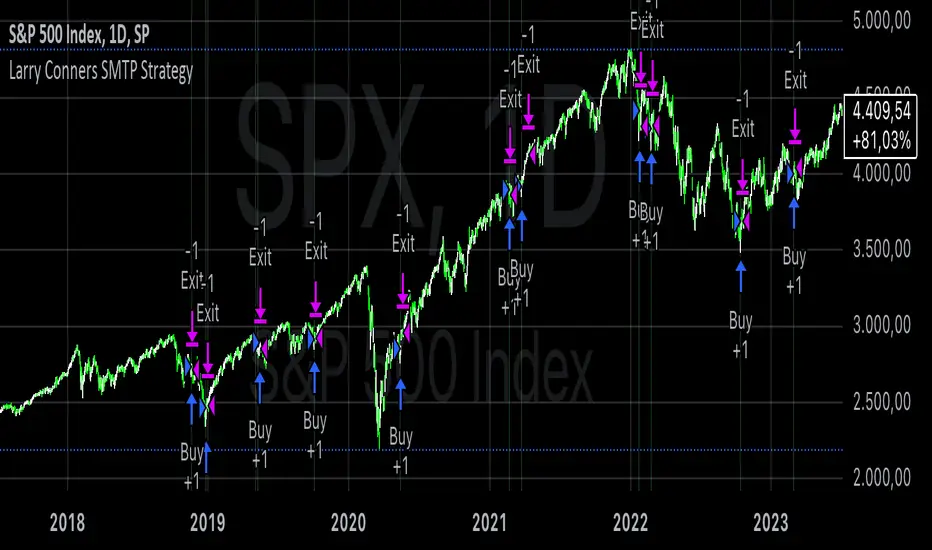
RSI Trend Following StrategyOverview
The RSI Trend Following Strategy utilizes Relative Strength Index (RSI) to enter the trade for the potential trend continuation. It uses Stochastic indicator to check is the price is not in overbought territory and the MACD to measure the current price momentum. Moreover, it uses the 200-period EMA to filter the counter trend trades with the higher probability. The strategy opens only long trades.
Unique Features
Dynamic stop-loss system: Instead of fixed stop-loss level strategy utilizes average true range (ATR) multiplied by user given number subtracted from the position entry price as a dynamic stop loss level.
Configurable Trading Periods: Users can tailor the strategy to specific market windows, adapting to different market conditions.
Two layers trade filtering system: Strategy utilizes MACD and Stochastic indicators measure the current momentum and overbought condition and use 200-period EMA to filter trades against major trend.
Trailing take profit level: After reaching the trailing profit activation level script activates the trailing of long trade using EMA. More information in methodology.
Wide opportunities for strategy optimization: Flexible strategy settings allows users to optimize the strategy entries and exits for chosen trading pair and time frame.
Methodology
The strategy opens long trade when the following price met the conditions:
RSI is above 50 level.
MACD line shall be above the signal line
Both lines of Stochastic shall be not higher than 80 (overbought territory)
Candle’s low shall be above the 200 period EMA
When long trade is executed, strategy set the stop-loss level at the price ATR multiplied by user-given value below the entry price. This level is recalculated on every next candle close, adjusting to the current market volatility.
At the same time strategy set up the trailing stop validation level. When the price crosses the level equals entry price plus ATR multiplied by user-given value script starts to trail the price with trailing EMA(by default = 20 period). If price closes below EMA long trade is closed. When the trailing starts, script prints the label “Trailing Activated”.
Strategy settings
In the inputs window user can setup the following strategy settings:
ATR Stop Loss (by default = 1.75)
ATR Trailing Profit Activation Level (by default = 2.25)
MACD Fast Length (by default = 12, period of averaging fast MACD line)
MACD Fast Length (by default = 26, period of averaging slow MACD line)
MACD Signal Smoothing (by default = 9, period of smoothing MACD signal line)
Oscillator MA Type (by default = EMA, available options: SMA, EMA)
Signal Line MA Type (by default = EMA, available options: SMA, EMA)
RSI Length (by default = 14, period for RSI calculation)
Trailing EMA Length (by default = 20, period for EMA, which shall be broken close the trade after trailing profit activation)
Justification of Methodology
This trading strategy is designed to leverage a combination of technical indicators—Relative Strength Index (RSI), Moving Average Convergence Divergence (MACD), Stochastic Oscillator, and the 200-period Exponential Moving Average (EMA)—to determine optimal entry points for long trades. Additionally, the strategy uses the Average True Range (ATR) for dynamic risk management to adapt to varying market conditions. Let's look in details for which purpose each indicator is used for and why it is used in this combination.
Relative Strength Index (RSI) is a momentum indicator used in technical analysis to measure the speed and change of price movements in a financial market. It helps traders identify whether an asset is potentially overbought (overvalued) or oversold (undervalued), which can indicate a potential reversal or continuation of the current trend.
How RSI Works? RSI tracks the strength of recent price changes. It compares the average gains and losses over a specific period (usually 14 periods) to assess the momentum of an asset. Average gain is the average of all positive price changes over the chosen period. It reflects how much the price has typically increased during upward movements. Average loss is the average of all negative price changes over the same period. It reflects how much the price has typically decreased during downward movements.
RSI calculates these average gains and losses and compares them to create a value between 0 and 100. If the RSI value is above 70, the asset is generally considered overbought, meaning it might be due for a price correction or reversal downward. Conversely, if the RSI value is below 30, the asset is considered oversold, suggesting it could be poised for an upward reversal or recovery. RSI is a useful tool for traders to determine market conditions and make informed decisions about entering or exiting trades based on the perceived strength or weakness of an asset's price movements.
This strategy uses RSI as a short-term trend approximation. If RSI crosses over 50 it means that there is a high probability of short-term trend change from downtrend to uptrend. Therefore RSI above 50 is our first trend filter to look for a long position.
The MACD (Moving Average Convergence Divergence) is a popular momentum and trend-following indicator used in technical analysis. It helps traders identify changes in the strength, direction, momentum, and duration of a trend in an asset's price.
The MACD consists of three components:
MACD Line: This is the difference between a short-term Exponential Moving Average (EMA) and a long-term EMA, typically calculated as: MACD Line = 12 period EMA − 26 period EMA
Signal Line: This is a 9-period EMA of the MACD Line, which helps to identify buy or sell signals. When the MACD Line crosses above the Signal Line, it can be a bullish signal (suggesting a buy); when it crosses below, it can be a bearish signal (suggesting a sell).
Histogram: The histogram shows the difference between the MACD Line and the Signal Line, visually representing the momentum of the trend. Positive histogram values indicate increasing bullish momentum, while negative values indicate increasing bearish momentum.
This strategy uses MACD as a second short-term trend filter. When MACD line crossed over the signal line there is a high probability that uptrend has been started. Therefore MACD line above signal line is our additional short-term trend filter. In conjunction with RSI it decreases probability of following false trend change signals.
The Stochastic Indicator is a momentum oscillator that compares a security's closing price to its price range over a specific period. It's used to identify overbought and oversold conditions. The indicator ranges from 0 to 100, with readings above 80 indicating overbought conditions and readings below 20 indicating oversold conditions.
It consists of two lines:
%K: The main line, calculated using the formula (CurrentClose−LowestLow)/(HighestHigh−LowestLow)×100 . Highest and lowest price taken for 14 periods.
%D: A smoothed moving average of %K, often used as a signal line.
This strategy uses stochastic to define the overbought conditions. The logic here is the following: we want to avoid long trades in the overbought territory, because when indicator reaches it there is a high probability that the potential move is gonna be restricted.
The 200-period EMA is a widely recognized indicator for identifying the long-term trend direction. The strategy only trades in the direction of this primary trend to increase the probability of successful trades. For instance, when the price is above the 200 EMA, only long trades are considered, aligning with the overarching trend direction.
Therefore, strategy uses combination of RSI and MACD to increase the probability that price now is in short-term uptrend, Stochastic helps to avoid the trades in the overbought (>80) territory. To increase the probability of opening long trades in the direction of a main trend and avoid local bounces we use 200 period EMA.
ATR is used to adjust the strategy risk management to the current market volatility. If volatility is low, we don’t need the large stop loss to understand the there is a high probability that we made a mistake opening the trade. User can setup the settings ATR Stop Loss and ATR Trailing Profit Activation Level to realize his own risk to reward preferences, but the unique feature of a strategy is that after reaching trailing profit activation level strategy is trying to follow the trend until it is likely to be finished instead of using fixed risk management settings. It allows sometimes to be involved in the large movements.
Backtest Results
Operating window: Date range of backtests is 2023.01.01 - 2024.08.01. It is chosen to let the strategy to close all opened positions.
Commission and Slippage: Includes a standard Binance commission of 0.1% and accounts for possible slippage over 5 ticks.
Initial capital: 10000 USDT
Percent of capital used in every trade: 30%
Maximum Single Position Loss: -3.94%
Maximum Single Profit: +15.78%
Net Profit: +1359.21 USDT (+13.59%)
Total Trades: 111 (36.04% win rate)
Profit Factor: 1.413
Maximum Accumulated Loss: 625.02 USDT (-5.85%)
Average Profit per Trade: 12.25 USDT (+0.40%)
Average Trade Duration: 40 hours
These results are obtained with realistic parameters representing trading conditions observed at major exchanges such as Binance and with realistic trading portfolio usage parameters.
How to Use
Add the script to favorites for easy access.
Apply to the desired timeframe and chart (optimal performance observed on 2h BTC/USDT).
Configure settings using the dropdown choice list in the built-in menu.
Set up alerts to automate strategy positions through web hook with the text: {{strategy.order.alert_message}}
Disclaimer:
Educational and informational tool reflecting Skyrex commitment to informed trading. Past performance does not guarantee future results. Test strategies in a simulated environment before live implementation
