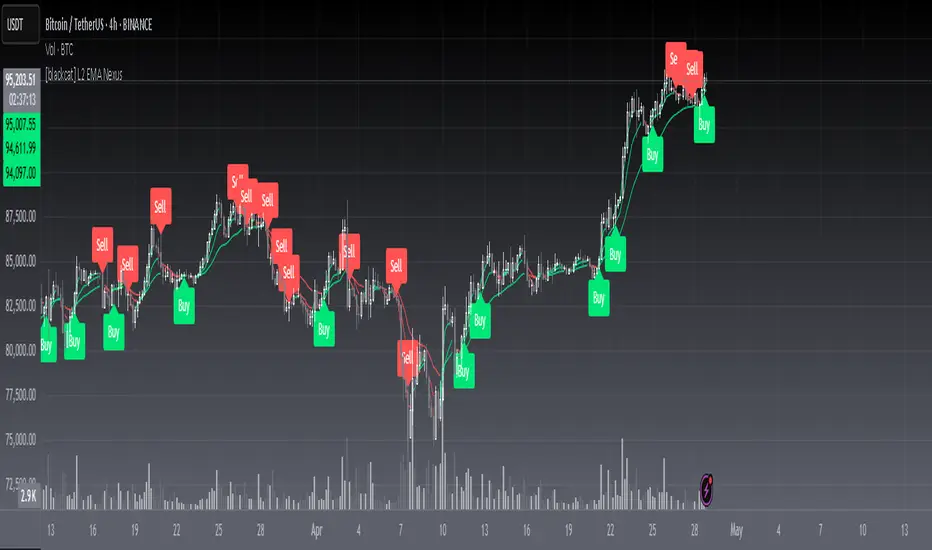
Trade Manager (Open Source Version)Hello my young padawans looking for the FORCE to get richer on your next trade
I got pinged at least three times today asking where the hell is the indicator of the day. You asked, I delivered :)
Here's your free open-source Trade Manager Version. My associates might kill me for sharing that one... anyway this is a real GIFT.
I won't share such quality indicators too often for FREE so hope you'll appreciate its value. It can really help with your day to day trading (on top of making your charts looking more awesome)
This is an even better version compared to my previous Trade Manager Trade-Manager . It's basically a standalone version, meaning you'll have to update with 2 lines your own indicator and follow my educational post from yesterday (pasted it below also) to learn how to do it
Please read this educational post I published for you before proceeding further : How-to-connect-your-indicator-with-the-Trade-Manager
From here you normally connected the data source of your own indicator to the Trade Manager. If not, here's a reminder of the article mentionned above
Step 1 - Update your indicator
For the screenshot you see above, I used this indicator : Two-MM-Cross-MACD/ . "But sir are you really advertising your other indicators here ??" ... hmmm.... YES but I gave them for free so ... stop complaining my friend :)
Somewhere in the code you'll have a LONG and a SHORT condition. If not, please go back to study trading for noobs (I'm kidding !!!)
So it should look to something similar
nUP = ma_crossover and macd_crossover
nDN = ma_crossunder and macd_crossunder
What you will need to add at the very end of your script is a Signal plot that will be captured by the Trade Manager. This will give us :
// Signal plot to be used as external
// if crossover, sends 1, otherwise sends -1
Signal = (nUP) ? 1 : (nDN) ? -1 : na
plot(Signal, title="Signal")
The Trade Manager engines expects to receive 1 for a bullishg signal and -1 for bearish .
Step 2 - Add the Trade Manager to your chart and select the right Data Source
I feel the questions coming so I prefer to anticipate :) When you add the Trade Manager to your chart, nothing will be displayed. THIS IS NORMAL because you'll have to select the Data Source to be "Signal"
Remember our Signal variable from the Two MM Cross from before, now we'll capture it and.....drumb rolll...... that's from that moment that your life became even more AWESOME
The Engine will capture the last signal from the MM cross or any indicator actually and will update the Stop Loss, Take Profit levels based on the parameters you set on the Trade Manager
It should work with any indicator as long as you're providing a plot Signal with values 1 and -1 . In any case, you can change the Trade Manager you'll find a better logic for your trading
Now let's cover the different parameters of the tool
It should be straightforward but better to explain everything here
+Label lines : if unchecked, no SL/TPs/... will be displayed
+Show Stop Loss Signal : Will display the stop loss label. You have the choice between three options :
By default, the Stop Loss is set to NONE. You'll have to select a different option to enable the Stop Loss for real
++Percentage : Will set the SL at a percent distance from the price
++Fixed : SL fixed at a static price
++Trailing % : Trailing stop loss based on percentage level
The following is a KEY feature and I got asked for it many times those past two days. I got annoyed of getting the same request so I just did it
++Trailing TP: Will move the Stop Loss if the take profit levels are hit
Example: if TP1 is hit, SL will be moved to breakeven. If TP2 is hit, SL will be moved from TP1 to TP2
+Take Profit 1,2,3 : Visually define the three Take Profit levels. Those are percentage levels .
Meaning if you set TP1 = 2, it will set the TP1 level 2% away from the entry signal
Please note that once a Take profit level is reached, it will magically disappear. This is to be expected
I'll share in the future a way more complete version with invalidation, stop loss/take profits based on indicator, take profit based on supports/resistances, ...
I believe is such a great tool because can be connected to any indicator. I confess that I tried it only with a few... if you find any that's not working with the Trade manager, please let me know and I'll have a look
PS
I want to give a HUUUUUUUGE shoutout to the PineCoders community who helped me finishing it
Wishing you all the best and a pleasant experience with my work
David
Cari dalam skrip untuk "profit"
WhiplashClimax setup looking for a reversal the next day after a gap, this works best if the signal is triggered after a prolonged move in one direction. Enter the position at the close of the day when you get a signal and exit for a loss the next day if not profitable, otherwise, trail a stop to lock profits.
Kozlod - Simple BB Strategy - XBTUSD - 1 minuteReally nice performance for simple BB on XBTUSD Bitmex 1 minute chart.
BB length = 55, BB mult = 4.
No SL or PT used.
Amazingly performance for the last week, 92% profitable. Tested on entire May percent profitable become 80%, still not bad.
And remember:
Past performance does not guarantee future results.
Peak Valley Estimation StrategyIntroduction
Its the first strategy that i post here, so don't expect ground breaking stuff, when testing my indicators i always used prorealtime and not tradingview. This strategy use signals generated by the peak/valley estimator indicator i posted long ago, i think the signals generated where sometimes quite accurate in some markets thus providing potential material for a profitable strategy.
The indicator use 3 parameters, therefore the optimisation process is not easy, but i selected what i judged good parameters values at first glance. The strategy is in its more simple form without stop or anything, the detection of peaks and valley can allow for tighter stops since we expect the price to reverse, but take into account that sops and take profits are parameters subject to optimization process except if selected with strict money management rules and not profit optimization.
Of course trading the strategy in this form is far from being great, if we take into account the market non stationarity then we might expect loss during trending markets. Trend strength indicators could help switch from a reversal to breakout strategy thus maybe providing more control.
I really hope you find an use for the strategy.
Notes
Its been three long years since i started tradingview, and i put more efforts in my indicators than in my studies and life overall, this have created complicated situations and i can't afford to follow up with this, therefore i announce that in the end of june i will leave tradingview for quite a long time, at least until i have my degree. I announce it in advance in case some of you want helps of any kind. I will post all the indicators, both in progress and finished i have made during those three years. I hope you can all understand.
Thanks for reading !
PivotBoss TriggersI have collected the four PivotBoss indicators into one big indicator. Eventually I will delete the individual ones, since you can just turn off the ones you don't need in the style controller. Cheers.
Wick Reversal
When the market has been trending lower then suddenly forms a reversal wick candlestick , the likelihood of
a reversal increases since buyers have finally begun to overwhelm the sellers. Selling pressure rules the decline,
but responsive buyers entered the market due to perceived undervaluation. For the reversal wick to open near the
high of the candle, sell off sharply intra-bar, and then rally back toward the open of the candle is bullish , as it
signifies that the bears no longer have control since they were not able to extend the decline of the candle, or the
trend. Instead, the bulls were able to rally price from the lows of the candle and close the bar near the top of its
range, which is bullish - at least for one bar, which hadn't been the case during the bearish trend.
Essentially, when a reversal wick forms at the extreme of a trend, the market is telling you that the trend
either has stalled or is on the verge of a reversal. Remember, the market auctions higher in search of sellers, and
lower in search of buyers. When the market over-extends itself in search of market participants, it will find itself
out of value, which means responsive market participants will look to enter the market to push price back toward
an area of perceived value. This will help price find a value area for two-sided trade to take place. When the
market finds itself too far out of value, responsive market participants will sometimes enter the market with
force, which aggressively pushes price in the opposite direction, essentially forming reversal wick candlesticks .
This pattern is perhaps the most telling and common reversal setup, but requires steadfast confirmation in order
to capitalize on its power. Understanding the psychology behind these formations and learning to identify them
quickly will allow you to enter positions well ahead of the crowd, especially if you've spotted these patterns at
potentially overvalued or undervalued areas.
Fade (Extreme) Reversal
The extreme reversal setup is a clever pattern that capitalizes on the ongoing psychological patterns of
investors, traders, and institutions. Basically, the setup looks for an extreme pattern of selling pressure and then
looks to fade this behavior to capture a bullish move higher (reverse for shorts). In essence, this setup is visually
pointing out oversold and overbought scenarios that forces responsive buyers and sellers to come out of the dark
and put their money to work-price has been over-extended and must be pushed back toward a fair area of value
so two-sided trade can take place.
This setup works because many normal investors, or casual traders, head for the exits once their trade
begins to move sharply against them. When this happens, price becomes extremely overbought or oversold,
creating value for responsive buyers and sellers. Therefore, savvy professionals will see that price is above or
below value and will seize the opportunity. When the scared money is selling, the smart money begins to buy, and
Vice versa.
Look at it this way, when the market sells off sharply in one giant candlestick , traders that were short
during the drop begin to cover their profitable positions by buying. Likewise, the traders that were on the
sidelines during the sell-off now see value in lower prices and begin to buy, thus doubling up on the buying
pressure. This helps to spark a sharp v-bottom reversal that pushes price in the opposite direction back toward
fair value.
Engulfing (Outside) Reversal
The power behind this pattern lies in the psychology behind the traders involved in this setup. If you have
ever participated in a breakout at support or resistance only to have the market reverse sharply against you, then
you are familiar with the market dynamics of this setup. What exactly is going on at these levels? To understand
this concept is to understand the outside reversal pattern. Basically, market participants are testing the waters
above resistance or below support to make sure there is no new business to be done at these levels. When no
initiative buyers or sellers participate in range extension, responsive participants have all the information they
need to reverse price back toward a new area of perceived value.
As you look at a bullish outside reversal pattern, you will notice that the current bar's low is lower than the
prior bar's low. Essentially, the market is testing the waters below recently established lows to see if a downside
follow-through will occur. When no additional selling pressure enters the market, the result is a flood of buying
pressure that causes a springboard effect, thereby shooting price above the prior bar's highs and creating the
beginning of a bullish advance.
If you recall the child on the trampoline for a moment, you'll realize that the child had to force the bounce
mat down before he could spring into the air. Also, remember Jennifer the cake baker? She initially pushed price
to $20 per cake, which sent a flood of orders into her shop. The flood of buying pressure eventually sent the price
of her cakes to $35 apiece. Basically, price had to test the $20 level before it could rise to $35.
Let's analyze the outside reversal setup in a different light for a moment. One of the reasons I like this setup
is because the two-bar pattern reduces into the wick reversal setup, which we covered earlier in the chapter. If
you are not familiar with candlestick reduction, the idea is simple. You are taking the price data over two or more
candlesticks and combining them to create a single candlestick . Therefore, you will be taking the open, high, low,
and close prices of the bars in question to create a single composite candlestick .
Doji Reversal
The doji candlestick is the epitome of indecision. The pattern illustrates a virtual stalemate between buyers
and sellers, which means the existing trend may be on the verge of a reversal. If buyers have been controlling a
bullish advance over a period of time, you will typically see full-bodied candlesticks that personify the bullish
nature of the move. However, if a doji candlestick suddenly appears, the indication is that buyers are suddenly
not as confident in upside price potential as they once were. This is clearly a point of indecision, as buyers are no
longer pushing price to higher valuation, and have allowed sellers to battle them to a draw-at least for this one
candlestick . This leads to profit taking, as buyers begin to sell their profitable long positions, which is heightened
by responsive sellers entering the market due to perceived overvaluation. This "double whammy" of selling
pressure essentially pushes price lower, as responsive sellers take control of the market and push price back
toward fair value.
Inside Bar FailureYou can check edge profitability by adjusting the forward looking input, eg. how profitable is this signal after X bars.
DARVAS BOX MTFMULTIPLE TIME FRAME VERSION OF DARVAS BOX:
You can view different time frame values of Darvas Box levels on any chart
What Is the Darvas Box?
The Darvas Box strategy was developed by Nicholas Darvas. Aside from being a well known dancer, he began trading stock in the 1950s. Based on his success in trading, he was approached to write a book on his strategy. The book, “How I Made $2,000,000 in the Stock Market,” outlines his rather simple approach … simple once you understand the basic concepts and rationale of the strategy.
Darvas Box is an indicator that simply draws lines along highs and lows, and then adjusts them as new highs and lows form. The indicator is available on many trading platforms, such as Thinkorswim. Traders may wish to draw their own boxes though, based on recent highs and lows; Darvas was able to do so (based on telegram quotes) more than half a century ago.
Darvas Box Rules
I shall not follow advisory services.
I shall be cautious of broker advice.
I shall ignore Wall Street sayings or truisms, no matter how ancient or revered.
I shall only trade stocks on major exchanges with adequate volume .
I shall not listen to (or trade off of) rumors or tips, no matter how well researched they may sound.
I will use a sound strategy instead of gamble…I must study this strategy (originally this approach was fundamental analysis , which didn’t work for him, so he developed his Darvas Box trading method).
I will hold one position for longer, as opposed to juggling a bunch of positions for a short period of time.
Darvas looked for increasing volume when selecting stocks to trade; this alerted him to stocks that were being accumulated and were likely to see strong trends.
Darvas believed in buying stocks that presented an upper box limit breakout, but also had an upward Earnings trend. This was especially the case when the major indexes had experienced a decline.
When an upper box limit is broken, buy. From his book, the entry price was usually about 1 to 2% above the upper box limit.
If you enter a trade and the price proceeds to drop out of the new box, and back into the old box, exit the trade.
Entry and stop loss orders should be set in advance, so trades aren’t missed and risk is controlled.
Place, and trail the stop loss order to below the low of the most recent box. This initial stop loss was pretty tight, because Darvas assumed when a price broke out of an old box, it was entering a new box. Therefore, the stop was placed just below the high of old box which was just broken (low of new box).
Record trades, including reasons why you entered and exited.
General conditions of the market must favor buying. Don’t buy stocks when the major indexes are in a bear market, or when volume is flat or declining.
If you are stopped out, but the price moves back into the higher box again providing another buy signal, buy again, using the same stop loss location.
Since the stop is being trailed up, more funds can be added on each consecutive breakout.
The Bottom Line
Nicholas Darvas was a dancer, but committed a great deal of time to developing and then mastering his stock trading method. It’s a trend following method based on breakouts to higher boxes. Risk is controlled by placing a stop below new higher boxes as they form. During choppy conditions the strategy won’t be profitable. This is why Darvas also attempted to only trade stocks with increasing volume and rising Earnings . Trading his method requires a lot of discipline, but can produce big profits when strong trends develop.
source: traderhq.com
Creator: Nicholas DARVAS
Here's the link to a complete list of all my indicators:
tr.tradingview.com
Şimdiye kadar paylaştığım indikatörlerin tam listesi için: tr.tradingview.com
Bollinger Bands %bb (normalised) & RSIIndicator for displaying both Bollinger Bands %bb (normalised) and RSI simultaneously (Usual 0 - 1 range of BB normalised to the 30 - 70 range of RSI).
When both Bollinger Bands %bb and RSI are OB/OS then the column will turn blue and a buy/sell arrow will appear in the indicator provided other conditions pertaining to the OB/OS condition in one of the last two candles are also met.
I use this mainly for Cryptocurrencies for shorter time periods to indicate possible trade opportunities.
You could also set an alert on the arrow indicator appearing to auto trade.
DARVAS BOX by KIVANÇ fr3762What Is the Darvas Box?
The Darvas Box strategy was developed by Nicholas Darvas. Aside from being a well known dancer, he began trading stock in the 1950s. Based on his success in trading, he was approached to write a book on his strategy. The book, “How I Made $2,000,000 in the Stock Market,” outlines his rather simple approach … simple once you understand the basic concepts and rationale of the strategy.
Darvas Box is an indicator that simply draws lines along highs and lows, and then adjusts them as new highs and lows form. The indicator is available on many trading platforms, such as Thinkorswim. Traders may wish to draw their own boxes though, based on recent highs and lows; Darvas was able to do so (based on telegram quotes) more than half a century ago.
Darvas Box Rules
I shall not follow advisory services.
I shall be cautious of broker advice.
I shall ignore Wall Street sayings or truisms, no matter how ancient or revered.
I shall only trade stocks on major exchanges with adequate volume .
I shall not listen to (or trade off of) rumors or tips, no matter how well researched they may sound.
I will use a sound strategy instead of gamble…I must study this strategy (originally this approach was fundamental analysis , which didn’t work for him, so he developed his Darvas Box trading method).
I will hold one position for longer, as opposed to juggling a bunch of positions for a short period of time.
Darvas looked for increasing volume when selecting stocks to trade; this alerted him to stocks that were being accumulated and were likely to see strong trends.
Darvas believed in buying stocks that presented an upper box limit breakout, but also had an upward Earnings trend. This was especially the case when the major indexes had experienced a decline.
When an upper box limit is broken, buy. From his book, the entry price was usually about 1 to 2% above the upper box limit.
If you enter a trade and the price proceeds to drop out of the new box, and back into the old box, exit the trade.
Entry and stop loss orders should be set in advance, so trades aren’t missed and risk is controlled.
Place, and trail the stop loss order to below the low of the most recent box. This initial stop loss was pretty tight, because Darvas assumed when a price broke out of an old box, it was entering a new box. Therefore, the stop was placed just below the high of old box which was just broken (low of new box).
Record trades, including reasons why you entered and exited.
General conditions of the market must favor buying. Don’t buy stocks when the major indexes are in a bear market, or when volume is flat or declining.
If you are stopped out, but the price moves back into the higher box again providing another buy signal, buy again, using the same stop loss location.
Since the stop is being trailed up, more funds can be added on each consecutive breakout.
The Bottom Line
Nicholas Darvas was a dancer, but committed a great deal of time to developing and then mastering his stock trading method. It’s a trend following method based on breakouts to higher boxes. Risk is controlled by placing a stop below new higher boxes as they form. During choppy conditions the strategy won’t be profitable. This is why Darvas also attempted to only trade stocks with increasing volume and rising Earnings . Trading his method requires a lot of discipline, but can produce big profits when strong trends develop.
source: traderhq.com
Creator: Nicholas DARVAS
PT MACD function with Multiframe ( incl. Histogram )I updated the name thus needing to release it again and also the precisions is now on default what we need it.
- The green area is where Proft Trailer will try to buy
- Updated colors for both white / black canvas
- Script is open for you to read
PT Feeder - Market Trends Top 10 / BTC Moves Becasue nobody was kind enough to post some PT Feeder scripts and i knew i could just modify my trends / btc script that i originally created for PT Magic. Well i just did it.
What is this script for ? PT Feeder it allows you to better imagine what kind of values you should be expecting when setting the Market Trends and BTC moves.
Green are top 10 Markets:
"MaxTopCoinLongTermAverageChange": "-3"
"MinBaseCoinPriceChange": "3",
Blue is BTC:
"MinBaseCoinLongTermPriceChange": "-3"
"MaxBaseCoinPriceChange": "3",
Why only 10 markets well becasue tradingview is very limited but it is still better than nothing.
If you like agree and follow !
PT Magic - Market Trends Top 10 ( More is not possible )- Unfortunately more than top 10 trends is not possible sorry
- Some of the colors overlap i will try to fix it soon
PT Magic - BTC/ETH Trigger Trend ChangesThis Script shows you how BTC/ETH Percentage change in trends affect coins you trade.
- For ETH market please change BTC in Setting for ETH
What you need it PT Magic:
{
"Name": "BTC1h", // UNIQUE market trend name (to be referenced by your triggers below)
"Platform": "CoinMarketCap", // Platform to grab prices from (Allowed values are: CoinMarketCap, Exchange)
"MaxMarkets": 1, // Number of markets/pairs to analyze sorted by 24h volume
"TrendMinutes": 60 // Number of minutes to build a trend (1440 = 24h, 720 = 12h, 60 = 1h)
},
{
"Name": "ETH1h", // UNIQUE market trend name (to be referenced by your triggers below)
"Platform": "CoinMarketCap", // Platform to grab prices from (Allowed values are: CoinMarketCap, Exchange)
"MaxMarkets": 2, // Number of markets/pairs to analyze sorted by 24h volume
"IgnoredMarkets": "BTC",
"TrendMinutes": 60 // Number of minutes to build a trend (1440 = 24h, 720 = 12h, 60 = 1h)
},
PT MACD markedPT MACD indicator - marked green
- If you want to better see the values change the precision to the highest number.
Noro's Hundred Strategy v1.0Strategy uses:
1) Fast RSI (period = 7 bars)
2) Color of bars
Strategy
If RSI less than 30 is also 4 red candles in a row - to open long-position
If RSI more than 70 is also 4 green candles in a row - to open short-position
If long-position is open and there is 1 green candle - to close a position
If short-position is open and there is 1 red candle - to close a position
Only profit
Very dangerous thing! Strategy will close a position only if a position profitable. Most likely you will lose all money if you use this function.
Noro's Trend MAs Strategy v1.8Trade strategy which uses only 2 MA.
The slow MA (blue) is used for definition of a trend
The fast MA (red) is used for an entrance to the transaction
For:
- For H1
- For crypto/fiat or crypto/crypto
- Good for "BTC/USD", "ETH/USD", "ETH/BTC"
Recomended:
Long = true (if it is profitable as a result of backtests)
Short = true (if it is profitable as a result of backtests)
Stops = false
Stop, % = any
OHLC4 = any
Use Fast MA = true
Fast MA Period = 5
Slow MA Period = 21
Bars Q = (2 for "bitcoin/fiat" or 1 for "crypto/fiat" or 0 for "crypto/crypto")
In the new version 1.8
- The second PriceChannel is added
- Profit became more
- Losses became less
- The unnecessary types of MA are removed
Noro's Trend MAs Strategy v1.6Trade strategy which uses only 2 MA.
The slow MA (blue) is used for definition of a trend
The fast MA (red) is used for an entrance to the transaction
For:
- For H1
- For crypto/fiat
Recomended:
Long = true (if it is profitable as a result of backtests)
Short = true (if it is profitable as a result of backtests)
Type of slow MA = 7 (only for Crypto/Fiat)
Source of slow MA = close or OHLC4
Use Fast MA = true
Fast MA Period = 5
Slow MA Period = 20
Bars Q = (2 for "BitCoin/Fiat" or 1 for "Fork/Fiat")
In the new version 1.5
+ Profit became more
+ Losses became less
+ Alerts
+ Background (lime = uptrend, red = downtrend)
Types of slow MA:
1 = SMA = Simple Moving Average
2 = EMA = Exponential Moving Average
3 = VWMA = Volume-Weighted Moving Average
4 = DEMA = Double Exponential Moving Average
5 = TEMA = Triple Exponential Moving Average
6 = KAMA = Kaufman's Adaptive Moving Average
7 = Price Channel
Best SuperTrend BTCUSDMulti Chart view supported
//Best profits for $BTCUSD examples:
//res=165 view=30m fastPeriod=17 slowPeriod=9 profit %67.14 since 2017-08-14
//res=100 view=30m fastPeriod=16 slowPeriod=30 profit %57 since 2017-08-14
// If you want get access for super Trend with the best and optimazed values for:
//LTCUSD profit +%120
//ETHUSD profit +%80
//OMGUSD profit +%115
//BCHUSD profit +%80
//LTCUSD profit +%125
//XRP,DASH comming soon, these profits include trading fee %0.2
//
// Fee for access 0.005BTC or less per week
// Contact me by chat for a demo
BTCUSD
Free Strategy #08 (Combo of #01 and #02) (ES / SPY)This strategy was designed to be traded on daily data on the ES and SPY—the strategy was originally developed for NinjaTrader, which displays daily ES data based on RTH hours instead of 24 hours (1440 minute) like TradingView does, so we are presenting the results on the SPY until we figure out how to overcome this hurdle.
The strategy combines the two ideas from strategy #01 and strategy #02 .
Strategy #08
Quantity 100
Slippage: 2 ticks
Commission: 4.95 per order
Net Profit: 26,044.60
Max Drawdown: 3,947.60
Buy and Hold (Custom)
Quantity 100
Slippage: 2 ticks
Commission: 4.95 per order
Entry Long: 1993-02-01 @ 43.99
Exit Long: 2017-07-28 @ 246.34
Net Profit: 20,225.10
Max Drawdown: 9,042.00
Free Strategy #02 (ES / SPY)This strategy was designed to be traded on daily data on the ES and SPY—the strategy was originally developed for NinjaTrader, which displays daily ES data based on RTH hours instead of 24 hours (1440 minute) like TradingView does, so we are presenting the results on the SPY until we figure out how to overcome this hurdle.
Strategy #02
Quantity 100
Slippage: 2 ticks
Commission: 4.95 per order
Net Profit: 10,118.30
Max Drawdown: 4.037.60
Buy and Hold (Custom)
Quantity 100
Slippage: 2 ticks
Commission: 4.95 per order
Entry Long: 1993-02-01 @ 43.99
Exit Long: 2017-07-28 @ 246.34
Net Profit: 20,225.10
Max Drawdown: 9,042.00
CCI Level Zero Strategy (by Marcoweb) v1.0Hi guys,
My strategy is ready :)
Finally the zero level of the CCI gives the start and stop to my positions. As you could notice, setting up the CCI length to 340 area on 1 minute chart will let the profit factor go up to 20% from an already wonderful 16%. This is a great result cause will let profitable trades run while stopping the wrong ones with a very limited loss. What makes our profit are not several small little positions that are clearly unrepitable in real trade but few and very profitable positions in which jumping in will be easier due to their length (71 bars average).
Please share with me your impressions and suggestions.
Have a nice trade :)