Forex Fractal EMA ScalperThis is a forex scalper designed for very short timeframes 1-5 min max.
At the same time due to the short timeframe, is recommend to re optimize it weekly .
Its components are
Fractals
Triple EMA with different lengths
Rules for entry:
For long : we have an up fractal and all 3 ema are in ascending order
For short: we have a down fractal and all 3 ema are in descending order.
Rules for exit
We exit when we either get a reverse order or when we hit the take profit or stop loss calculated in fixed pips.
Cari dalam skrip untuk "profit"

Parabolic SAR + Take Profit and Stop Loss By Nussara (strategy)Back test strategy for "Parabolic SAR + Take Profit and Stop Loss By Nussara" make it easy setting a strategy to estimate profits and losses.
This strategy uses Parabolic SAR . The Parabolic SAR is a technical indicator developed by J. Welles Wilder to determine the direction that an asset is moving. The indicator is also referred to as a stop and reverse system, which is abbreviated as SAR . It aims to identify potential reversals in the price movement of traded assets.
This indicator has a function to take profit and stop loss level.
Stop loss level = First reverse point of uptrend
Take profit level = Entry price + (Entry price-Stop loss level)
User can set a parabolic SARS and a profit point but I fixed stop loss level at first reversals point of uptrend. I also put alert for Buy, Sell, Stop Loss in this indicator.
This indicator is just a tool for technical analysis . It shouldn't be used as the only indication of trade because it causes you to lose your money. You should use other indicators to analyze together.

Trend Catcher BotTrend analysis strategy with entry filters such as MACD and Tilson T3. It will look at possible entry points and it can use MACD or TilsonT3 filters to decide whether or not enter in a new trade.
Notes:
- Results include a 0.075% Fee.
- Simulated leverage of 5x.
- Initial Capital of $1000.
- Uses a max order size of $200k per trade (Leverage included).
- Stop loss of 1.15%.
- The stop loss is moved to 0.4% Profit once the Trade reaches 1.15% profit.
- All settings adjustable.
- Non Repainting.

TSI CCI Hull with profit$$$This is a modified version of @SeaSide420 TSI CCI Hull with profits exit on long and short order
ORIGINAL SCRIPT:
/// /// feel free to edit/improve and comment

PS3X Strategy TesterPS3X Strategy Tester is a completely new strategy built from the ground up as a successor to previous 1.0 and 2.0 versions of Profit Sniper.
Offering up huge improvements, including multiple position triggers, derived from Bollinger Bands and Chande Momentum as well as our own bespoke stochastic ribbons that provide trend pivots.
So how does it work?
PS3X Strategy Tester allows you to tailor your preference for waiting for either Stochastic Ribbon cross only, Ribbon Cross followed by Chande Confirmation, or Ribbon Cross followed by rising/falling MACD for additional market structure confidence.
Strategy exits can be configured to exit on % change of MACD histogram indicating a direction change, and additionally using our revolutionary "Profit Lockin" to provide a stepped lock in of profits according to your preferred risk strategy. Commision of 0.05% has been added to represent "limit in-market out" trading, but please tailor this again to your preferred trading approach.
If you would like access, please send me a PM.


SMA Cross strategyThis is a simple strategy which is always profitable and trades better than most premium channels and I give it out for free :)
Working very good on ETHUSDT futures on binance :)

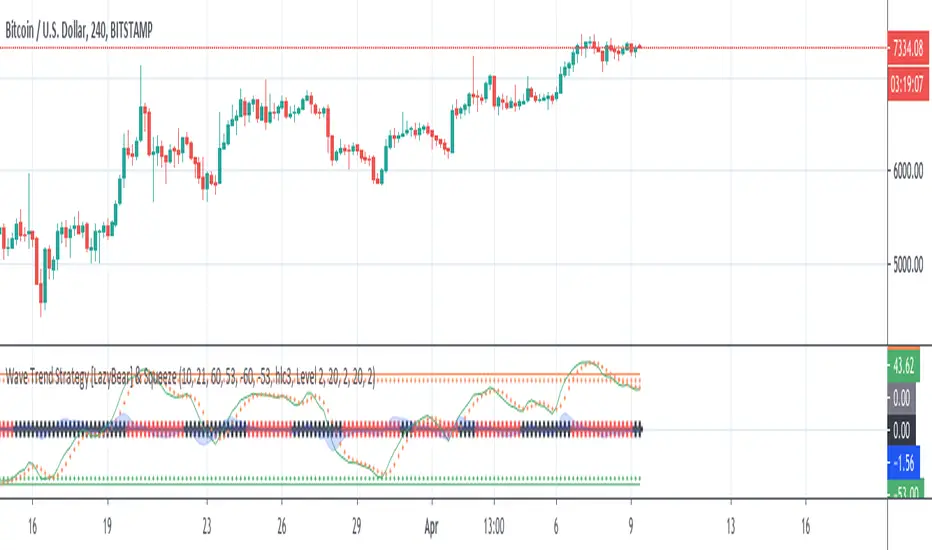
Wave Trend Strategy [LazyBear] & SqueezeThis strategy is a port of famous script Wave Trend Oscillator with a plus: squeeze indicator (LazyBear).
@author LazyBear
Original study from LazyBear
Scope of this port is to identify corrects inputs to get best results from signals that indicator gives.
The squeeze gives a further filter before orders and avoid to enter in a flat market period.
I attached it to chart with heikin ashi candles to have a better result and remove noise: results are good.
Please use comment section for any feedback.
Next improvement (only to whom is interested to this script and follows me): study with alerts on multiple tickers all at one. Leave a comment if you want to have access to study.
********************************** IMPORTANT*******************************
I have developed an expert advisor for metatrader4 (MT4): results of expert advisor form 2015-01-01 to 2018-11-25 are very good with low drawdown and good profit.
********************************************************************************
[astropark] Super RSI [strategy]Dear Followers,
today a new Scalper Tool , which works great on 3 minutes and 5 minutes timeframes , but also down to 1m and up to 30m!
I called it " Super RSI ", as it is based on RSI and inherits some basic functionality from it.
If you check its settings, you will see that you can have 3 different buy-sell sources (first two are active by default):
STRONG BUY/SELL : buy when white area deeply falls into oversold-red zone and sell when white area gets into overbought-green zone (you can set and edit at which level oversold and overbought zones start);
CROSSES : buy when the black RSI line in the middle between red and green area cross under the buy cross limit value and sell when it crosso over the sell cross limit value (you can set and edit specific cross ranges for both buy and sell);
WEAK BUY/SELL : buy when green area at least go below 50 level and sell when red area at least goes above 50 level (you can edit both levels); these conditions are highlighted as background color and are very useful for taking (at least partial) profits in trades.
By default the script will be placed as oscillator on a specific pane below the chart, but
> you can disable the oscillator plot by enabling the "hide all plot" option
> and place it as overlay on chart by clicking on the black arrow at then end on the indicator name in chart and selecting "move to -> existing pane above"
This strategy can trigger till 10 buy or 10 sell signals in a row before reverting, so use a proper money management .
Strategy results are calculated on 20 trading days using 1000$ as initial capital and working at 10x leverage.
The user who wants to use this strategy, especially via an automated bot, must always set a stoploss at 3-5% from entry point or use a proper risk management strategy .
This is not the "Holy Grail", so use it with caution.
This script will let you backtest the strategy and find best settings for your preferred market.
The alarms script version of this indicator, which will let you set all notifications you may need in order to be alerted on each triggered signals, can be found by searching for " Super RSI".
This is a premium indicator , so send me a private message in order to get access to this script .

Long Short Double strategyLong Short Double strategy
Long short strategy with stoploss and take profit.
I use this script for 5min btcusd on Bitmex. (The strategy also works on other exchanges, with some small adjustments in RSI)
Leverage 10x 375% profit in 2 weeks. NO REPAINT.
U can Adjust the RSI for long and shorts entry`s.
Study is Autoview ready. send me a PM for Paid access.
If you like this strategy buy me a Pizza, Dinner, or lambo:)
BITCOIN: 3BMEXTEMinsUUqUwr9GEjNA6ZBsVXB1g6u
LITECOIN: LdG82pyEMMji9Bynw3hvWgUshbMKfiFdJw

Direction Power StrategyThis strategy is based on the very well known ADX indicator, some risk management was applied, TP, SLand the most vital, trail stop.
If you have any questions let me know!
Ah, ps. It works better on longer timeframes, tried it also on shorter timeframes but becomes less profitable

Scalping Grid at Pivot Point FibonacciThis strategy sets a grid of stop orders once price touch one Fibonacci weekly pivots.
This works very well for scalping as the price touch a pivot level.
Take care when you work with grids because drawdown could be very high.
Study with alarms is available at request.
Please use comment section for any feedback.
Next improvement (only to whom is interested to this script and follows me): study with alerts on multiple tickers all at one. Leave a comment if you want to have access to study.
********************************** IMPORTANT*******************************
I have developed an expert advisor for metatrader4 (MT4) and for jforex platform: results of expert advisor form 2015-01-01 to 2018-11-25 are very good with low drawdown and good profit.
********************************************************************************

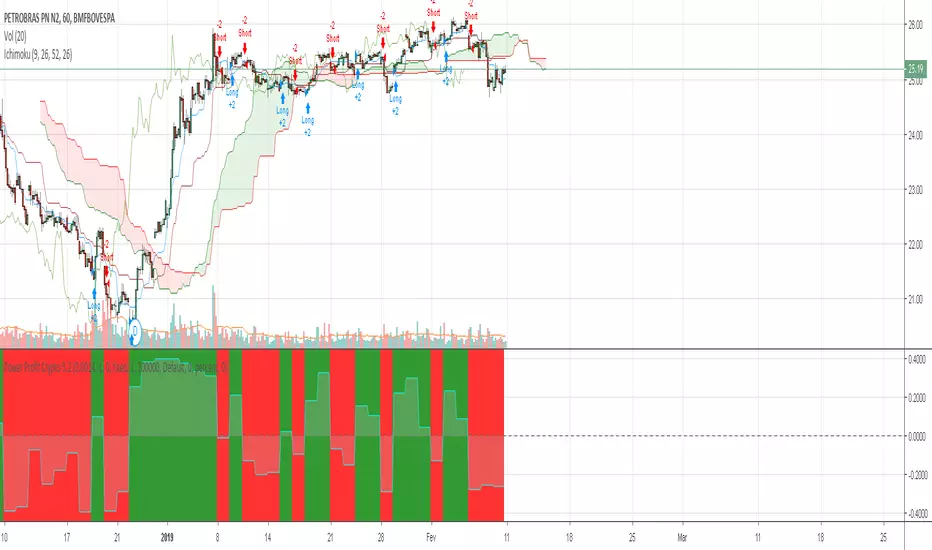
Power Profit Crypto 5.2Contact me if you wanna test and buy my indicator! 70% wins! - NOW GOOD TO USE ALSO WITH BTC! . - LTC - ETH - NEO - XMR - ZEC - ETC -
PRICE?? End of this page !!
-------------------------------------------------------------------------------------------------------------------------------ENGLISH ---------------------------------------------------------------------------------------------------------------------------------------------------------
After 2 years working on the codes, excluding weak indicators for Cryptos, and investing in programming and trade knowledge in the Crypto market .... HE is READY!
Its is possible earn money, even in down markets!!!!!!!!!!!!!!
Power Profit Crypto 2019 is a UNIQUE indicator and incomparably more profitable than the others. Do you know why? It was not designed for wallstreet, it was carefully planned for the great Crypto and Forex volatility , and of that very peculiar market. He is the FIRST INDICATOR DEDICATED ONLY FOR CRYPTOS and Forex
It is only being sold today, due to having passed all TradingView.com tests. With a minimum 70% hit, this indicator will change your life in this market, and avoid what happens with many people: Lose lots of money and give up investing in the best variable market on the planet.
Work better in 1hr charter or higher charter times. (2hr , 4hr)
Please contact me! That way you can test for-24hrs! Then you can put it on the backtest of TradingView.com to prove its effectiveness!
WHATSAPP +55 71 98644-1234
$$$$$ Price : WAS 800 usd ..... for this week just 300 usd ( Pay with BTC LTC - ETH - NEO - XMR - ZEC - ETC
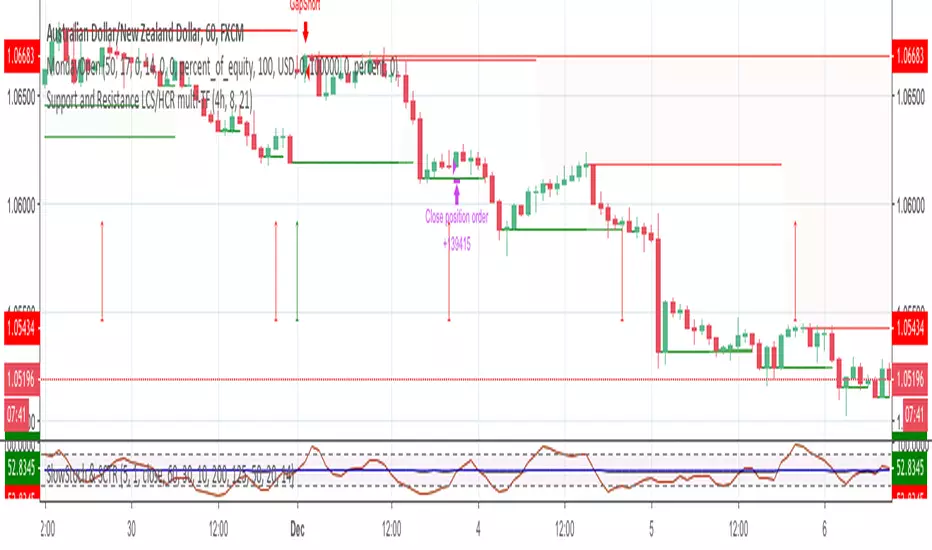
MondayOpen Gap strategyThis strategy open orders on first bar of the week if there is a gap with Friday close price.
First bar could be on Sunday or on Monday, it depends on broker time.
Adjust starting hour with broker time. Use arrows to help finding correct broker time.
Also you should adjust gap size and exit hour.
Do not place on Daily charts.
Please use comment section for any feedback.
Next improvement (only to whom is interested to this script and follows me): study with alerts on multiple tickers all at one. Leave a comment if you want to have access to study.
********************************** IMPORTANT*******************************
I have developed an expert advisor for metatrader4 (MT4) and for jforex platform: results of expert advisor form 2015-01-01 to 2018-11-25 are very good with low drawdown and good profit.
********************************************************************************
Bitcoin Trading Algo, 30,500% profit long + short. Beats HODLingREAD DISCRIPTION FIRST
Trading view have taken off the Invite Only options for scripts from free accounts and since I usually only like people I know using my scripts I have programmed my own password and Keycode system within pine script, the Keycode changes every month and is determined by a random number algorithm so you will need to know both the password and the keycode for the script to wok for you.
The objective for this strategy was to reduce the standard divination of bitcoin returns through risk management, this is done with both long and short trades. It looks to get on board when a trend is detected and adds to the position to average out all entry points. When the momentum begins to decelerate all trades are closed. 50% of these trades will usually be in profit and 50% will usually be a loss, however profits are 3x larger than losses.
To demonstrate that the deviation of retuns of the strategy is lower than hodling, I leaveraged the strategy to a similar drawdown level to hodling so that you can compare the two.
When risk adjusted, my strategy beats buy and hold returns by about 600%, although I am personally trading the strategy unleaveraged.
BTC Precognition - Mtrl_ScientistHello Everyone,
I have been interested in algorithmic trading for a while now, and have picked up coding in Python/C++ 2 years ago, which made it possible for me to understand Pine Script (Trading View's proprietary language) fairly easily. I got interested in Bitcoin in 2013, but have only started actually investing in mid 2017. Making money during a bull run is easy but it's really the bear market that teaches you a lesson. So I went about and tried to avoid losses in future bear markets by digging into the analysis of financial time series. I looked around and found useful books, examples of pine script code, technical analyses from fellow chartists and sought out to combine it all into algorithms that can help prevent losses during the next bear market.
I came up with several profitable scripts, but let this be the first one I'm actually sharing with you guys. It draws data from all major Bitcoin exchanges (Hence this script will ONLY work for BTCUSD ) and is based on CVI, Fractal Adaptive Moving Avergage ( FRAMA ), and some calculus operations to make sense of their relationship.
I tried to tidy the final version up as much as possible, so that it becomes straightforward to use. All you need to look at is when the bar becomes green/red, the bar height is just the integrated area since it's crossed the 0-line and can serve as a threshold on lower time frames to avoid noise.
I've got a degree in Chemistry, so don't take this as financial advice, but please do let me know what you think!
Note:
- This is a re-upload because the first version got pulled due to linking to Twitter
- Script works best with Hekin Ashi candles
Planned features:
- Reduce amount of signals on lower time frames
- Make it work better with normal candles
Suggestions?

Traders Profit Str.High-profitable strategy, but use at your own risk.
Strategy uses wma, macd, BB, ma, and so on.

{CDT} v1.0 - Opal Signal - 1D H/A TunedHighly profitable script, decent on all timeframes but designed specifically for Heiken candles on 1D timeframe.
No repaint.
7 day free trials available on request.
----------------------------------------------
*Use at your own risk & DYOR.

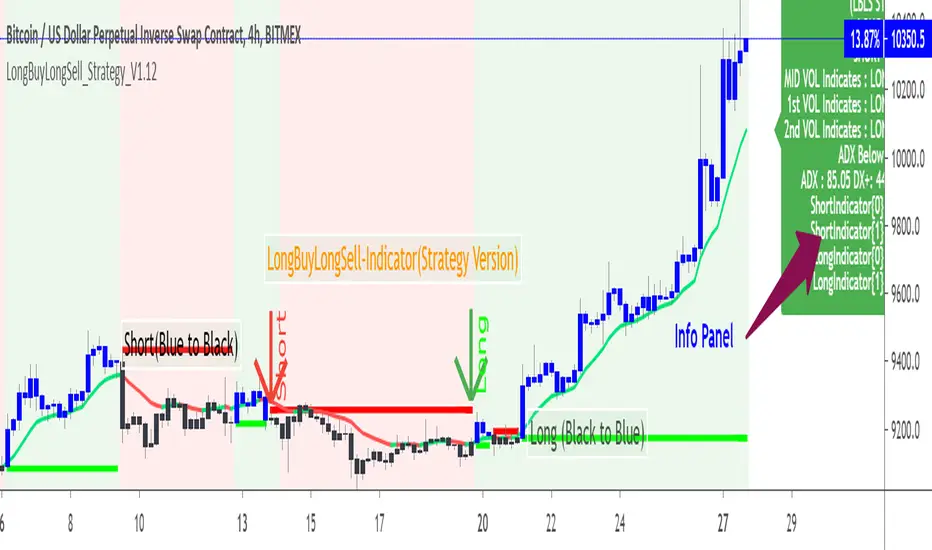
LongBuyLongSell 90% profit Excellent Win Rate Strategy indicatorI seldom prefer the strategy version ,As you have requested to share the backtest results sharing the details here for your info only. to check how the "LongBuyLongsell" indicator is working.
BTCUSD 30min time frame used ,Tested with Forex ,Equity results are >80% when right entry is predicted.
This is, published to show only the test results of the original "LongBuyLongSell" indicator that was published in tradingview initially on 27Jun.
The test scripts are only available to do testing by me and it is keycode protected,Here sharing the results of BTCUSD of 30min time frame with the improved logic in "longbuylongsell" indicator version.
This script cannot be used for generating Alerts realtime as tradingview does not support user "Alerts" in strategy scripts . So please get access for "longbuylongsell" indicator.
Information are shared to show the accuracy of this LongBuyLongsell Indicator.
No indicator will work 100% in all time ;Win rate will be 80% ; Just sharing this as a result here and as a performance report of LongBuyLongsell Indicator script available in Tradingview.
Again,This is shared only for info ,not to be used. If you wish to use the indicator check and get the access for the working "longbuylongsell" indicator version 1 and Version 2 and not to this.
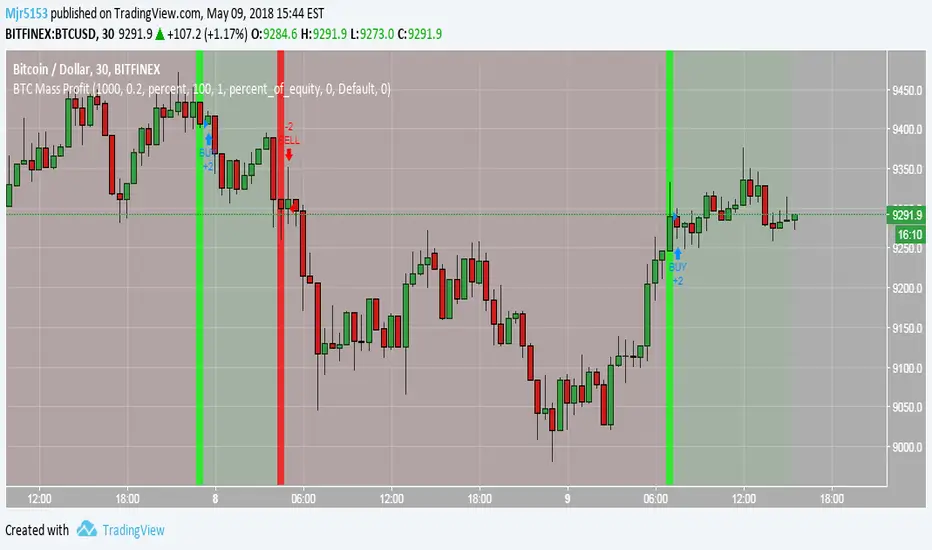
BTC Massive ProfitThis script is meant to be used on BTC while viewing the 30m chart. This script has generated MASSIVE profits. Greatest BTC script on the market
Camelback ScalpingThis is a port of Camelback scalping strategy (google it for more info).
It looks profitable in tradingview.
I'm testing it also with MT4 and next step will be jforex testing.
If you are interested in ex4 file for metatrader let me know through comment section.
Thanks for your feedbaks.
PS: note that this strategy works well at higher time frames too.


RSI with small Take Profit - Long-onlyThis script open a long position when RSI < 30 and close the position after a small take profit. No stop loss but if you analyse List of Trades then you'll see that several position are closed for unknow reason.
