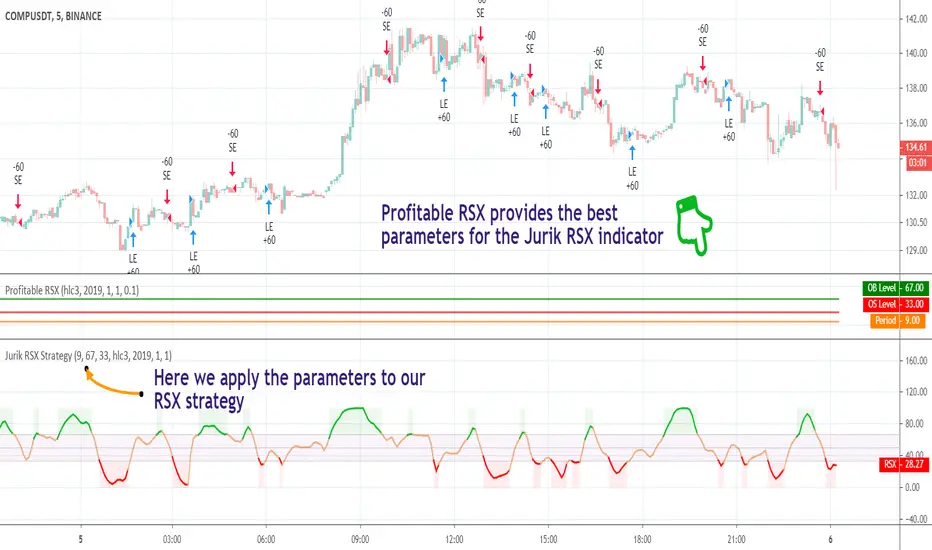
Profitable Jurik RSXIntroduction
As you know the Jurik RSX is a "noise free" smoothed version of RSI (Relative Strength Index), with no added lag.
It was originally developed by Mark Jurik and is used the same way as RSI. To learn more about this indicator see www.jurikres.com
The most basic and common strategy is to use the crossovers between Jurik RSX and its overbought/oversold levels as trade signals:
when RSX crosses above 30, go Long
when RSX crosses below 70, go Short
exit when a crossover occurs in the opposite direction
What is this tool?
This tool is a performance scanner that uses a decision tree-based algorithm under the hood to find the most profitable settings for Jurik RSX. It analyzes the range of periods between 2 to 100 and backtests the Jurik RSX for each period (using the strategy mentioned above) across the entire history of an instrument. If the more profitable parameter was found, the indicator will switch its value to the found one immediately.
So, instead of manually selecting parameters just apply it to your chart and relax - the algorithm will do it for you, everywhere you want.
The algorithm can work in two modes: Basic and Early Switch. The Early Switch algorithm makes some assumptions and activates a set of optimizations to find a better setting DURING the trades, not after they were actually closed.
The difference is illustrated on the screenshot below
But two modes can show identical values depending on timeframe
Additionally you can set up a backtest window through indicator's settings (the optimizers which were published before will get this feature soon).
Alerts
It has a special alert that notifies when a more profitable period was detected.
NOTE: It does not change what has already been plotted.
NOTE 2: This is not a strategy, but an algorithmic optimizer.
Cari dalam skrip untuk "profitable"
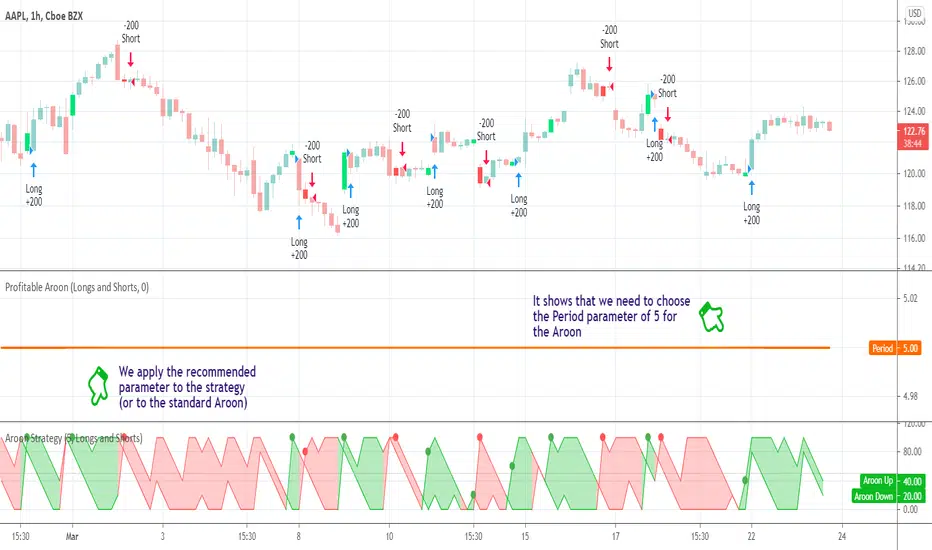
Profitable AroonIntroduction
The Aroon indicator was developed by well-known technical analyst Tushar Chande in 1995 and is used to identify trend changes in the price of an asset, as well as the strength of that trend. The fact that he named the indicator "Aroon" which is Sanskrit for "Dawn’s Early Light" demonstrates his belief in his indicator's trend discovery capabilities.
It is composed of two lines, Aroon Up and Aroon Down .
The most basic strategy is to use the crossovers as trade signals:
when Aroon Up crosses above Aroon Down , go Long
when Aroon Down crosses above Aroon Up , go Short
Exit when a crossover occurs in the opposite direction
What is this tool?
This tool is a performance scanner that uses a decision tree-based algorithm under the hood to find the most profitable period setting for the Aroon. It analyzes the range of periods between 2 to 100 and backtests the Aroon indicator for each period using the strategy mentioned above across the entire history of an instrument. If a more profitable parameter was found, the indicator will switch its value to the found one immediately.
Alerts
It has an alert that notifies when a more profitable period was found.
NOTE : It does not change what has already been plotted.
Good luck and Happy Trading!
Profitable Loser Model [MMT]Profitable Loser Model
Overview
The Profitable Loser Model is a powerful PineScript v6 indicator designed to enhance your trading by visualizing key price levels, session open zones, Fibonacci retracements, and premium/discount zones. This overlay indicator provides traders with a customizable toolkit to analyze market structure across any timeframe, making it ideal for intraday and swing trading strategies.
Features
Open Zone Visualization
- Plots a box based on the open and close of the first candle in a user-defined timeframe (default: 5-minute).
- Customizable box color, projection offset, and label size (Tiny, Small, Normal, Large).
- Displays a timeframe label (e.g., "5m Open Zone") for quick reference, toggleable on/off.
Session Open Lines
- Optionally draws horizontal lines at key session opens (8:30 AM, 9:30 AM, 1:30 PM, Midnight, New York time).
- Customize line color, style (Solid, Dashed, Dotted), width, and label size for each session.
- Perfect for identifying critical intraday price levels.
Premium and Discount Zones
- Highlights premium (above midpoint) and discount (below midpoint) zones based on session high/low.
- Toggleable with customizable colors and projection offsets.
- Helps traders spot overbought/oversold areas for potential mean-reversion trades.
Fibonacci Retracement Levels
- Plots user-defined Fibonacci levels (default: 0.23, 0.35, 0.5, 0.62, 0.705, 0.79, 0.886, 1, 1.1).
- Customizable line style, width, color, and labels (showing percentage and/or price).
- Dynamically adjusts based on price movement relative to the open zone.
Take Profit (TP) and Stop Loss (SL) Levels
- Highlights TP (default: 0.23) and SL (default: 1.1) Fibonacci levels with distinct colors.
- Fully customizable to align with your risk-reward strategy.
How It Works
- Session Detection : Resets daily (or per user-defined timeframe) to capture the first candle's open, high, low, and close.
- Open Zone : Draws a box between the open and close, extended forward by the projection offset.
- Session Lines : Plots lines at specified session opens with customizable styles and labels.
- Fibonacci Retracement : Adjusts levels dynamically based on session high/low and price action.
- Premium/Discount Zones : Calculated from the session range midpoint, updated in real-time.
Settings
- Open Zone :
- Timeframe (default: 5m), Calculate Timeframe (default: Daily).
- Toggle label, adjust size, box color, and projection offset.
- Session Open Lines :
- Enable/disable lines for 8:30 AM, 9:30 AM, 1:30 PM, Midnight.
- Customize color, style, width, label size, and vertical offset.
- Premium/Discount Zones :
- Toggle visibility, set colors, and adjust projection offset.
- Fibonacci Retracement :
- Toggle visibility, set custom levels, line style, width, color, and label options.
- Adjust projection offset.
- TP/SL :
- Set TP/SL Fibonacci levels and colors.
Use Cases
- Intraday Trading : Use session open lines and open zones to trade key market hours.
- Swing Trading : Leverage Fibonacci levels for potential reversal or continuation zones.
- Risk Management : Set precise TP/SL levels based on Fibonacci retracements.
- Market Structure : Identify overbought/oversold zones with premium/discount areas.
Notes
- Optimized with `dynamic_requests = true` for efficient real-time data handling.
- Visual elements (boxes, lines, labels) are cleaned up at the start of each new session.
- Session lines use New York time (`America/New_York`) for alignment with major markets.

Profitable SuperTrendHello friends,
This script is a powerful, non-repainting optimizer for the classic SuperTrend indicator — one of the most popular tools for trend-following and volatility-based trading. It automatically finds and applies the most profitable SuperTrend settings for each instrument and timeframe, removing the need for manual parameter tuning or guesswork.
🛠 How It Works
The indicator evaluates over 1,400 combinations of ATR Periods and Multipliers using a decision tree–based optimization algorithm .
Each configuration is backtested across the instrument's full history, and when a more profitable setup is identified, the indicator automatically switches to those values in real time — while preserving the standard SuperTrend logic.
It also supports commission customization for more realistic backtesting and includes an alert system that notifies you whenever a better parameter set is found.
This adaptive approach keeps the SuperTrend continuously tuned to evolving market conditions without repainting or distorting past data.
💡 Integrated Versions Explained
This all-in-one tool merges 3 complementary indicators:
• Profitable SuperTrend — A dedicated optimizer that runs in a separate window below your chart. It doesn’t produce buy/sell signals directly but analyzes your asset and timeframe to find optimal ATR settings. Results are visualized as two lines (purple and orange), with optional labels displaying the best parameter values. You can then manually apply these values to your standard SuperTrend.
• Self-Adjusting SuperTrend — A real-time overlay version that behaves like the standard SuperTrend but dynamically adjusts its parameters on the fly. It requires no manual setup and can be paired with the Profitable SuperTrend for full transparency over which values are currently active.
• Compact Self-Adjusting SuperTrend — A minimalist oscillator version that uses simple binary outputs: -1 for Sell and 1 for Buy. This format is ideal for filtering or integrating the adaptive logic into other trading systems.
Together, they form a complete adaptive suite that combines automation, flexibility, and precision — suitable for both discretionary and systematic traders.
🔥 Key Features
Adaptive optimization powered by a decision tree–based algorithm
Real-time switching to the most profitable SuperTrend parameters
Commission customization for realistic backtesting
Direction filter (Longs | Shorts | Longs & Shorts)
Optional analysis start date for focused historical testing
Smart alert when better settings are detected
Optional buy/sell labels and compact trend output
Clean and organized UI with improved workflow
If you'd like access or have any questions, feel free to reach out to me directly via DM.
👋 Good luck and happy trading!
Skrip berbayar

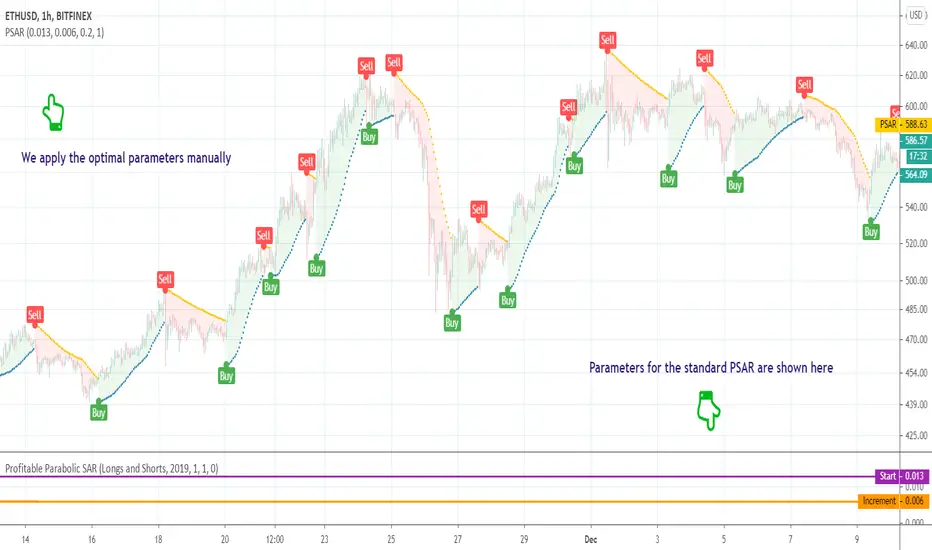
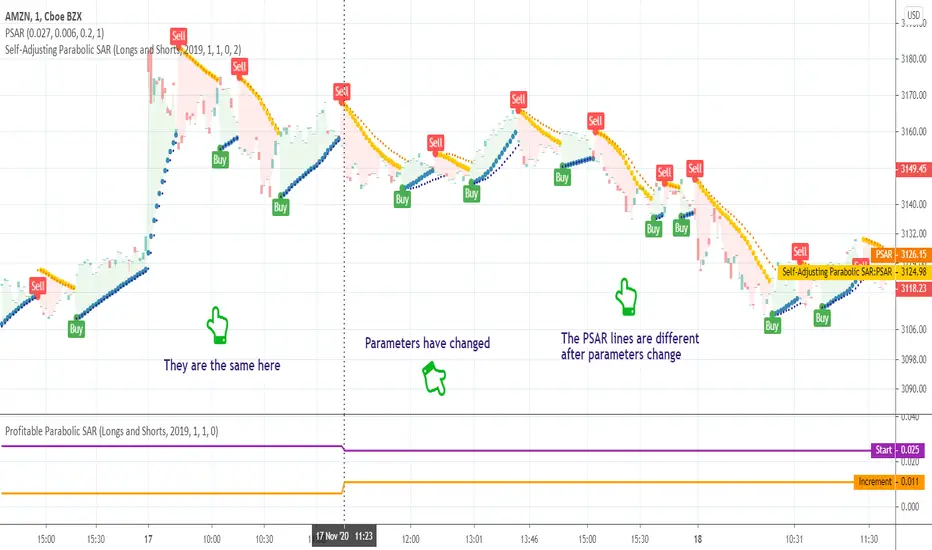
Profitable Parabolic SARHello friends,
This script is a powerful, non-repainting optimizer for the classic Parabolic Stop and Reverse (PSAR) — one of J. Welles Wilder's most respected trend-following systems. It automatically finds and applies the most profitable PSAR settings for each instrument and timeframe, eliminating the need for manual parameter tuning.
🛠 How It Works
The indicator evaluates over 500 combinations of PSAR parameters using a decision tree–based algorithm under the hood .
Each configuration is backtested across the instrument's full price history, and when a more profitable setup is identified, the indicator seamlessly switches to those values in real time — while maintaining the original PSAR logic.
The Maximum parameter remains fixed since its impact on overall profitability is minimal compared to Start and Increment.
This self-adjusting approach removes the guesswork of parameter optimization and keeps the PSAR dynamically tuned to changing market regimes.
💡 Integrated Versions Explained
This all-in-one tool merges 3 complementary indicators:
• Profitable PSAR — A parameter optimizer that runs in a separate window below your main chart. It doesn't generate buy/sell signals directly but analyzes your specific asset and timeframe to find optimal settings. These are displayed as two lines (purple and orange), with optional labels showing the actual parameter values. Once identified, you can apply these optimal values manually to the standard PSAR.
• Self-Adjusting PSAR — A real-time overlay version that looks and behaves like the standard PSAR but automatically adjusts its parameters on the fly. It requires no manual configuration and can be paired with the Profitable PSAR to monitor which settings are currently active.
• Compact Self-Adjusting PSAR — A minimalist oscillator version that reflects the same adaptive logic through simple binary outputs: -1 for Sell and 1 for Buy. This variant is ideal for filtering or signal integration into other systems.
Together, they form a unified adaptive system that gives users both automation and interpretability — the best of both worlds.
🔥 Key Features
Adaptive optimization powered by a decision tree–based algorithm
Real-time switching to more profitable parameter configurations
Direction filter (Longs | Shorts | Longs & Shorts)
Optional analysis start date for focused historical testing
Commission customization for realistic performance modeling
Visual highlighting of parameter changes
Optional buy/sell labels and compact trend signal display
If you'd like access or have any questions, feel free to reach out to me directly via DM.
👋 Good luck and happy trading!
Skrip berbayar
Profitable MAMA & FAMA CrossoverIntroduction
The MESA Adaptive Moving Average (MAMA) was originally presented by John F. Ehlers. By design, it is a special kind of Exponential Moving Average with self-adjusting alpha. Its adaptation is based on the rate change of phase as measured by the Homodyne Discriminator and the alpha parameter is allowed to range between a maximum and minimum value (Fast Limit and Slow Limit).
Key Point: Ehlers suggested the maximum value to be 0.5 and the minimum to be 0.05 .
The variable alpha is computed as the Fast Limit divided by the phase rate of change. If the phase rate of change is large, the variable alpha is bounded at the SlowLimit. Then, this alpha is used to compute MAMA and FAMA (Following Adaptive Moving Average).
Should we rely on Ehlers' suggestions if we want to achieve the best result with MAMA & FAMA crossover system?
Well, he is a good specialist and widely recognized author, I respect him, but the answer is no and you can see results on the chart.
What is our goal?
We want to find the best configuration for MAMA & FAMA Crossover. To achieve that we need to analyze the MAMA's alpha parameter or, more specific, the bounds for this parameter, Fast and Slow Limits.
What is this tool?
This tool is a performance optimizer that uses decision tree-based algorithm under the hood to find the most profitable settings for the MAMA & FAMA Crossover. It analyzes a bunch of different Fast Limits (between 0.01 to 0.8 with step of 0.1 ) and Slow Limits (between 0.01 to 0.6 with step of 0.1 ) and backtests each combination across the entire history of an instrument. If the more profitable parameters were found, the indicator will switch its values to the found ones immediately.
So, instead of manually selecting and testing parameters just apply this indicator to your chart and
relax - the algorithm will find the best parameters for you
Alerts
It has a special alert that notifies when the more profitable settings were detected.
NOTE: It does not change what has already been plotted.
NOTE 2: This is not a strategy, but an algorithmic optimizer.
Reference: www.mesasoftware.com
MAMA & FAMA Crossover can be found here:

Profitable RSI (Relative Strength Index)Introduction
As you know the Relative Strength Index (RSI) was originally developed by J. Welles Wilder and was described in his book "New Concepts in Technical Trading Systems" (1978). It is intended to measure the strength or weakness of an instrument for the specified period.
The most basic strategy is to use the crossovers as trade signals:
when RSI crosses above 30, go Long
when RSI crosses below 70, go Short
Exit when a crossover occurs in the opposite direction
What is this tool?
This tool is a performance scanner that uses a decision tree-based algorithm under the hood to find the most profitable settings for RSI. It analyzes the range of periods between 2 to 100 and backtests the RSI for each period using the strategy mentioned above across the entire history of an instrument. If the more profitable parameter was found, the indicator will switch its value to the found one immediately.
So, instead of manually selecting parameters just apply it to your chart and relax - the algorithm will do it for you.
The algorithm can work in two modes: Basic and Advanced "Early Switch" . The Early Switch algorithm makes some assumptions and activates a set of optimizations to find the better setting DURING the trades, not after they were closed.
The difference is illustrated on the screenshot below:
Additionally you can set up a backtest window through indicator's settings (the optimizers which were published before will get this feature soon).
Alerts
It has a special alert that notifies when a more profitable period was detected.
NOTE: It does not change what has already been plotted.
NOTE 2: This is not a strategy, but an algorithmic optimizer.
Day after day. Night after night.
I've been waiting to program again.
Day after day. Night by to night.
Trading is waiting inside your heart.

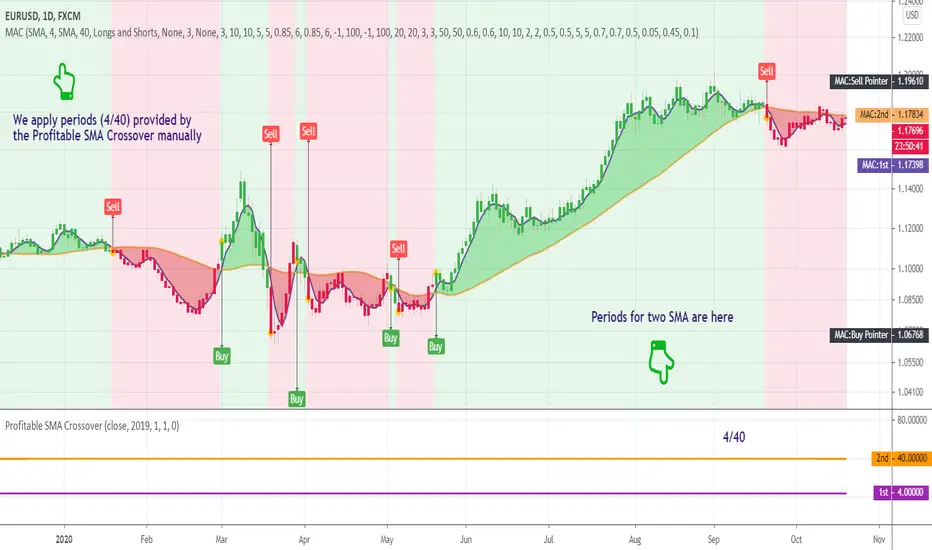
Profitable SMA CrossoverWhat is this tool?
This tool is a performance scanner of the crossover trading system that is based on the two simple moving averages (SMA). It uses a decision tree-based algorithm under the hood to find and plot the most profitable periods of the SMA combination.
It analyzes the range of periods between 4 to 45 and backtests each combination across the entire history of an instrument. If the more profitable periods were detected the indicator will switch periods of the moving averages immediately.
This is an add-on for the Ingenious SMA Crossover but can be used standalone.
Alerts
It has an alert that notifies when the more profitable periods were detected.
NOTE : It does not change what has already been plotted.
Good luck!
Profitable Vortex Indicator ScannerIntroduction
The Vortex Indicator is a technical indicator invented by Etienne Botes and Douglas Siepman (Technical Analysis of Stocks & Commodities, V.28:1 (January, 2010): "The Vortex Indicator") to identify the start of a new trend or the continuation of an existing trend within financial markets.
It is composed of two lines, +VI and -VI . +VI represents up trending momentum and -VI represents down trending momentum.
The most basic strategy is to use the crossovers as trade signals:
when +VI crosses above -VI , go Long
when -VI crosses above +VI , go Short
Exit when a crossover occurs in the opposite direction
What is this tool?
This tool is a performance scanner that uses a decision tree-based algorithm under the hood to find the most profitable period's setting for the indicator. It analyzes the range of periods between 2 to 100 and backtests the Vortex Indicator for each period using the strategy mentioned above across the entire history of an instrument.
Settings
Net Profit line is optional and can be hidden through settings.
Alerts
It has an alert that notifies when a more profitable period was detected.
NOTE : It does not change what has already been plotted.
Good luck!

9 Seasons Rainbow Multiple Time Frames Pattern DEMO [9SRDEN]The indicator discovers profitable patterns by associating Price Season of multiple time frames.
Full Name: 9 Seasons Rainbow - Multiple Time Frames Associated Price Wave Pattern Indicator
This is redefined from “9 Seasons Rainbow Indicator DEMO”, with clearer definition of 9 Seasons and user manual.
Version: DEMO
Language: English
Copyright: 2019
---------- How to use the indicator ----------
Go through the manual and related ideas underneath or follow the tutorials list. Look through the profitable patterns and related cases, wait for or set alert for specific profitable pattern.
---------- Definition: 9 Seasons ----------
A life cycle of Price Wave is divided into 9 Seasons. Each time frame, from 5 minute to 1 month, has 9 seasons, Independent of each other:
Bull (Green)
Bull Pullback (Light Green): a pullback or retracement
Resistance / Overbought (Yellow): a resistance area, may become a Top, or be broken through.
Crazy Bought (Lime): Price is going up in a high volatility, could be a valid breakout, or a Bull Trap.
Neutral (White): a wandering season without direction, evolves into Bull or Bear
Bear (Red)
Bear Bounce (Light Red): Price bounces
Support / Oversold (Blue): a support area, may become a Bottom, or be broken through.
Crazy Sold (Fuchsia): Price is going down in a high volatility, could be a valid breakdown, or a Bear Trap.
---------- Some important evolution between seasons ----------
Resistance / Overbought (Yellow) -> Crazy Bought (Lime):
Bull is breaking through a resistance.
Crazy Bought (Lime) -> Resistance / Overbought (Yellow):
This normally indicates a failed breakout, Price goes back to the resistance.
Crazy Bought (Lime) -> Bull Pullback (Light Green):
This normally indicates Price has risen to a new level
Support / Oversold (Blue) -> Crazy Sold (Fuchsia):
Bear is breaking through a support.
Crazy Sold (Fuchsia) -> Support / Oversold (Blue):
This normally indicates a failed breakdown, Price recovers to the support.
Crazy Sold (Fuchsia) -> Bear Bounce (Light Red):
This normally indicates price has dropped to a new level
---------- Rainbow Ribbons for Multiple Time Frames ----------
Each ribbon of a rainbow represents a time frame.
The uppermost ribbon represents the shortest-term time frame - current time period of the chart, which is the time frame for trading.
The lowermost ribbon represent longest-term time frame, which work as environment, together with the other medium-term and long-term time frames.
The difference between two frames is 1.4142 fold (square root of 2), if level 1 is 15 minute, level 2 is 15 minute * (square root of 2) .
Examples of time frames in a rainbow:
For STANDARD in 15M: 15M - 21M - 30M - 42M - 60M(1H) - 85M - 120M(2H) - 170M
For PRO in 15M: 15M - 21M - 30M - 42M - 60M(1H) - 85M - 120M(2H) - 170M - 240M(4H) - 339M - 480M(8H) - 679M
---------- Trading Methods ----------
How to open a Long position?
When a profitable Long pattern appears, open small position first based on signal on shortest-term time frame; after retesting and confirming the support, open 2nd position; when it breaks through the resistance, pullbacks and confirms the breakout, open 3rd position.
How to exit a Long position?
Lift the Stop to a confirmed higher low, so that to take advantages of the bull run as possible.
How to open a Short position?
When a profitable Short pattern appears, open small position first based on signal on shortest-term time frame; after retesting and confirming the resistance, open 2nd position; when it breaks through the support, bounces and confirms the breakdown, add 3rd position.
How to exit a Short position?
Lower the Stop to a confirmed lower high, so that to take advantages of the bear run as possible.
---------- Versions Description ----------
The features may change later without advance notice.
PRO:
Invite-Only, with the following advanced features:
12 Ribbons Rainbow displays 9 Seasons of 12 time frames on a chart.
Advanced alert sets allows set alerts on short-term, medium-term, and long-term time frames.
Capability to input different trading instrument to compare with the current ticker.
Full time periods access allows apply it to broadest time periods, from 1 minute to 1 week (if history data is enough)
More new features in updates.
STANDARD:
Invite-Only, with the following advanced features:
8 Ribbons Rainbow displays 9 Seasons of 8 time frames on a chart.
Advanced alert sets allows set alerts on upper and lower frames.
Broad time periods access allows apply it to the most popular time periods, from 15 minute to 1 week (if history data is enough)
More new features in updates.
DEMO:
DEMO version is for trial purpose, having most of the features.
It is applicable to a list of trading instruments and specific time periods (1 hour to 1 day), which may change later without advance notice.
---------- Access to Indicators ----------
Please use DEMO version for Trial
Asking access to Invite-Only PRO and STANDARD versions:
9seasonsrainbowindicator.blogspot.com
Or contact the author.
---------- Install Invite Only: STANDARD & PRO Version----------
Ask access to STANDARD or PRO version
Open the chart -> Indicators (On the Top) -> Invite-Only Scripts (2nd button of the left bar)
Like/Favorite the indicator
Click to install on the chart
---------- About Loading Time ----------
It may take up to 2 minutes for your browser to load a new setting, depending on the your computer and network speed.
---------- List of the author's Indicators ----------
www.tradingview.com
---------- Disclaimer ----------
By using or requesting access to the indicator, you acknowledge that you have read and accepted that the indicator and any related content, including but not limited to: user manual, tutorials, ideas, videos, chats, emails, blog, are for the purpose of trading strategies studying and paper trading.
If a customer or user uses the indicator or related content mentioned above for live trading or investment, she/he should take all risks and be responsible for her/his own trading and investment activities.
---------- Updates ----------
The latest updates override the previous description.
To activate a update: Close the browser, Reopen the chart and apply the indicator.

Profitable Mondays & Losing FridaysHere's a Pine Script that marks profitable Mondays and losing Fridays for a given stock:
Explanation
Input Parameter: The script allows you to input the stock symbol, defaulting to SPX.
Daily Returns: It calculates the daily return based on the closing price.
Day Identification: It checks if the current day is Monday or Friday.
Conditions:
Profitable Mondays: Marks with a green background if Monday's return is positive.
Losing Fridays: Marks with a red background if Friday's return is negative.
Visualization: Uses bgcolor to highlight the respective days on the chart.
You can adjust the stockSymbol input to analyze different stocks.
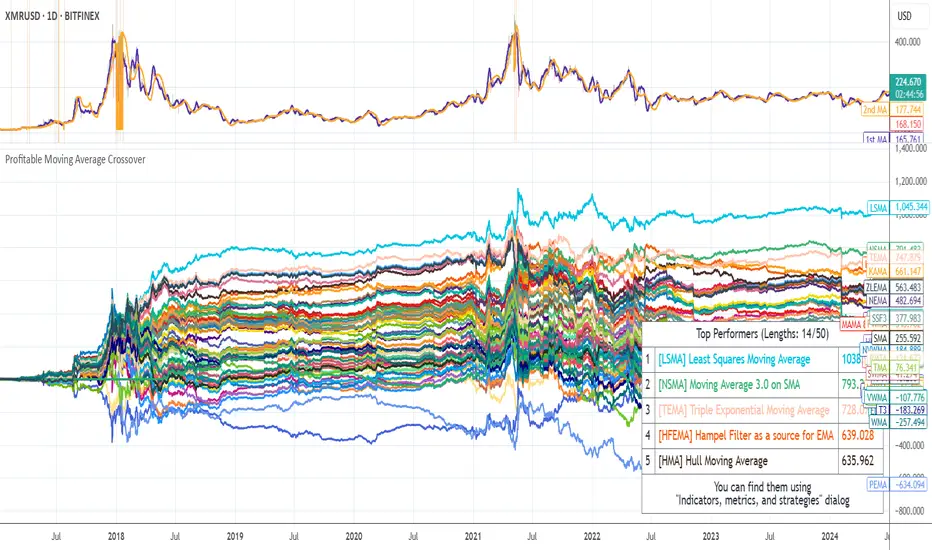
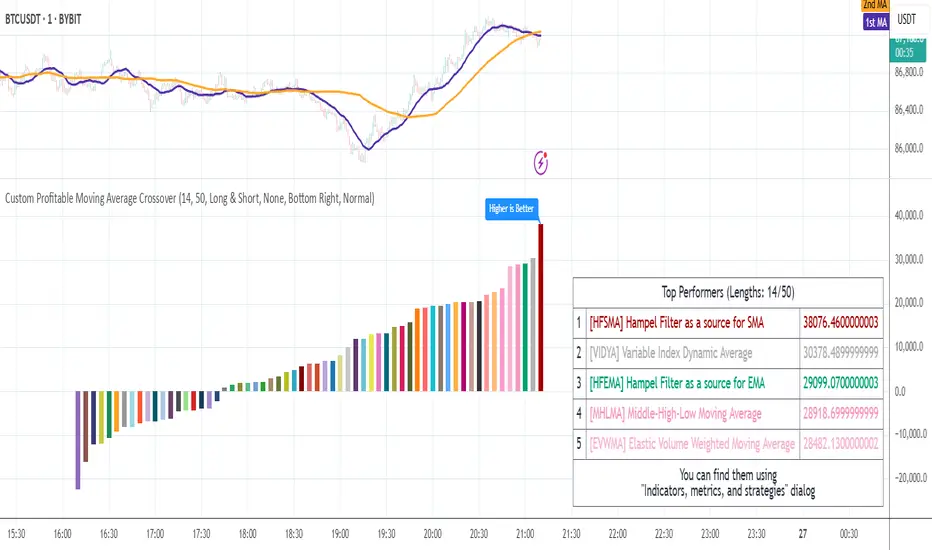
Profitable Moving Average CrossoverHello friends,
I'm glad to introduce a powerful research and optimization tool that takes the classic moving average crossover concept to a new level. Instead of relying on guesswork or fixed MA types, it lets you objectively discover the most profitable moving average pair for any instrument and timeframe.
🛠 How It Works
Moving average crossovers are among the most popular trading systems. A buy signal occurs when a shorter (faster) moving average crosses above a longer (slower) one, and a sell signal when it crosses below. The system's responsiveness — and the number of generated signals — depend on the chosen MA lengths and types.
This script evaluates 61 moving average types (including Jurik, Kaufman, Ehlers, Apirine, and others) and backtests all possible crossover combinations either across the entire chart history or within a custom backtest window . It then plots continuous profit metric lines for each crossover type and displays the top 5 performers in a results table. Each MA type is color-coded, allowing quick visual identification of which systems have historically delivered the strongest results.
🔥 Key Features
Pine Script V6 — optimized for performance and stability
Tests 61 moving average types , from classic to adaptive designs
Custom Backtest Window — analyze the entire history or a specific date range
Continuous profit curves for every crossover type plotted on chart
Top 5 crossover systems displayed in a compact summary table
Color-coded MA identifiers for fast visual comparison
Supports custom parameters for advanced MAs (JMA, ALMA, McGinley Dynamic, Adaptive Laguerre Filter, etc.)
Works seamlessly across all assets and timeframes
NOTE: Results will vary across different tickers and timeframes. Seeing strong performance in one preview does not imply similar profitability elsewhere — this variability is normal due to differing market structures.
NOTE 2: You can experiment with the tool independently or request a full study, in which case I'll share a spreadsheet of all backtest results with you.
👋 Good luck and happy trading!
Skrip berbayar
[HTI2] Hiubris Trend Indicator 2This is the Study version of the Hiubris Trend Indicator 2 (Used for Alerts)
After testing several strategies for months and comparing them to the standard 'Buy and Hold' method, we've found the best performing strategy for BTCUSDT
We simplified it to make it more user-friendly (We've only added 1 optional exit: a % SL) and left all the inputs adjustable, so it can be optimized for ANY pair!
This is a Trend Indicator! This means that the '% Profitable Trades' is not the main focus, but catching every trend swing. When trying to catch every trend swing, naturally alot of the them might be unprofitable, especially in sideways markets. The idea behind this strategy is to catch all the significant trend movements, which are alot more profitable than all the 'sideway market' losses
This indicator is fully adjustable and matches exactly the published strategy!
The user has the option to setup alerts for all chart signals (Entries, Re-Entries, Stop-Loss)

Self-Adjusting SuperTrendWhat is this tool?
This is an implementation of the well-known SuperTrend indicator that can adjust parameters on the fly to achieve a better profitability.
The algorithm was borrowed from Profitable SuperTrend and connected to the basic SuperTrend implementation. So, now it will switch parameters automatically without any manual work required.
Alerts
The same alerts as for the basic SuperTrend + special alert to notify user about parameters switching.
Profitable SuperTrend indicator can be found here:
SuperTrend indicator can be found here:
Good luck!

Self-Adjusting Parabolic SARWhat is this tool?
This is an implementation of the well-known Parabolic SAR indicator that can adjust parameters on the fly to achieve a better profitability.
The algorithm was borrowed from Profitable Parabolic SAR and connected to the basic Parabolic SAR implementation. So, now it will switch parameters automatically without any manual work required.
Profitable Parabolic SAR indicator can be found here:
Parabolic SAR indicator can be found here:
Compact Profitable Moving Average CrossoverHello friends,
I'm pleased to introduce this advanced evolution of the original Profitable Moving Average Crossover tool. This version offers complete control over the analysis range and delivers detailed real-time profitability metrics for every moving average crossover type directly on your chart.
🛠 How It Works
The script evaluates 61 moving average crossover systems across a customizable date range , allowing you to focus on specific historical windows for optimization or validation. It calculates each crossover's net profit performance and automatically ranks all results, displaying the top 5 performers in a summary table. Results are visualized through a color-coded column chart, making it easy to identify which crossover types have historically delivered the strongest outcomes.
🔥 Key Features
Pine Script V6 — built on the latest and most efficient version
Tests 61 moving average types , including those developed by Jurik, Kaufman, Ehlers, Apirine, and others
Custom Backtest Window — analyze any date range with start and end parameters
Automatic Results Table — displays the top 5 crossovers ranked by profit
Color-Coded Chart — quick visual identification of performance by crossover type
Sorted column chart for clear visual comparison of profit metrics
Fully compatible with all symbols, timeframes, and market types
NOTE: Results will vary across different tickers and timeframes. Seeing strong performance in one preview does not imply similar profitability elsewhere — this variability is normal due to differing market structures.
NOTE 2: You can experiment with the tool independently or request a full study, in which case I'll share a spreadsheet of all backtest results with you.
👋 Good luck and happy trading!
Skrip berbayar
Ingenious SMA CrossoverIntroduction
A popular use for moving averages is to develop simple trading systems based on moving average crossovers. A trading system using two moving averages would give a buy signal when the shorter (faster) moving average advances above the longer (slower) moving average. A sell signal would be given when the shorter moving average crosses below the longer moving average. The speed of the systems and the number of signals generated will depend on the period of the moving averages.
What is this tool?
This tool is a crossover system of two simple moving averages. I called it "Ingenious" because it uses a decision tree-based algorithm under the hood to find and plot the most profitable SMA combination.
It analyzes the range of periods between 4 to 45 and backtests each combination across the entire history of an instrument. If the more profitable periods were detected the indicator will switch periods of the moving averages to the found ones immediately.
NOTE : It does not change what has already been plotted.
Good luck!

CryptoScalper: NightMODE by BiO-618Hey guys!
It's me with a new version of the script.
Since a lot of people wanted to use it for scalping, I adjusted it for that.
More buy signals, more sell signals, 90% accuracy (at least ;) )
Remember to use the pivots to set Take Profits and Stop Losses, no software is 100% accurate, otherwise the market would trash it.
SELL SIGNALS
Red "S": Sell signal
Yellow "Sell": Strong+ sell signal
Orange "SELL": Strong++ sell signal. Shortable signal.
Red triangledown "SELL!": Strongest+++ sell signal, bearish divergences from MACD . Shortable signal.
BUY SIGNALS
Yellow triangleup "Weakening": Bear trend is getting weak, as the asset is getting oversold.
Green "BUY!": Strong buy, bullish divergence from MACD . Strongest buy signal.
Remember, again, to ALWAYS set your TP and SL beforehand. The key to be profitable is to act before the market acts.
It's better 3% in hand than 1% below your initial balance.
From a manual backtesting, I got a 53% profit on 2 weeks, trust my advice to manage the risk and you will be profitable aswell ;)
Check my other scripts to get more options :)
I also made a 4Hours and 12Hours optimized scripts, you might found that which one works better for your strategy, asset, and timeframe.

-- Simple and Profitable Cryptocurrency Trading Strategy --Script based on this strategy:
Based on 8EMA Close and Open with Weis Wave Volume by Lazybear indicator.
The script will let you know when to Long or Short the market.

DMT TEMPELTON PECKIntroduction
Bring your A-game to the market in A-Team style with DMT Templeton Peck – you’ll love it when this plan comes together!
Using customized standard deviations between historic price action ranges and volume metrics, DMT Templeton Peck enables traders to never miss a change in trend.
In its default state, the DMT Templeton Peck indicator displays key information, such as:
• Small trend line
• Large trend line
• Position entry prices
• Take profit levels
• Stop levels
• Buy and sell trend signals
In addition to providing core functionality for the indicator’s strategy signals, traders can use this data to enter or exit trades.
When price crosses both trend lines and consolidates there is a high probability that price will continue to move in the same direction. The most profitable results are achieved when trading in the direction of the current large time frame trend.
When small and large trend lines cross a trading signal is generated which can be used to automate trades. Please see the ‘TradingView Alerts’ section of this document for further details.
The Small & Large trend line’s display can be toggled, and their colors modified in the indicator’s style options as shown below.
Basic Strategy
In its simplest form, the strategy is to buy when the price crosses and consolidates above both trend lines and sell when the price crosses and consolidates below both trend lines.
How to Trade
Confident traders may choose to enter a long position at the point
#1 when the price passes above both trend lines and begins to consolidate.
However, the safer trade is to wait for the trend lines to cross at a point
#2 and then look for an entry in the direction of the local trend.
One price action begins to reverse to the downside the strategy reverses. Confident traders may choose to enter point
#3 when the price passes both trend lines and begins to consolidate once again under the previous price action structure that is now acting as resistance.
A sell signal is generated at the point
#4 which produced a small profit; however, a new short position could have been opened when the price retraced to resistance at a point
#5 and experienced a repeated number of strong rejections.
Do not worry if you miss a trade as there is often more than a single opportunity to enter – like at position #5 when price action retests the previous local price structure as resistance.
The indicator can be used on smaller time frames to scalp or find an entry after a larger time frame has signaled, however smaller time frames will also be “choppy” and should only be traded with a paper-tested strategy.
Traders should take profit on positions at resistance & support levels and look to have fully exited the trade by the time the price crosses back over both trend lines and/or loses a previously established price level.
Indicator Tuning
In its default state the indicator is tuned for swing trades using 30 minute & 1 hour time frames, however, you are encouraged to experiment with the indicator options.
Large & Small Length options define how many historic candles are used for the calculation of the relevant trend line.
As a rule of thumb, larger time frames would use smaller values and smaller time frames would use larger values, ie. On a daily chart, a large and small length could be defined as 400 and 100 respectively.
Please be aware that there are limits to the amount of historical data for any intraday level based on your TradingView subscription level:
• Basic – 5000 bars/candles
• Pro & Pro+ - 10000 bars/candles
• Premium – 20000 bars/cables
TradingView Alerts
By utilizing TradingView alerts DMT Templeton Peck's long and short signals can be used to trigger a trading bot.
To trigger a long position, set the TradingView Alert Condition to the DMT Templeton Peck indicator and select the ‘Long’ trigger condition with the ‘Once Per Bar Close’ option for best results.
To trigger a short position, set the TradingView Alert Condition to the DMT Templeton Peck indicator and select the ‘Short’ trigger condition with the ‘Once Per Bar Close’ option for best results.
Take profit options ‘Long_TP_1’ / ‘Short_TP_1’ and Stop options ‘Stop_long’ / ‘Stop_Short’ can also be configured in the same manner to conditionally trigger a trading bot and can be configured in the indicators Input options.

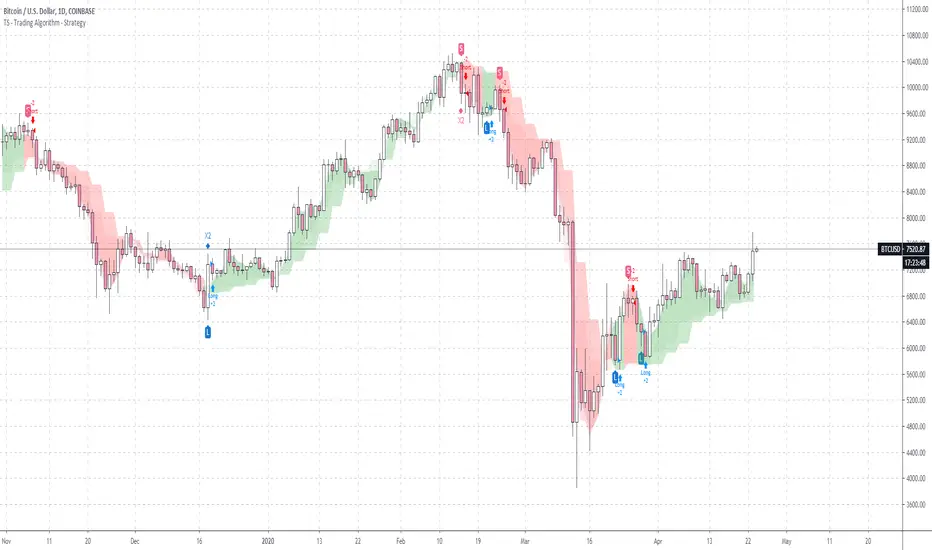
TS - Trading Algorithm - StrategyStrategy to the bespoke TS - Trading Algorithm . Highly profitable cryptocurrency trading model.
Access to both the backtesting strategy & indicator is paid - PM me for details.
Indicator does not repaint and has no discretionary approach - you can follow blindly and take advantage of the performance.
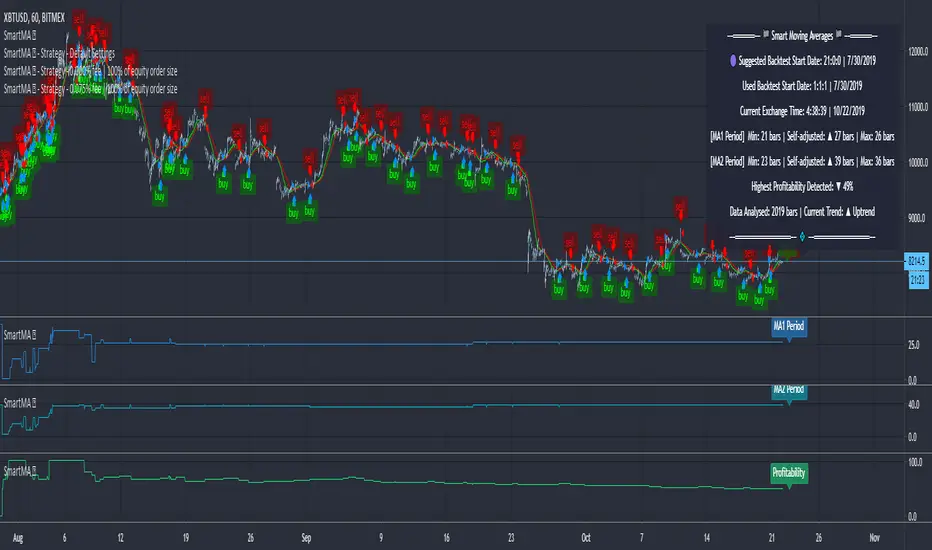
Moving Averages (Self-Adjusting Param for Highest Profitability)Moving Averages (Self-Adjusting Parameters for Highest Profitability)
It is a dual moving average crossover system - Smart Moving Averages .
Moving averages are used to identify current price developments and the potential for a change in an established trend.
The crossover in a dual moving average system can be used as a trigger to buy or to sell an asset, or as a trend reversal indication.
The crossover occurrence depends on the periods for which the moving averages are calculated. Using constant period values may not bring the best results.
The Smart Moving Averages change their periods automatically to get the highest profitability .
The concept is similar to the Smart SuperTrend .
Features:
• Self-Adjusting Period parameters
• The graphs for Profitability, Moving Average 1 Period, Moving Average 2 Period and the Moving Averages themselves are available to choose for display from the indicator settings
• A chart layout can be made just for the Smart Moving Averages, having all the graphs nicely displayed
• Alerts for changes in Trend, Moving Average 1 Period, Moving Average 2 Period, Profitability
• Different types of Moving Averages are available to choose from in the indicator settings (SMA, EMA, RMA, WMA, VWMA, DEMA, TEMA, HullMA, TMA).
The range for Moving Average 1 Period, Moving Average 2 Period and Time can be changed in the indicator settings (suggested optimal values are displayed on the chart).
This affects the loading speed (smaller range, faster to load), as well as the accuracy of the signals.
The indicator switches to the most profitable Moving Average 1 Period and Moving Average 2 Period parameters automatically, in real-time.
It scans across the entire historical data made available by TradingView.
The Smart Moving Average system works on all timeframes and symbols available on TradingView.
Exception for when the Volume Weighted Moving Average is used - it doesn't work for symbols without volume data.
It does not repaint!
But several aspects must be considered:
- 1. TradingView periodically removes access to old data while giving access to new data in real-time.
____ The frequency depends on the timeframe, amount of data. It can happen daily for second charts, weekly for minute charts.
____ Since the Indicator wouldn't have access to that old data anymore, the Profitability may change its value, causing a certain degree of repainting.
- 2. The starting time for Backtest must be inserted in the settings panel.
____ As long as the starting time has available price data, the Smart Moving Averages will NOT get repainted.
____ A suggested starting date for the analysis is shown on the chart. Insert the date in the indicator settings.
This indicator is compatible with the Wrapper Module of the Risk Management System indicator, which means they can work together as a trading bot.
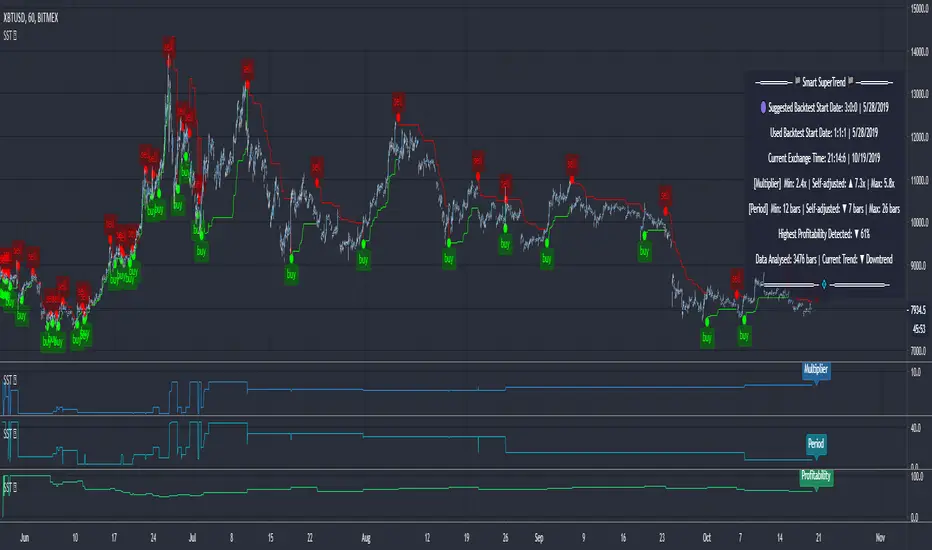
SuperTrend (Self-Adjusting Parameters for Highest Profitability)SuperTrend (Self-Adjusting Parameters for Highest Profitability)
The SuperTrend is a trend-following indicator.
It works best when it is used along with other indicators.
It performs well in trending markets and can give false signals in volatile markets.
It becomes Smart when its Multiplier and Period parameters are automatically detected .
• Self-Adjusting Multiplier and Period parameters
• The graphs for Profitability, SuperTrend Multiplier, SuperTrend Period and the SuperTrend itself are available to choose for display from the indicator settings
• A chart layout can be made just for the Smart SuperTrend, having all the graphs nicely displayed
• Alerts for changes in Trend, Multiplier, Period, Profitability
The range for Multiplier, Period and Time can be changed in the indicator settings.
This affects the loading speed (smaller range, faster to load), as well as the accuracy of the signals.
The indicator switches to the most profitable Multiplier and Period parameters automatically, in real-time .
It scans across the entire historical data made available by TradingView.
The Smart SuperTrend works on all timeframes and symbols available on TradingView.
It does not repaint!
But several aspects must be considered:
- 1. TradingView periodically removes access to old data while giving access to new data in real-time.
____ The frequency depends on the timeframe, amount of data. It can happen daily for second charts, weekly for minute charts.
____ Since the Indicator wouldn't have access to that old data anymore, the Profitability may change its value, causing a certain degree of repainting.
- 2. The starting time for Backtest must be inserted in the settings panel.
____ As long as that starting time has available price data, the SuperTrend will NOT get repainted.
____ A suggested starting date for the analysis is shown on the chart. Insert the date in the indicator settings.
This indicator is compatible with the Wrapper Module of the Risk Management System indicator, which means they can work together as a trading bot .