MultiLayer Acceleration/Deceleration Strategy [Skyrexio]Overview
MultiLayer Acceleration/Deceleration Strategy leverages the combination of Acceleration/Deceleration Indicator(AC), Williams Alligator, Williams Fractals and Exponential Moving Average (EMA) to obtain the high probability long setups. Moreover, strategy uses multi trades system, adding funds to long position if it considered that current trend has likely became stronger. Acceleration/Deceleration Indicator is used for creating signals, while Alligator and Fractal are used in conjunction as an approximation of short-term trend to filter them. At the same time EMA (default EMA's period = 100) is used as high probability long-term trend filter to open long trades only if it considers current price action as an uptrend. More information in "Methodology" and "Justification of Methodology" paragraphs. The strategy opens only long trades.
Unique Features
No fixed stop-loss and take profit: Instead of fixed stop-loss level strategy utilizes technical condition obtained by Fractals and Alligator to identify when current uptrend is likely to be over (more information in "Methodology" and "Justification of Methodology" paragraphs)
Configurable Trading Periods: Users can tailor the strategy to specific market windows, adapting to different market conditions.
Multilayer trades opening system: strategy uses only 10% of capital in every trade and open up to 5 trades at the same time if script consider current trend as strong one.
Short and long term trend trade filters: strategy uses EMA as high probability long-term trend filter and Alligator and Fractal combination as a short-term one.
Methodology
The strategy opens long trade when the following price met the conditions:
1. Price closed above EMA (by default, period = 100). Crossover is not obligatory.
2. Combination of Alligator and Williams Fractals shall consider current trend as an upward (all details in "Justification of Methodology" paragraph)
3. Acceleration/Deceleration shall create one of two types of long signals (all details in "Justification of Methodology" paragraph). Buy stop order is placed one tick above the candle's high of last created long signal.
4. If price reaches the order price, long position is opened with 10% of capital.
5. If currently we have opened position and price creates and hit the order price of another one long signal, another one long position will be added to the previous with another one 10% of capital. Strategy allows to open up to 5 long trades simultaneously.
6. If combination of Alligator and Williams Fractals shall consider current trend has been changed from up to downtrend, all long trades will be closed, no matter how many trades has been opened.
Script also has additional visuals. If second long trade has been opened simultaneously the Alligator's teeth line is plotted with the green color. Also for every trade in a row from 2 to 5 the label "Buy More" is also plotted just below the teeth line. With every next simultaneously opened trade the green color of the space between teeth and price became less transparent.
Strategy settings
In the inputs window user can setup strategy setting: EMA Length (by default = 100, period of EMA, used for long-term trend filtering EMA calculation). User can choose the optimal parameters during backtesting on certain price chart.
Justification of Methodology
Let's explore the key concepts of this strategy and understand how they work together. We'll begin with the simplest: the EMA.
The Exponential Moving Average (EMA) is a type of moving average that assigns greater weight to recent price data, making it more responsive to current market changes compared to the Simple Moving Average (SMA). This tool is widely used in technical analysis to identify trends and generate buy or sell signals. The EMA is calculated as follows:
1.Calculate the Smoothing Multiplier:
Multiplier = 2 / (n + 1), Where n is the number of periods.
2. EMA Calculation
EMA = (Current Price) × Multiplier + (Previous EMA) × (1 − Multiplier)
In this strategy, the EMA acts as a long-term trend filter. For instance, long trades are considered only when the price closes above the EMA (default: 100-period). This increases the likelihood of entering trades aligned with the prevailing trend.
Next, let’s discuss the short-term trend filter, which combines the Williams Alligator and Williams Fractals. Williams Alligator
Developed by Bill Williams, the Alligator is a technical indicator that identifies trends and potential market reversals. It consists of three smoothed moving averages:
Jaw (Blue Line): The slowest of the three, based on a 13-period smoothed moving average shifted 8 bars ahead.
Teeth (Red Line): The medium-speed line, derived from an 8-period smoothed moving average shifted 5 bars forward.
Lips (Green Line): The fastest line, calculated using a 5-period smoothed moving average shifted 3 bars forward.
When the lines diverge and align in order, the "Alligator" is "awake," signaling a strong trend. When the lines overlap or intertwine, the "Alligator" is "asleep," indicating a range-bound or sideways market. This indicator helps traders determine when to enter or avoid trades.
Fractals, another tool by Bill Williams, help identify potential reversal points on a price chart. A fractal forms over at least five consecutive bars, with the middle bar showing either:
Up Fractal: Occurs when the middle bar has a higher high than the two preceding and two following bars, suggesting a potential downward reversal.
Down Fractal: Happens when the middle bar shows a lower low than the surrounding two bars, hinting at a possible upward reversal.
Traders often use fractals alongside other indicators to confirm trends or reversals, enhancing decision-making accuracy.
How do these tools work together in this strategy? Let’s consider an example of an uptrend.
When the price breaks above an up fractal, it signals a potential bullish trend. This occurs because the up fractal represents a shift in market behavior, where a temporary high was formed due to selling pressure. If the price revisits this level and breaks through, it suggests the market sentiment has turned bullish.
The breakout must occur above the Alligator’s teeth line to confirm the trend. A breakout below the teeth is considered invalid, and the downtrend might still persist. Conversely, in a downtrend, the same logic applies with down fractals.
In this strategy if the most recent up fractal breakout occurs above the Alligator's teeth and follows the last down fractal breakout below the teeth, the algorithm identifies an uptrend. Long trades can be opened during this phase if a signal aligns. If the price breaks a down fractal below the teeth line during an uptrend, the strategy assumes the uptrend has ended and closes all open long trades.
By combining the EMA as a long-term trend filter with the Alligator and fractals as short-term filters, this approach increases the likelihood of opening profitable trades while staying aligned with market dynamics.
Now let's talk about Acceleration/Deceleration signals. AC indicator is calculated using the Awesome Oscillator, so let's first of all briefly explain what is Awesome Oscillator and how it can be calculated. The Awesome Oscillator (AO), developed by Bill Williams, is a momentum indicator designed to measure market momentum by contrasting recent price movements with a longer-term historical perspective. It helps traders detect potential trend reversals and assess the strength of ongoing trends.
The formula for AO is as follows:
AO = SMA5(Median Price) − SMA34(Median Price)
where:
Median Price = (High + Low) / 2
SMA5 = 5-period Simple Moving Average of the Median Price
SMA 34 = 34-period Simple Moving Average of the Median Price
The Acceleration/Deceleration (AC) Indicator, introduced by Bill Williams, measures the rate of change in market momentum. It highlights shifts in the driving force of price movements and helps traders spot early signs of trend changes. The AC Indicator is particularly useful for identifying whether the current momentum is accelerating or decelerating, which can indicate potential reversals or continuations. For AC calculation we shall use the AO calculated above is the following formula:
AC = AO − SMA5(AO), where SMA5(AO)is the 5-period Simple Moving Average of the Awesome Oscillator
When the AC is above the zero line and rising, it suggests accelerating upward momentum.
When the AC is below the zero line and falling, it indicates accelerating downward momentum.
When the AC is below zero line and rising it suggests the decelerating the downtrend momentum. When AC is above the zero line and falling, it suggests the decelerating the uptrend momentum.
Now we can explain which AC signal types are used in this strategy. The first type of long signal is when AC value is below zero line. In this cases we need to see three rising bars on the histogram in a row after the falling one. The second type of signals occurs above the zero line. There we need only two rising AC bars in a row after the falling one to create the signal. The signal bar is the last green bar in this sequence. The strategy places the buy stop order one tick above the candle's high, which corresponds to the signal bar on AC indicator.
After that we can have the following scenarios:
Price hit the order on the next candle in this case strategy opened long with this price.
Price doesn't hit the order price, the next candle set lower high. If current AC bar is increasing buy stop order changes by the script to the high of this new bar plus one tick. This procedure repeats until price finally hit buy order or current AC bar become decreasing. In the second case buy order cancelled and strategy wait for the next AC signal.
If long trades are initiated, the strategy continues utilizing subsequent signals until the total number of trades reaches a maximum of 5. All open trades are closed when the trend shifts to a downtrend, as determined by the combination of the Alligator and Fractals described earlier.
Why we use AC signals? If currently strategy algorithm considers the high probability of the short-term uptrend with the Alligator and Fractals combination pointed out above and the long-term trend is also suggested by the EMA filter as bullish. Rising AC bars after period of falling AC bars indicates the high probability of local pull back end and there is a high chance to open long trade in the direction of the most likely main uptrend. The numbers of rising bars are different for the different AC values (below or above zero line). This is needed because if AC below zero line the local downtrend is likely to be stronger and needs more rising bars to confirm that it has been changed than if AC is above zero.
Why strategy use only 10% per signal? Sometimes we can see the false signals which appears on sideways. Not risking that much script use only 10% per signal. If the first long trade has been open and price continue going up and our trend approximation by Alligator and Fractals is uptrend, strategy add another one 10% of capital to every next AC signal while number of active trades no more than 5. This capital allocation allows to take part in long trades when current uptrend is likely to be strong and use only 10% of capital when there is a high probability of sideways.
Backtest Results
Operating window: Date range of backtests is 2023.01.01 - 2024.11.01. It is chosen to let the strategy to close all opened positions.
Commission and Slippage: Includes a standard Binance commission of 0.1% and accounts for possible slippage over 5 ticks.
Initial capital: 10000 USDT
Percent of capital used in every trade: 10%
Maximum Single Position Loss: -5.15%
Maximum Single Profit: +24.57%
Net Profit: +2108.85 USDT (+21.09%)
Total Trades: 111 (36.94% win rate)
Profit Factor: 2.391
Maximum Accumulated Loss: 367.61 USDT (-2.97%)
Average Profit per Trade: 19.00 USDT (+1.78%)
Average Trade Duration: 75 hours
How to Use
Add the script to favorites for easy access.
Apply to the desired timeframe and chart (optimal performance observed on 3h BTC/USDT).
Configure settings using the dropdown choice list in the built-in menu.
Set up alerts to automate strategy positions through web hook with the text: {{strategy.order.alert_message}}
Disclaimer:
Educational and informational tool reflecting Skyrex commitment to informed trading. Past performance does not guarantee future results. Test strategies in a simulated environment before live implementation
These results are obtained with realistic parameters representing trading conditions observed at major exchanges such as Binance and with realistic trading portfolio usage parameters.
Cari dalam skrip untuk "profitable"

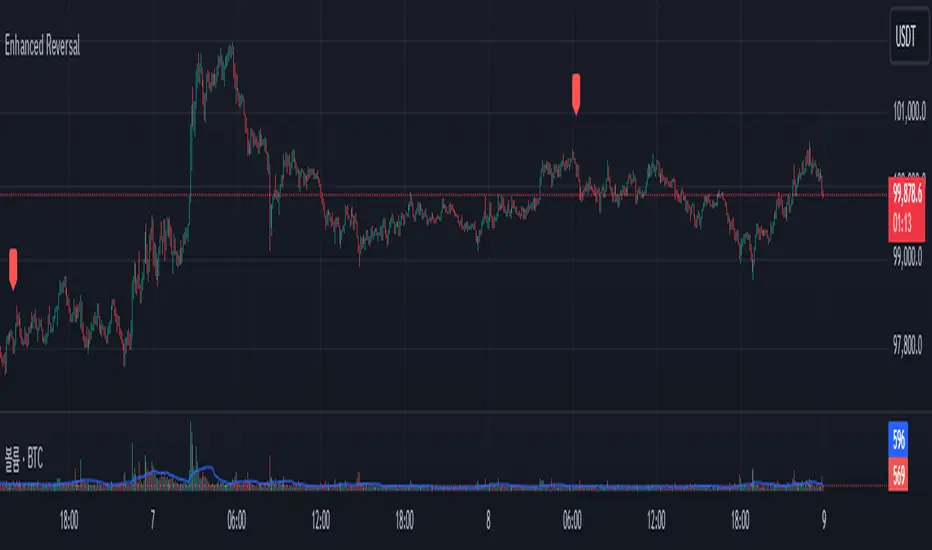
Enhanced Reversal DetectorEnhanced Reversal Detector - Script Description
Overview:
The Enhanced Reversal Detector is a highly refined indicator designed to identify precise trend reversals in financial markets. It improves upon the original reversal detection logic by incorporating additional filters for trend confirmation (using EMA), volume spikes, and candle patterns. These enhancements significantly increase the reliability and accuracy of reversal signals, making it an excellent tool for both short-term and long-term traders.
Key Features
Candle Lookback Logic:
The indicator evaluates historical price action over a user-defined lookback period to detect potential reversal zones.
Bullish reversal conditions are met when price consistently tests lows, and bearish reversal conditions are met when price tests highs.
Trend Confirmation (EMA Filter):
To ensure that reversal signals align with the broader market trend, the indicator incorporates an Exponential Moving Average (EMA) filter.
Bullish signals are only triggered when the price is above the EMA, while bearish signals are only triggered when the price is below the EMA.
Volume Spike Filter:
The indicator checks for significant increases in trading volume to confirm that the reversal is supported by strong market activity.
Volume spikes are calculated as trading volume exceeding a multiple of the 20-bar average volume (default: 1.5x).
Confirmation Period:
Users can define a confirmation window within which reversal signals must be validated.
This reduces false positives and ensures only strong reversals are considered.
Non-Repainting Mode:
Offers a non-repainting option, where signals are based on confirmed conditions from previous bars, ensuring reliability for backtesting.
Visual and Alert Features:
Clear visual markers on the chart indicate bullish (green triangle) and bearish (red triangle) reversal points.
Alert notifications can be enabled for both bullish and bearish reversals, keeping traders informed in real-time.
Inputs
Candle Lookback: Number of candles to evaluate for reversal conditions.
Confirm Within: Number of candles within which a reversal must be validated.
Non-Repainting Mode: Option to enable or disable repainting for signals.
EMA Length: The length of the Exponential Moving Average used for trend confirmation.
Volume Spike Multiplier: Multiplier for identifying significant increases in trading volume.
How It Works
Reversal Detection:
Bullish signals are triggered when:
Price consistently tests recent lows (lookback period).
Price closes above the EMA.
A significant volume spike occurs.
Bearish signals are triggered under opposite conditions (price testing highs, closing below EMA, and volume spike).
Signal Filtering:
Incorporates EMA and volume-based filters to eliminate false positives and focus on high-confidence reversal signals.
Alert Notifications:
Alerts notify users of bullish or bearish reversal opportunities as soon as they are detected.
Use Cases
Scalping and Day Trading:
Ideal for identifying reversals on lower timeframes (e.g., 1-minute or 5-minute charts).
Swing Trading:
Works effectively on higher timeframes (e.g., 1-hour or daily charts) for capturing significant
trend reversals.
Volatile Markets:
Particularly useful in high-volatility markets like cryptocurrencies or forex.
Customization Tips
Adjust the lookback period to fine-tune the sensitivity of the reversal detection.
Increase the volume spike multiplier for markets with irregular trading volumes to focus on significant moves.
Experiment with the EMA length to align signals with your trading strategy's preferred trend duration.
Conclusion
The Enhanced Reversal Detector combines advanced price action analysis, trend confirmation, and market participation filters to deliver high-accuracy reversal signals. With its customizable settings and robust filtering mechanisms, this indicator is an invaluable tool for identifying profitable trading opportunities while minimizing noise and false signals.
Ask-Weighted Averages This indicator provides two price-based reference lines derived from volume dynamics within each bar. Specifically, it calculates a volume-weighted average price using only the portion of trading volume that occurred on the "ask" side, implying more aggressive buying activity. The logic behind this approach is to highlight potential support and resistance levels where buyers have shown greater conviction.
Key Features:
Ask-Weighted Average Prices:
Instead of using the entire trade volume, the lines focus on "ask volume" (volume associated with trades occurring at or near the ask price). This helps to spotlight areas where buyers have been dominant, potentially revealing more meaningful price levels for future market behavior.
Conditional vs. Continuous Lines:
Conditional Line: This line is only plotted if the dollar volume (a rough measure of trade value) exceeds a specified threshold, ensuring that the highlighted level is backed by substantial trading activity.
Continuous Line: A second line is always displayed, providing a running ask-weighted average price reference for additional context, regardless of dollar volume.
Supports Identifying Key Price Zones:
By focusing on where more motivated buyers have been active, the indicator helps traders identify potential inflection points in price, such as areas where the market might find support on pullbacks or resistance during rallies.
Overall, this indicator serves as a specialized tool for traders interested in volume-driven price analysis. It aims to refine the understanding of where buyers are most engaged and how that might shape future price movements.
Risks Associated with Trading:
No indicator can guarantee profitable trades or accurately predict future price movements. Market conditions are inherently unpredictable, and reliance on any single tool or combination of tools carries the risk of financial loss. Traders should practice sound risk management, including the use of stop losses and position sizing, and should not trade with funds they cannot afford to lose. Ultimately, decisions should be guided by a thorough trading plan and possibly supplemented with other forms of market analysis or professional advice.
Risks and Important Considerations:
• Not a Standalone Tool:
• This indicator should not be used in isolation. It is essential to incorporate additional technical analysis tools, fundamental analysis, and market context when making trading decisions.
• Relying solely on this indicator may lead to incomplete assessments of market conditions.
• Market Volatility and False Signals:
• Financial markets can be highly volatile, and indicators based on historical data may not accurately predict future movements.
• The indicator may produce false signals due to sudden market changes, low liquidity, or atypical trading activity.
• Risk Management:
• Always employ robust risk management strategies, including setting stop-loss orders, diversifying your portfolio, and not over-leveraging positions.
• Understand that no indicator guarantees success, and losses are a natural part of trading.
• Emotional Discipline:
• Avoid making impulsive decisions based on indicator signals alone.
• Emotional trading can lead to significant financial losses; maintain discipline and adhere to a well-thought-out trading plan.
• Continuous Learning and Adaptation:
• Stay informed about market news, economic indicators, and global events that may impact trading conditions.
• Continuously evaluate and adjust your trading strategies as market dynamics evolve.
• Consultation with Professionals:
• Consider seeking advice from financial advisors or professional traders to understand better how this indicator can fit into your overall trading strategy.
• Professional guidance can provide personalized insights based on your financial goals and risk tolerance.
Disclaimer:
Trading financial instruments involves substantial risk and may not be suitable for all investors. Past performance is not indicative of future results. This indicator is provided for informational and educational purposes only and should not be considered investment advice. Always conduct your own research and consult with a licensed financial professional before making any trading decisions.
Note: The effectiveness of any technical indicator can vary based on market conditions and individual trading styles. It's crucial to test indicators thoroughly using historical data and possibly paper trading before applying them in live trading scenarios.

WhalenatorThis custom TradingView indicator combines multiple analytic techniques to help identify potential market trends, areas of support and resistance, and zones of heightened trading activity. It incorporates a SuperTrend-like line based on ATR, Keltner Channels for volatility-based price envelopes, and dynamic order blocks derived from significant volume and pivot points. Additionally, it highlights “whale” activities—periods of exceptionally large volume—along with an estimated volume profile level and approximate bid/ask volume distribution. Together, these features aim to offer traders a more comprehensive view of price structure, volatility, and institutional participation.
This custom TradingView indicator integrates multiple trading concepts into a single, visually descriptive tool. Its primary goal is to help traders identify directional bias, volatility levels, significant volume events, and potential support/resistance zones on a price chart. Below are the main components and their functionalities:
SuperTrend-Like Line (Trend Bias):
At the core of the indicator is a trend-following line inspired by the SuperTrend concept, which uses Average True Range (ATR) to adaptively set trailing stop levels. By comparing price to these levels, the line attempts to indicate when the market is in an uptrend (price above the line) or a downtrend (price below the line). The shifting levels can provide a dynamic sense of direction and help traders stay with the predominant trend until it shifts.
Keltner Channels (Volatility and Range):
Keltner Channels, based on an exponential moving average and Average True Range, form volatility-based envelopes around price. They help traders visualize whether price is extended (touching or moving outside the upper/lower band) or trading within a stable range. This can be useful in identifying low-volatility consolidations and high-volatility breakouts.
Dynamic Order Blocks (Approximations of Supply/Demand Zones):
By detecting pivot highs and lows under conditions of significant volume, the indicator approximates "order blocks." Order blocks are areas where institutional buying or selling may have occurred, potentially acting as future support or resistance zones. Although these approximations are not perfect, they offer a visual cue to areas on the chart where price might react strongly if revisited.
Volume Profile Proxy and Whale Detection:
The indicator highlights price levels associated with recent maximum volume activity, providing a rough "volume profile" reference. Such levels often become key points of price interaction.
"Whale" detection logic attempts to identify bars where exceptionally large volume occurs (beyond a defined threshold). By tracking these "whale bars," traders can infer where heavy participation—often from large traders or institutions—may influence market direction or create zones of interest.
Approximate Bid/Ask Volume and Dollar Volume Tracking:
The script estimates whether volume within each bar leans more towards the bid or the ask side, aiming to understand which participant (buyers or sellers) might have been more aggressive. Additionally, it calculates dollar volume (close price multiplied by volume) and provides an average to gauge the relative participation strength over time.
Labeling and Visual Aids:
Dynamic labels display Whale Frequency (the ratio of bars with exceptionally large volume), average dollar volume, and approximate ask/bid volume metrics. This gives traders at-a-glance insights into current market conditions, participation, and sentiment.
Strengths:
Multifaceted Analysis:
By combining trend, volatility, volume, and order block logic in one place, the indicator saves chart space and simplifies the analytical process. Traders gain a holistic view without flipping between multiple separate tools.
Adaptable to Market Conditions:
The use of ATR and Keltner Channels adapts to changing volatility conditions. The SuperTrend-like line helps keep traders aligned with the prevailing trend, avoiding constant whipsaws in choppy markets.
Volume-Based Insights:
Integrating whale detection and a crude volume profile proxy helps traders understand where large players might be interacting. This perspective can highlight critical levels that might not be evident from price action alone.
Convenient Visual Cues and Labels:
The indicator provides quick reference points and textual information about the underlying volume dynamics, making decision-making potentially faster and more informed.
Weaknesses:
Heuristic and Approximate Nature:
Many of the indicator’s features, like the "order blocks," "whale detection," and the approximate bid/ask volume, rely on heuristics and assumptions that may not always be accurate. Without actual Level II data or true volume profiles, the insights are best considered as supplementary, not definitive signals.
Lagging Components:
Indicators that rely on past data, like ATR-based trends or moving averages for Keltner Channels, inherently lag behind price. This can cause delayed signals, particularly in fast-moving markets, potentially missing some early opportunities or late in confirming market reversals.
No Guaranteed Predictive Power:
As with any technical tool, it does not forecast the future with certainty. Strong volume at a certain level or a bullish SuperTrend reading does not guarantee price will continue in that direction. Market conditions can change unexpectedly, and false signals will occur.
Complexity and Overreliance Risk:
With multiple signals combined, there’s a risk of information overload. Traders might feel compelled to rely too heavily on this one tool. Without complementary analysis (fundamentals, news, or additional technical confirmation), overreliance on the indicator could lead to misguided trades.
Conclusion:
This integrated indicator offers a comprehensive visual guide to market structure, volatility, and activity. Its strength lies in providing a multi-dimensional viewpoint in a single tool. However, traders should remain aware of its approximations, inherent lags, and the potential for conflicting signals. Sound risk management, position sizing, and the use of complementary analysis methods remain essential for trading success.
Risks Associated with Trading:
No indicator can guarantee profitable trades or accurately predict future price movements. Market conditions are inherently unpredictable, and reliance on any single tool or combination of tools carries the risk of financial loss. Traders should practice sound risk management, including the use of stop losses and position sizing, and should not trade with funds they cannot afford to lose. Ultimately, decisions should be guided by a thorough trading plan and possibly supplemented with other forms of market analysis or professional advice.
Risks and Important Considerations:
• Not a Standalone Tool:
• This indicator should not be used in isolation. It is essential to incorporate additional technical analysis tools, fundamental analysis, and market context when making trading decisions.
• Relying solely on this indicator may lead to incomplete assessments of market conditions.
• Market Volatility and False Signals:
• Financial markets can be highly volatile, and indicators based on historical data may not accurately predict future movements.
• The indicator may produce false signals due to sudden market changes, low liquidity, or atypical trading activity.
• Risk Management:
• Always employ robust risk management strategies, including setting stop-loss orders, diversifying your portfolio, and not over-leveraging positions.
• Understand that no indicator guarantees success, and losses are a natural part of trading.
• Emotional Discipline:
• Avoid making impulsive decisions based on indicator signals alone.
• Emotional trading can lead to significant financial losses; maintain discipline and adhere to a well-thought-out trading plan.
• Continuous Learning and Adaptation:
• Stay informed about market news, economic indicators, and global events that may impact trading conditions.
• Continuously evaluate and adjust your trading strategies as market dynamics evolve.
• Consultation with Professionals:
• Consider seeking advice from financial advisors or professional traders to understand better how this indicator can fit into your overall trading strategy.
• Professional guidance can provide personalized insights based on your financial goals and risk tolerance.
Disclaimer:
Trading financial instruments involves substantial risk and may not be suitable for all investors. Past performance is not indicative of future results. This indicator is provided for informational and educational purposes only and should not be considered investment advice. Always conduct your own research and consult with a licensed financial professional before making any trading decisions.
Note: The effectiveness of any technical indicator can vary based on market conditions and individual trading styles. It's crucial to test indicators thoroughly using historical data and possibly paper trading before applying them in live trading scenarios.

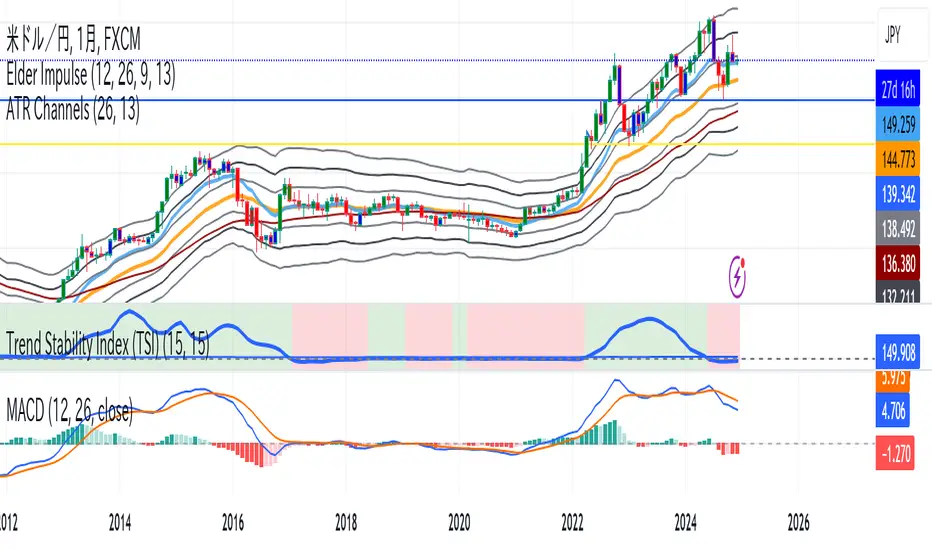
Trend Stability Index (TSI)Overview
The Trend Stability Index (TSI) is a technical analysis tool designed to evaluate the stability of a market trend by analyzing both price movements and trading volume. By combining these two crucial elements, the TSI provides traders with insights into the strength and reliability of ongoing trends, assisting in making informed trading decisions.
Key Features
• Dual Analysis: Integrates price changes and volume fluctuations to assess trend stability.
• Customizable Periods: Allows users to set evaluation periods for both trend and volume based on their trading preferences.
• Visual Indicators: Displays the Trend Stability Index as a line chart, highlights neutral zones, and uses background colors to indicate trend stability or instability.
Configuration Settings
1. Trend Length (trendLength)
• Description: Determines the number of periods over which the price stability is evaluated.
• Default Value: 15
• Usage: A longer trend length smooths out short-term volatility, providing a clearer picture of the overarching trend.
2. Volume Length (volumeLength)
• Description: Sets the number of periods over which trading volume changes are assessed.
• Default Value: 15
• Usage: Adjusting the volume length helps in capturing significant volume movements that may influence trend strength.
Calculation Methodology
The Trend Stability Index is calculated through a series of steps that analyze both price and volume changes:
1. Price Change Rate (priceChange)
• Calculation: Utilizes the Rate of Change (ROC) function on the closing prices over the specified trendLength.
• Purpose: Measures the percentage change in price over the trend evaluation period, indicating the direction and momentum of the price movement.
2. Volume Change Rate (volumeChange)
• Calculation: Applies the Rate of Change (ROC) function to the trading volume over the specified volumeLength.
• Purpose: Assesses the percentage change in trading volume, providing insight into the conviction behind price movements.
3. Trend Stability (trendStability)
• Calculation: Multiplies priceChange by volumeChange.
• Purpose: Combines price and volume changes to gauge the overall stability of the trend. A higher positive value suggests a strong and stable trend, while negative values may indicate trend weakness or reversal.
4. Trend Stability Index (TSI)
• Calculation: Applies a Simple Moving Average (SMA) to the trendStability over the trendLength period.
• Purpose: Smooths the trend stability data to create a more consistent and interpretable index.
Trend/Ranging Determination
• Stable Trend (isStable)
• Condition: When the TSI value is greater than 0.
• Interpretation: Indicates that the current trend is stable and likely to continue in its direction.
• Unstable Trend / Range-bound Market
• Condition: When the TSI value is less than or equal to 0.
• Interpretation: Suggests that the trend may be weakening, reversing, or that the market is moving sideways without a clear direction.
Visualization
The TSI indicator employs several visual elements to convey information effectively:
1. TSI Line
• Representation: Plotted as a blue line.
• Purpose: Displays the Trend Stability Index values over time, allowing traders to observe trend stability dynamics.
2. Neutral Horizontal Line
• Representation: A gray horizontal line at the 0 level.
• Purpose: Serves as a reference point to distinguish between stable and unstable trends.
3. Background Color
• Stable Trend: Green background with 80% transparency when isStable is true.
• Unstable Trend: Red background with 80% transparency when isStable is false.
• Purpose: Provides an immediate visual cue about the current trend’s stability, enhancing the interpretability of the indicator.
Usage Guidelines
• Identifying Trend Strength: Utilize the TSI to confirm the strength of existing trends. A consistently positive TSI suggests strong trend momentum, while a negative TSI may signal caution or a potential reversal.
• Volume Confirmation: The integration of volume changes helps in validating price movements. Significant price changes accompanied by corresponding volume shifts can reinforce the reliability of the trend.
• Entry and Exit Signals: Traders can use crossovers of the TSI with the neutral line (0 level) as potential entry or exit points. For instance, a crossover from below to above 0 may indicate a bullish trend initiation, while a crossover from above to below 0 could suggest bearish momentum.
• Combining with Other Indicators: To enhance trading strategies, consider using the TSI in conjunction with other technical indicators such as Moving Averages, RSI, or MACD for comprehensive market analysis.
Example Scenario
Imagine analyzing a stock with the following observations using the TSI:
• The TSI has been consistently above 0 for the past 30 periods, accompanied by increasing trading volume. This scenario indicates a strong and stable uptrend, suggesting that buying opportunities may be favorable.
• Conversely, if the TSI drops below 0 while the price remains relatively flat and volume decreases, it may imply that the current trend is losing momentum, and the market could be entering a consolidation phase or preparing for a trend reversal.
Conclusion
The Trend Stability Index is a valuable tool for traders seeking to assess the reliability and strength of market trends by integrating price and volume dynamics. Its customizable settings and clear visual indicators make it adaptable to various trading styles and market conditions. By incorporating the TSI into your trading analysis, you can enhance your ability to identify and act upon stable and profitable trends.
MultiLayer Awesome Oscillator Saucer Strategy [Skyrexio]Overview
MultiLayer Awesome Oscillator Saucer Strategy leverages the combination of Awesome Oscillator (AO), Williams Alligator, Williams Fractals and Exponential Moving Average (EMA) to obtain the high probability long setups. Moreover, strategy uses multi trades system, adding funds to long position if it considered that current trend has likely became stronger. Awesome Oscillator is used for creating signals, while Alligator and Fractal are used in conjunction as an approximation of short-term trend to filter them. At the same time EMA (default EMA's period = 100) is used as high probability long-term trend filter to open long trades only if it considers current price action as an uptrend. More information in "Methodology" and "Justification of Methodology" paragraphs. The strategy opens only long trades.
Unique Features
No fixed stop-loss and take profit: Instead of fixed stop-loss level strategy utilizes technical condition obtained by Fractals and Alligator to identify when current uptrend is likely to be over (more information in "Methodology" and "Justification of Methodology" paragraphs)
Configurable Trading Periods: Users can tailor the strategy to specific market windows, adapting to different market conditions.
Multilayer trades opening system: strategy uses only 10% of capital in every trade and open up to 5 trades at the same time if script consider current trend as strong one.
Short and long term trend trade filters: strategy uses EMA as high probability long-term trend filter and Alligator and Fractal combination as a short-term one.
Methodology
The strategy opens long trade when the following price met the conditions:
1. Price closed above EMA (by default, period = 100). Crossover is not obligatory.
2. Combination of Alligator and Williams Fractals shall consider current trend as an upward (all details in "Justification of Methodology" paragraph)
3. Awesome Oscillator shall create the "Saucer" long signal (all details in "Justification of Methodology" paragraph). Buy stop order is placed one tick above the candle's high of last created "Saucer signal".
4. If price reaches the order price, long position is opened with 10% of capital.
5. If currently we have opened position and price creates and hit the order price of another one "Saucer" signal another one long position will be added to the previous with another one 10% of capital. Strategy allows to open up to 5 long trades simultaneously.
6. If combination of Alligator and Williams Fractals shall consider current trend has been changed from up to downtrend, all long trades will be closed, no matter how many trades has been opened.
Script also has additional visuals. If second long trade has been opened simultaneously the Alligator's teeth line is plotted with the green color. Also for every trade in a row from 2 to 5 the label "Buy More" is also plotted just below the teeth line. With every next simultaneously opened trade the green color of the space between teeth and price became less transparent.
Strategy settings
In the inputs window user can setup strategy setting: EMA Length (by default = 100, period of EMA, used for long-term trend filtering EMA calculation). User can choose the optimal parameters during backtesting on certain price chart.
Justification of Methodology
Let's go through all concepts used in this strategy to understand how they works together. Let's start from the easies one, the EMA. Let's briefly explain what is EMA. The Exponential Moving Average (EMA) is a type of moving average that gives more weight to recent prices, making it more responsive to current price changes compared to the Simple Moving Average (SMA). It is commonly used in technical analysis to identify trends and generate buy or sell signals. It can be calculated with the following steps:
1.Calculate the Smoothing Multiplier:
Multiplier = 2 / (n + 1), Where n is the number of periods.
2. EMA Calculation
EMA = (Current Price) × Multiplier + (Previous EMA) × (1 − Multiplier)
In this strategy uses EMA an initial long term trend filter. It allows to open long trades only if price close above EMA (by default 50 period). It increases the probability of taking long trades only in the direction of the trend.
Let's go to the next, short-term trend filter which consists of Alligator and Fractals. Let's briefly explain what do these indicators means. The Williams Alligator, developed by Bill Williams, is a technical indicator designed to spot trends and potential market reversals. It uses three smoothed moving averages, referred to as the jaw, teeth, and lips:
Jaw (Blue Line): The slowest of the three, based on a 13-period smoothed moving average shifted 8 bars ahead.
Teeth (Red Line): The medium-speed line, derived from an 8-period smoothed moving average shifted 5 bars forward.
Lips (Green Line): The fastest line, calculated using a 5-period smoothed moving average shifted 3 bars forward.
When these lines diverge and are properly aligned, the "alligator" is considered "awake," signaling a strong trend. Conversely, when the lines overlap or intertwine, the "alligator" is "asleep," indicating a range-bound or sideways market. This indicator assists traders in identifying when to act on or avoid trades.
The Williams Fractals, another tool introduced by Bill Williams, are used to pinpoint potential reversal points on a price chart. A fractal forms when there are at least five consecutive bars, with the middle bar displaying the highest high (for an up fractal) or the lowest low (for a down fractal), relative to the two bars on either side.
Key Points:
Up Fractal: Occurs when the middle bar has a higher high than the two preceding and two following bars, suggesting a potential downward reversal.
Down Fractal: Happens when the middle bar shows a lower low than the surrounding two bars, hinting at a possible upward reversal.
Traders often combine fractals with other indicators to confirm trends or reversals, improving the accuracy of trading decisions.
How we use their combination in this strategy? Let’s consider an uptrend example. A breakout above an up fractal can be interpreted as a bullish signal, indicating a high likelihood that an uptrend is beginning. Here's the reasoning: an up fractal represents a potential shift in market behavior. When the fractal forms, it reflects a pullback caused by traders selling, creating a temporary high. However, if the price manages to return to that fractal’s high and break through it, it suggests the market has "changed its mind" and a bullish trend is likely emerging.
The moment of the breakout marks the potential transition to an uptrend. It’s crucial to note that this breakout must occur above the Alligator's teeth line. If it happens below, the breakout isn’t valid, and the downtrend may still persist. The same logic applies inversely for down fractals in a downtrend scenario.
So, if last up fractal breakout was higher, than Alligator's teeth and it happened after last down fractal breakdown below teeth, algorithm considered current trend as an uptrend. During this uptrend long trades can be opened if signal was flashed. If during the uptrend price breaks down the down fractal below teeth line, strategy considered that uptrend is finished with the high probability and strategy closes all current long trades. This combination is used as a short term trend filter increasing the probability of opening profitable long trades in addition to EMA filter, described above.
Now let's talk about Awesome Oscillator's "Sauser" signals. Briefly explain what is the Awesome Oscillator. The Awesome Oscillator (AO), created by Bill Williams, is a momentum-based indicator that evaluates market momentum by comparing recent price activity to a broader historical context. It assists traders in identifying potential trend reversals and gauging trend strength.
AO = SMA5(Median Price) − SMA34(Median Price)
where:
Median Price = (High + Low) / 2
SMA5 = 5-period Simple Moving Average of the Median Price
SMA 34 = 34-period Simple Moving Average of the Median Price
Now we know what is AO, but what is the "Saucer" signal? This concept was introduced by Bill Williams, let's briefly explain it and how it's used by this strategy. Initially, this type of signal is a combination of the following AO bars: we need 3 bars in a row, the first one shall be higher than the second, the third bar also shall be higher, than second. All three bars shall be above the zero line of AO. The price bar, which corresponds to third "saucer's" bar is our signal bar. Strategy places buy stop order one tick above the price bar which corresponds to signal bar.
After that we can have the following scenarios.
Price hit the order on the next candle in this case strategy opened long with this price.
Price doesn't hit the order price, the next candle set lower low. If current AO bar is increasing buy stop order changes by the script to the high of this new bar plus one tick. This procedure repeats until price finally hit buy order or current AO bar become decreasing. In the second case buy order cancelled and strategy wait for the next "Saucer" signal.
If long trades has been opened strategy use all the next signals until number of trades doesn't exceed 5. All trades are closed when the trend changes to downtrend according to combination of Alligator and Fractals described above.
Why we use "Saucer" signals? If AO above the zero line there is a high probability that price now is in uptrend if we take into account our two trend filters. When we see the decreasing bars on AO and it's above zero it's likely can be considered as a pullback on the uptrend. When we see the stop of AO decreasing and the first increasing bar has been printed there is a high probability that this local pull back is finished and strategy open long trade in the likely direction of a main trend.
Why strategy use only 10% per signal? Sometimes we can see the false signals which appears on sideways. Not risking that much script use only 10% per signal. If the first long trade has been open and price continue going up and our trend approximation by Alligator and Fractals is uptrend, strategy add another one 10% of capital to every next saucer signal while number of active trades no more than 5. This capital allocation allows to take part in long trades when current uptrend is likely to be strong and use only 10% of capital when there is a high probability of sideways.
Backtest Results
Operating window: Date range of backtests is 2023.01.01 - 2024.11.25. It is chosen to let the strategy to close all opened positions.
Commission and Slippage: Includes a standard Binance commission of 0.1% and accounts for possible slippage over 5 ticks.
Initial capital: 10000 USDT
Percent of capital used in every trade: 10%
Maximum Single Position Loss: -5.10%
Maximum Single Profit: +22.80%
Net Profit: +2838.58 USDT (+28.39%)
Total Trades: 107 (42.99% win rate)
Profit Factor: 3.364
Maximum Accumulated Loss: 373.43 USDT (-2.98%)
Average Profit per Trade: 26.53 USDT (+2.40%)
Average Trade Duration: 78 hours
These results are obtained with realistic parameters representing trading conditions observed at major exchanges such as Binance and with realistic trading portfolio usage parameters.
How to Use
Add the script to favorites for easy access.
Apply to the desired timeframe and chart (optimal performance observed on 3h BTC/USDT).
Configure settings using the dropdown choice list in the built-in menu.
Set up alerts to automate strategy positions through web hook with the text: {{strategy.order.alert_message}}
Disclaimer:
Educational and informational tool reflecting Skyrex commitment to informed trading. Past performance does not guarantee future results. Test strategies in a simulated environment before live implementation

BTCUSD Momentum After Abnormal DaysThis indicator identifies abnormal days in the Bitcoin market (BTCUSD) based on daily returns exceeding specific thresholds defined by a statistical approach. It is inspired by the findings of Caporale and Plastun (2020), who analyzed the cryptocurrency market's inefficiencies and identified exploitable patterns, particularly around abnormal returns.
Key Concept:
Abnormal Days:
Days where the daily return significantly deviates (positively or negatively) from the historical average.
Positive abnormal days: Returns exceed the mean return plus k times the standard deviation.
Negative abnormal days: Returns fall below the mean return minus k times the standard deviation.
Momentum Effect:
As described in the academic paper, on abnormal days, prices tend to move in the direction of the abnormal return until the end of the trading day, creating momentum effects. This can be leveraged by traders for profit opportunities.
How It Works:
Calculation:
The script calculates the daily return as the percentage difference between the open and close prices. It then derives the mean and standard deviation of returns over a configurable lookback period.
Thresholds:
The script dynamically computes upper and lower thresholds for abnormal days using the mean and standard deviation. Days exceeding these thresholds are flagged as abnormal.
Visualization:
The mean return and thresholds are plotted as dynamic lines.
Abnormal days are visually highlighted with transparent green (positive) or red (negative) backgrounds on the chart.
References:
This indicator is based on the methodology discussed in "Momentum Effects in the Cryptocurrency Market After One-Day Abnormal Returns" by Caporale and Plastun (2020). Their research demonstrates that hourly returns during abnormal days exhibit a strong momentum effect, moving in the same direction as the abnormal return. This behavior contradicts the efficient market hypothesis and suggests profitable trading opportunities.
"Prices tend to move in the direction of abnormal returns till the end of the day, which implies the existence of a momentum effect on that day giving rise to exploitable profit opportunities" (Caporale & Plastun, 2020).

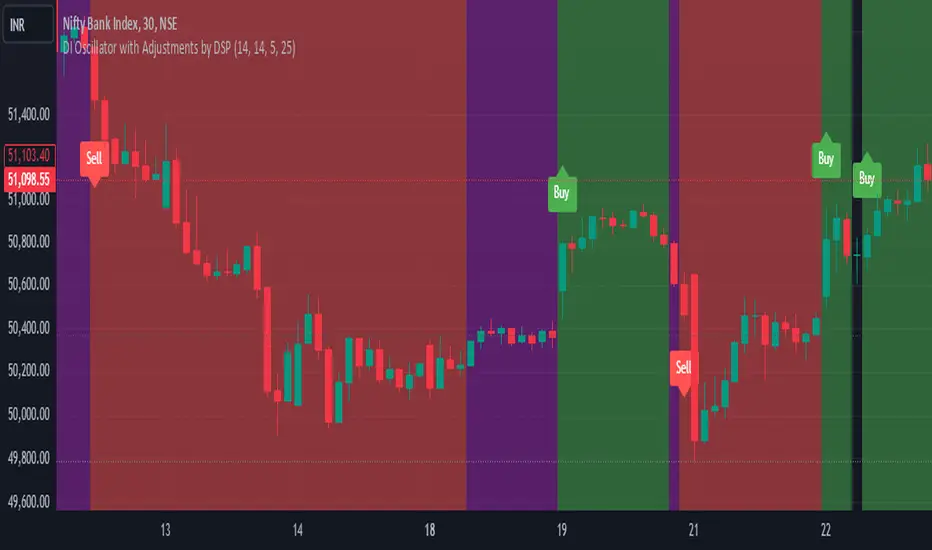
DI Oscillator with Adjustments by DSPDI Oscillator with Adjustments by DSP – High-Volatility Commodity Trading Tool 📈💥
Maximize Your Trading Efficiency in volatile commodity markets with the DI Oscillator with Adjustments by DSP. This unique indicator combines the classic +DI and -DI (Directional Indicators) with advanced adjustments that help you identify key trends and reversals in highly volatile conditions.
Whether you're trading commodities, forex, or stocks, this tool is engineered to help you navigate price fluctuations and make timely, informed decisions. Let this powerful tool guide you through turbulent market conditions with ease!
Key Features:
Dynamic Background Color Shifts 🌈:
Green Background: Signals a strong uptrend where +DI is clearly above -DI, and the trend is supported by clear separation between the two indicators.
Red Background: Signals a strong downtrend where -DI is above +DI, indicating bearish pressure.
Violet Background: Shows a neutral or consolidating market where the +DI and -DI lines are closely interwoven, giving you a clear picture of sideways movement.
Buy and Sell Labels 📊:
Buy Signal: Automatically triggers when the background changes to green, indicating a potential entry point during a bullish trend.
Sell Signal: Automatically triggers when the background shifts from purple to red, indicating a bearish trend reversal.
Labels are positioned away from the bars, ensuring your chart remains uncluttered and easy to read.
Enhanced Adjustments for Volatile Markets ⚡:
Custom adjustments based on consecutive green or red bars (excluding “sandwiched” bars) provide you with more nuanced signals, improving the accuracy of trend detection in volatile conditions.
Horizontal Line Reference 📏:
Set a custom horizontal level to mark significant price levels that may act as resistance or support, helping you identify key price points in volatile market swings.
Separation Threshold 🧮:
A custom separation threshold defines when the +DI and -DI lines are far enough apart to confirm a strong trend. This is crucial for commodity markets that experience rapid price changes and fluctuations.
Visual Clarity ✨:
Both +DI and -DI lines are plotted clearly in green and red, respectively, with a dedicated background color system that makes trend shifts visually intuitive.
Why This Indicator Works for Volatile Commodities 🌍📊:
Commodity markets are notorious for their volatility, with prices often experiencing rapid and unpredictable movements. This indicator gives you clear visual cues about trend strength and reversals, enabling you to act quickly and confidently.
By adjusting the +DI based on consecutive green and red bars, this tool adapts to the specific price action in high-volatility conditions, helping you stay ahead of the curve.
The background color system ensures that you can visually track market trends at a glance, making it easier to make split-second decisions without missing opportunities.
How to Use:
Add the Indicator: Simply add the DI Oscillator with Adjustments by DSP to your TradingView chart.
Watch for Background Color Shifts: Stay alert for the background color to shift from violet to green (for buy) or purple to red (for sell), signaling potential trade opportunities.
Set Alerts: Receive notifications when background color changes, providing you with real-time alerts to keep track of market movements.
Interpret the DI Lines: Use the +DI and -DI lines to gauge trend strength and adjust your strategy accordingly.
Who Can Benefit:
Day Traders: Take advantage of quick trend reversals and high volatility in commodities markets, such as gold, oil, or agricultural products.
Swing Traders: Identify key trend shifts over longer periods, making it easier to enter or exit trades during major price movements.
Risk Managers: Use this tool’s visual cues to better understand price fluctuations and adjust your position sizes according to market conditions.
💡 Unlock Your Potential with the DI Oscillator 💡
For traders in high-volatility commodity markets, this indicator is a game-changer. It simplifies the complexity of trend analysis and gives you the actionable insights you need to make fast, profitable decisions. Whether you're trading gold, oil, or other volatile commodities, the DI Oscillator with Adjustments by DSP can help you navigate market chaos and make better-informed trades.
Don’t miss out — enhance your trading strategy today with this powerful tool and stay ahead in any market environment!
SMB MagicSMB Magic
Overview: SMB Magic is a powerful technical strategy designed to capture breakout opportunities based on price movements, volume spikes, and trend-following logic. This strategy works exclusively on the XAU/USD symbol and is optimized for the 15-minute time frame. By incorporating multiple factors, this strategy identifies high-probability trades with a focus on risk management.
Key Features:
Breakout Confirmation:
This strategy looks for price breakouts above the previous high or below the previous low, with a significant volume increase. A breakout is considered valid when it is supported by strong volume, confirming the strength of the price move.
Price Movement Filter:
The strategy ensures that only significant price movements are considered for trades, helping to avoid low-volatility noise. This filter targets larger price swings to maximize potential profits.
Exponential Moving Average (EMA):
A long-term trend filter is applied to ensure that buy trades occur only when the price is above the moving average, and sell trades only when the price is below it.
Fibonacci Levels:
Custom Fibonacci retracement levels are drawn based on recent price action. These levels act as dynamic support and resistance zones and help determine the exit points for trades.
Take Profit/Stop Loss:
The strategy incorporates predefined take profit and stop loss levels, designed to manage risk effectively. These levels are automatically applied to trades and are adjusted based on the market's volatility.
Volume Confirmation:
A volume multiplier confirms the strength of the breakout. A trade is only considered when the volume exceeds a certain threshold, ensuring that the breakout is supported by sufficient market participation.
How It Works:
Entry Signals:
Buy Signal: A breakout above the previous high, accompanied by significant volume and price movement, occurs when the price is above the trend-following filter (e.g., EMA).
Sell Signal: A breakout below the previous low, accompanied by significant volume and price movement, occurs when the price is below the trend-following filter.
Exit Strategy:
Each position (long or short) has predefined take-profit and stop-loss levels, which are designed to protect capital and lock in profits at key points in the market.
Fibonacci Levels:
Fibonacci levels are drawn to identify potential areas of support or resistance, which can be used to guide exits and stop-loss placements.
Important Notes:
Timeframe Restriction: This strategy is designed specifically for the 15-minute time frame.
Symbol Restriction: The strategy works exclusively on the XAU/USD (Gold) symbol and is not recommended for use with other instruments.
Best Performance in Trending Markets: It works best in trending conditions where breakouts occur frequently.
Disclaimer:
Risk Warning: Trading involves risk, and past performance is not indicative of future results. Always conduct your own research and make informed decisions before trading.

Roman's Ranges(GOLD FUTURES)This indicator provides the user with Gold Future's previous day’s range and how long it took for the price to reach its first extreme for the day. This information is used to predict the most probable daily direction trend and estimate how long you should expect to hold your winning trade. The distance and time are based on the market open candle (6:30 am). It measures from the retracement wick of the candle to the last 5m close of the day’s first extreme low or high point. It also includes that distance in pts.
Previous market data does not guarantee future results, however, you can leverage the knowledge of the previous day’s ranges to set reasonable take profit levels and when your target is not met automatically, you know how long it took on the previous day to reach the day’s first low/high. If you are nearing that amount of time and your trade is not as profitable as expected, it is easier to get out with less profits using this estimated time rather than hoping the market closes in your favor.
Markets go through cycles and it can be difficult to trade them all if you have a fault expectation how how far the price is expected to move. Price tends to deviate slowly from the average ranges slightly day after day, but you can expect an average range to prevail throughout the week +/- 3 points. It can be very easy to be stuck on 5-point take-profit levels that you don’t pay attention to the average range being twice or three times that distance. The same can be said for the opposite scenario with having higher profit expectations than reasonably possible.
This indicator and my statements are not financial advice. This is meant for educational purposes only.

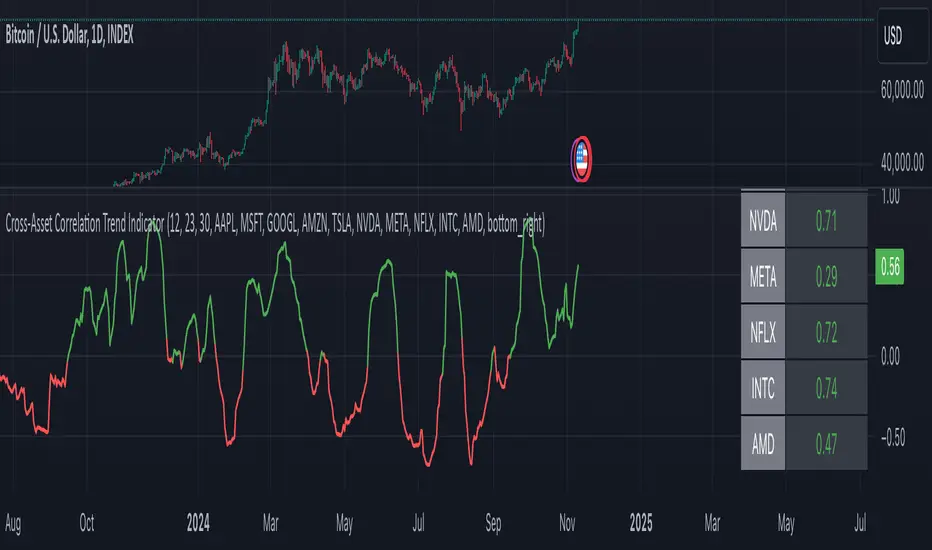
Cross-Asset Correlation Trend IndicatorCross-Asset Correlation Trend Indicator
This indicator uses correlations between the charted asset and ten others to calculate an overall trend prediction. Each ticker is configurable, and by analyzing the trend of each asset, the indicator predicts an average trend for the main asset on the chart. The strength of each asset's trend is weighted by its correlation to the charted asset, resulting in a single average trend signal. This can be a rather robust and effective signal, though it is often slow.
Functionality Overview :
The Cross-Asset Correlation Trend Indicator calculates the average trend of a charted asset based on the correlation and trend of up to ten other assets. Each asset is assigned a trend signal using a simple EMA crossover method (two customizable EMAs). If the shorter EMA crosses above the longer one, the asset trend is marked as positive; if it crosses below, the trend is negative. Each trend is then weighted by the correlation coefficient between that asset’s closing price and the charted asset’s closing price. The final output is an average weighted trend signal, which combines each trend with its respective correlation weight.
Input Parameters :
EMA 1 Length : Sets the period of the shorter EMA used to determine trends.
EMA 2 Length : Sets the period of the longer EMA used to determine trends.
Correlation Length : Defines the lookback period used for calculating the correlation between the charted asset and each of the other selected assets.
Asset Tickers : Each of the ten tickers is configurable, allowing you to set specific assets to analyze correlations with the charted asset.
Show Trend Table : Toggle to show or hide a table with each asset’s weighted trend. The table displays green, red, or white text for each weighted trend, indicating positive, negative, or neutral trends, respectively.
Table Position : Choose the position of the trend table on the chart.
Recommended Use :
As always, it’s essential to backtest the indicator thoroughly on your chosen asset and timeframe to ensure it aligns with your strategy. Feel free to modify the input parameters as needed—while the defaults work well for me, they may need adjustment to better suit your assets, timeframes, and trading style.
As always, I wish you the best of luck and immense fortune as you develop your systems. May this indicator help you make well-informed, profitable decisions!
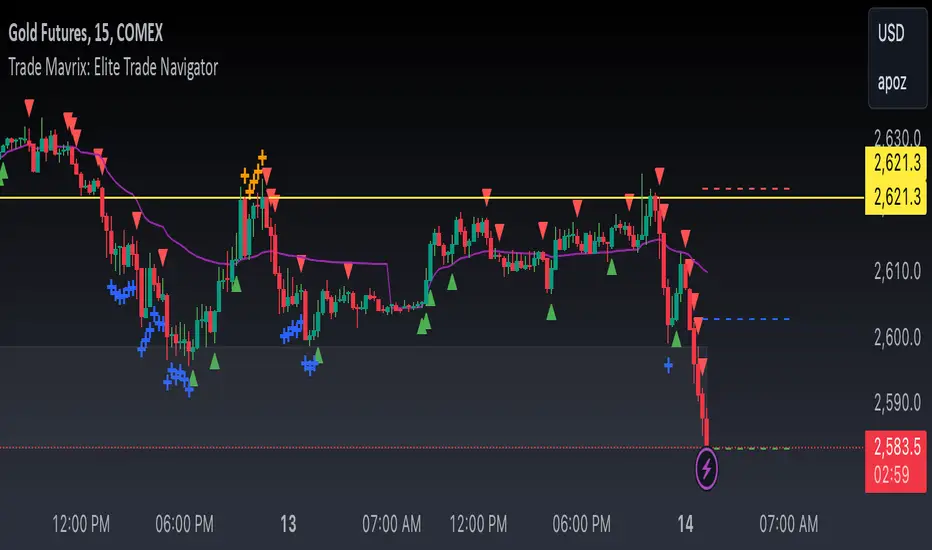
Trade Mavrix: Elite Trade NavigatorYour ultimate trading companion that helps you spot profitable breakouts, perfect pullbacks, and crucial support & resistance levels. Ready to take your trading to the next level? Let's dive in!
ORB with ATR Trailing SL [Bluechip Algos]This is a simple ORB (Opening Range Breakout) Indicator that not only signals breakout directions based on the opening session range but also includes trailing stop levels to manage ongoing trades. Instead of regular fixed Stop loss, we use ATR indicator (ATR based SL) to trail the stop loss that might help in maximizing the profitable trades. This helps especially during the trending days where market moves unidirectionally.
About the Indicator
Opening Range Identification: The indicator defines an initial session timeframe and captures the highest and lowest prices during this period.
Breakout Signals: It signals potential entry points when the price crosses these range boundaries.
Trailing Stop Calculation: Customizable trailing stop-loss based on ATR percentage, helping users lock in profits.
Features
Session Customization: User-defined session for setting the opening range.
Entry Signal Customization: Allows configuration for breakouts on either a closing basis or upon touching the level.
Automatic Stop-Loss Adjustments: Dynamic trailing stop levels that adapt to both long and short entries.
Visual Display: Highlights breakout levels and plots lines representing stop-loss levels.
Understanding the Indicator
Range Calculation: After defining the session, the high and low of the session are locked. The high serves as the upper breakout boundary, and the low as the lower boundary.
Signals (Buy and Sell): The indicator uses crossover conditions:
Buy Signal ("B") when price crosses above the ORB high.
Sell Signal ("S") when price crosses below the ORB low.
Trail Stop Calculation: When a signal is triggered, a trailing stop level is set and updates as the trade progresses:
Long positions have a stop-loss based on a percentage below the last closing price.
Short positions have a stop-loss based on a percentage above the last closing price.
Input Parameters
Session Time (ORB Session Time): Start and end times for setting the ORB range.
Signal Configuration: Choice between "CLOSE" (signal on close) or "TOUCH" (signal as soon as level is touched).
ATR Percentage: Sets the percentage for the trailing stop calculation.
Implied Fair Value Gap (IFVG) ICT [TradingFinder] Hidden FVG OTE🔵 Introduction
The Implied Fair Value Gap (IFVG) is distinctive due to its unique three-candlestick formation, which differentiates it from conventional Fair Value Gaps.
Implied fair value represents an estimated worth of an asset—often a business or its goodwill—based on the price likely to be received in a structured transaction between market participants at a specific point in time.
In the ever-evolving world of technical analysis, pinpointing price reversal points and market anomalies can significantly enhance trading strategies and decision-making for traders and investors. Among the advanced concepts gaining traction in this field is the Implied Fair Value Gap (IFVG), introduced by the renowned analyst Inner Circle Trader (ICT).
This tool has proven to be an effective method for identifying hidden supply and demand zones in financial markets, offering a unique edge to traders looking for high-probability setups.
Unlike traditional gaps that are visible on price charts, IFVG is a hidden gap that doesn’t appear explicitly on the chart and thus requires specialized technical analysis tools for accurate identification.
This hidden gap can signal potential price reversals and offers traders insight into high-liquidity areas where price is likely to react. This article will guide you through using the ICT Implied Fair Value Gap Indicator effectively, covering its settings, usage strategies, and key features to help you make informed decisions in the market.
🟣 Bullish Implied FVG
🟣 Bearish Implied FVG
🔵 How to Use
The IFVG indicator is designed to assist traders in recognizing hidden support and resistance zones by identifying Bullish and Bearish IFVG patterns. With this tool, traders can make better-informed decisions about suitable entry and exit points for their trades based on these patterns.
🟣 Bullish Implied Fair Value Gap
This pattern occurs in an uptrend when a large bullish candlestick forms, with the wicks of the previous and following candles overlapping the body of the central candlestick.
This overlap creates a demand zone or a hidden support level, which can act as an ideal entry point for buy trades. Often, when the price returns to this area, it is likely to resume its upward trend, presenting a profitable buying opportunity.
🟣 Bearish Implied Fair Value Gap
This pattern is similar but forms in downtrends. Here, a large bearish candlestick appears on the chart, with the wicks of adjacent candles overlapping its body. This overlap defines a supply zone or a hidden resistance level and serves as a signal for potential sell trades.
When the price returns to this zone, it often continues its downward trend, providing an optimal point for entering sell trades.
The IFVG indicator also includes various filters that traders can use to refine their analysis based on market conditions. These filters, including Very Aggressive, Aggressive, Defensive, and Very Defensive, allow users to customize the IFVG zones' width, offering flexibility according to the trader’s risk tolerance and trading style.
🟣 Example Trading Scenarios
Suppose you’re in a strong uptrend and the IFVG indicator identifies a Bullish IFVG zone. In this scenario, you could consider entering a buy trade when the price retraces to this zone, expecting the uptrend to resume. Conversely, in a downtrend, a Bearish IFVG zone can signal a favorable entry point for short trades when the price revisits this area.
🔵 Settings
Implied Block Validity Period: This parameter specifies the validity period of each identified block, taking into account the number of bars that have passed since its formation. Proper adjustment of this period helps traders focus only on relevant zones, increasing the accuracy of the analysis.
Mitigation Level OB : This option defines the mitigation level for supply and demand blocks (Order Blocks), with settings including Proximal, 50% OB, and Distal.
Depending on the selected level, the indicator will focus on closer, mid-range, or farther points for block identification, allowing traders to adjust for the level of precision required.
Implied Filter : Activating this filter allows traders to apply conditions based on the width of the IFVG zones. With options like Very Aggressive and Very Defensive, traders can control the width of IFVG zones to suit their risk management strategy—whether they prefer high-risk setups or low-risk setups.
Display and Color Settings : This section enables users to customize the appearance of the IFVG zones on their charts. Traders can set different colors for Bullish and Bearish zones, allowing for easier distinction and improved visualization.
Alert Settings : One of the standout features of the IFVG indicator is the alert system. By setting up alerts, users can be notified whenever the price approaches a demand or supply zone.
Alerts can be customized to trigger Once Per Bar (one alert per bar) or Per Bar Close (alert at the close of each bar), ensuring that traders stay updated on critical price movements without needing to monitor the chart continuously.
🔵 Conclusion
The ICT Implied Fair Value Gap (IFVG) indicator is a powerful and sophisticated tool in technical analysis, allowing professional traders to identify hidden supply and demand zones and use them as entry and exit points for buy and sell trades.
This indicator’s automatic detection of IFVG zones helps traders uncover hidden trading opportunities that can enhance their analysis.
While the IFVG indicator offers numerous advantages, it is important to use it in conjunction with other technical analysis tools and sound risk management practices.
IFVG alone does not guarantee profitability in trading; it works best when combined with other indicators such as volume analysis and trend-following indicators for a comprehensive trading strategy.

VolWRSI### Description of the `VolWRSI` Script
The `VolWRSI` script is a TradingView Pine Script indicator designed to provide a volume-weighted Relative Strength Index (RSI) combined with abnormal activity detection in both volume and price. This multi-faceted approach aims to enhance trading decisions by identifying potential market conditions influenced by both price movements and trading volume.
#### Key Features
1. **Volume-Weighted RSI Calculation**:
- The core of the script calculates a volume-weighted RSI, which gives more significance to price movements associated with higher volume. This helps traders understand the strength of price movements more accurately.
2. **Abnormal Activity Detection**:
- The script includes calculations for abnormal volume and price changes using standard deviation (SD) multiples. This feature alerts traders to potential unusual activity, which could indicate upcoming volatility or market manipulation.
3. **Market Structure Filtering**:
- The script assesses market structure by identifying pivot highs and lows, allowing for better contextual analysis of price movements. This includes identifying bearish and bullish divergences, which can signal potential reversals.
4. **Color-Coded Signals**:
- The indicator visually represents market conditions using different bar colors for various scenarios, such as bearish divergence, likely price manipulation, and high-risk moves on low volume. This allows traders to quickly assess market conditions at a glance.
5. **Conditional Signal Line**:
- The signal line is displayed only when institutional activity conditions are met, remaining hidden otherwise. This adds an extra layer of filtering to prevent unnecessary signals, focusing only on significant market moves.
6. **Overbought and Oversold Levels**:
- The script defines overbought and oversold thresholds, enhancing the trader's ability to spot potential reversal points. Color gradients help visually distinguish between these critical levels.
7. **Alerts**:
- The script includes customizable alert conditions for various market signals, including abnormal volume spikes and RSI crossings over specific thresholds. This keeps traders informed in real-time, enhancing their ability to act promptly.
#### Benefits of Using the `VolWRSI` Script
- **Enhanced Decision-Making**: By integrating volume into the RSI calculation, the script helps traders make more informed decisions based on the strength of price movements rather than price alone.
- **Early Detection of Market Manipulation**: The abnormal activity detection can help traders identify potentially manipulative market behavior, allowing them to act or adjust their strategies accordingly.
- **Visual Clarity**: The use of color-coding and graphical elements (such as shapes and fills) provides clear visual cues about market conditions, which can be especially beneficial for traders who rely on quick visual assessments.
- **Risk Management**: The identification of high-risk low-volume moves helps traders manage their exposure better, potentially avoiding trades that may lead to unfavorable outcomes.
- **Reduced Noise with Institutional Activity Filtering**: The conditional signal line only plots when institutional activity conditions are detected, providing higher confidence in signals by excluding lower-conviction setups.
- **Customization**: With adjustable parameters for length, thresholds, and colors, traders can tailor the script to their specific trading styles and preferences.
Overall, the `VolWRSI` script combines technical analysis tools in a coherent framework, aiming to provide traders with deeper insights into market dynamics and higher-quality trade signals, potentially leading to more profitable trading decisions.

Bullish B's - RSI Divergence StrategyThis indicator strategy is an RSI (Relative Strength Index) divergence trading tool designed to identify high-probability entry and exit points based on trend shifts. It utilizes both regular and hidden RSI divergence patterns to spot potential reversals, with signals for both bullish and bearish conditions.
Key Features
Divergence Detection:
Bullish Divergence: Signals when RSI indicates momentum strengthening at a lower price level, suggesting a reversal to the upside.
Bearish Divergence: Signals when RSI shows weakening momentum at a higher price level, indicating a potential downside reversal.
Hidden Divergences: Looks for hidden bullish and bearish divergences, which signal trend continuation points where price action aligns with the prevailing trend.
Volume-Adjusted Entry Signals:
The strategy enters long trades when RSI shows bullish or hidden bullish divergence, indicating an upward momentum shift.
An optional volume filter ensures that only high-volume, high-conviction trades trigger a signal.
Exit Signals:
Exits long positions when RSI reaches a customizable overbought level, typically indicating a potential reversal or profit-taking opportunity.
Also closes positions if bearish divergence signals appear after a bullish setup, providing protection against trend reversals.
Trailing Stop-Loss:
Uses a trailing stop mechanism based on ATR (Average True Range) or a percentage threshold to lock in profits as the price moves in favor of the trade.
Alerts and Custom Notifications:
Integrated with TradingView alerts to notify the user when entry and exit conditions are met, supporting timely decision-making without constant monitoring.
Customizable Parameters:
Users can adjust the RSI period, pivot lookback range, overbought level, trailing stop type (ATR or percentage), and divergence range to fit their trading style.
Ideal Usage
This strategy is well-suited for trend traders and swing traders looking to capture reversals and trend continuations on medium to long timeframes. The divergence signals, paired with trailing stops and volume validation, make it adaptable for multiple asset classes, including stocks, forex, and crypto.
Summary
With its focus on RSI divergence, trailing stop-loss management, and volume filtering, this strategy aims to identify and capture trend changes with minimized risk. This allows traders to efficiently capture profitable moves and manage open positions with precision.
This Strategy BEST works with GLD!

Reversed Choppiness Index with Donchian Channels and SMAIn the chaotic world of trading, where every tick can lead to joy or despair, traders yearn for clarity amid the noise. They crave a mechanism that not only reveals the underlying market trends but also navigates the turbulent waters of volatility with grace. Enter the Reversed Choppiness Index with Donchian Channels and SMA Smoothing—a sophisticated tool crafted for those who refuse to be swayed by the whims of market noise.
This innovative script harnesses the power of the Choppiness Index, flipping it on its head to unveil the true direction of price movement. Choppiness, in its traditional form, indicates when the market is stuck in a sideways range, characterized by erratic price movements that can leave traders bewildered. High choppiness often signals confusion in the market, where prices oscillate without a clear trend, leading to potential losses. Conversely, low choppiness suggests a trending market, whether bullish or bearish, where trades can yield consistent profits. By reversing the Choppiness Index, this tool highlights lower choppiness levels as opportunities for selling when the market shows stability and momentum—perfect for traders looking to enter or exit positions with confidence.
The Donchian Channels serve as reliable markers, defining the boundaries of price action and helping to paint a clearer picture of market dynamics. Traders should look for breakouts from these channels, which may indicate a significant shift in momentum. When the Reversed Choppiness Index trends lower while price breaks above the upper Donchian Band, it may signal a strong buying opportunity, while a rise in choppiness alongside price dipping below the lower band can indicate a potential selling point.
But that's not all—this tool features a dual-layer of smoothing through two distinct Simple Moving Averages (SMAs). The first SMA gently caresses the Reversed Choppiness Index, softening its edges to reveal the underlying trends. The second SMA adds an extra layer of finesse, ensuring traders can spot significant changes with less noise interference.
In a landscape filled with fleeting opportunities and unpredictable swings, this script stands as a beacon of stability. It allows traders to focus on what truly matters—seizing profitable moments without getting caught in the crossfire of volatility. By understanding the dynamics of choppiness through this reversed lens, traders can more effectively navigate their strategies, capitalizing on clearer signals while avoiding the pitfalls of market noise. Embrace this tool and transform the way you trade; the market's whispers will no longer drown out your strategies, paving the way for informed decisions and greater success.

TrendGuard Scalper: SSL + Hama Candle with Consolidation ZonesThis TradingView script brings a powerful scalping strategy that combines the SSL Channel and Hama Candles indicators with a special twist—consolidation detection. Designed for traders looking for consistency in various markets like crypto, forex, and stocks, this strategy highlights clear trend signals, risk management, and helps filter out risky trades during consolidation periods.
Why Use This Strategy?
Clear Trend Detection:
With the SSL Channel, you’ll know exactly when the market is in an uptrend (green) or downtrend (red), giving you straightforward entry points.
Short-Term Trend Precision with Hama Candles:
By calculating unique EMAs for open, high, low, and close, the Hama Candles show the strength and direction of short-term trends. Combined with the Hama Line, it gives you a solid confirmation on whether the trend is strong or about to reverse, allowing for precise entries and exits.
Avoiding Choppy Markets:
Thanks to ATR-based consolidation detection, this strategy identifies low-volatility periods where the market is “choppy” and less predictable. During these times, a yellow background appears on the chart, warning you to hold off on trades, reducing the likelihood of entering losing trades.
Built-In Risk Management:
With adjustable Take Profit and Stop Loss levels based on price movements, you can set and forget your trades, with a safety net if the market turns against you. The strategy automatically closes positions if the price returns to the Hama Candle, keeping your risk low.
How It Works:
Long Position: When both the SSL and Hama indicators show a green trend, and the price is above the Hama Candles, the strategy opens a long position. Take Profit triggers at your chosen risk-to-reward ratio, while Stop Loss protects you just below the Hama Line.
Short Position: When both indicators align in red and the price is below the Hama Candles, the strategy opens a short. Similar to longs, Stop Loss is set just above the Hama Line, and Take Profit is at your defined level.
Start Trading Confidently
Test this strategy with different settings and discover how it can perform across various assets. Whether you're trading Bitcoin, forex pairs, or stocks, this system has the flexibility and robustness to help you spot profitable trends and avoid risky zones. Try it today on a 30-minute timeframe to see how it aligns with your trading goals, and let the consolidation detection guide you away from false signals.
Happy trading, and may the trends be with you! 📈

Payday Anomaly StrategyThe "Payday Effect" refers to a predictable anomaly in financial markets where stock returns exhibit significant fluctuations around specific pay periods. Typically, these are associated with the beginning, middle, or end of the month when many investors receive wages and salaries. This influx of funds, often directed automatically into retirement accounts or investment portfolios (such as 401(k) plans in the United States), temporarily increases the demand for equities. This phenomenon has been linked to a cycle where stock prices rise disproportionately on and around payday periods due to increased buy-side liquidity.
Academic research on the payday effect suggests that this pattern is tied to systematic cash flows into financial markets, primarily driven by employee retirement and savings plans. The regularity of these cash infusions creates a calendar-based pattern that can be exploited in trading strategies. Studies show that returns on days around typical payroll dates tend to be above average, and this pattern remains observable across various time periods and regions.
The rationale behind the payday effect is rooted in the behavioral tendencies of investors, specifically the automatic reinvestment mechanisms used in retirement funds, which align with monthly or semi-monthly salary payments. This regular injection of funds can cause market microstructure effects where stock prices temporarily increase, only to stabilize or reverse after the funds have been invested. Consequently, the payday effect provides traders with a potentially profitable opportunity by predicting these inflows.
Scientific Bibliography on the Payday Effect
Ma, A., & Pratt, W. R. (2017). Payday Anomaly: The Market Impact of Semi-Monthly Pay Periods. Social Science Research Network (SSRN).
This study provides a comprehensive analysis of the payday effect, exploring how returns tend to peak around payroll periods due to semi-monthly cash flows. The paper discusses how systematic inflows impact returns, leading to predictable stock performance patterns on specific days of the month.
Lakonishok, J., & Smidt, S. (1988). Are Seasonal Anomalies Real? A Ninety-Year Perspective. The Review of Financial Studies, 1(4), 403-425.
This foundational study explores calendar anomalies, including the payday effect. By examining data over nearly a century, the authors establish a framework for understanding seasonal and monthly patterns in stock returns, which provides historical support for the payday effect.
Owen, S., & Rabinovitch, R. (1983). On the Predictability of Common Stock Returns: A Step Beyond the Random Walk Hypothesis. Journal of Business Finance & Accounting, 10(3), 379-396.
This paper investigates predictability in stock returns beyond random fluctuations. It considers payday effects among various calendar anomalies, arguing that certain dates yield predictable returns due to regular cash inflows.
Loughran, T., & Schultz, P. (2005). Liquidity: Urban versus Rural Firms. Journal of Financial Economics, 78(2), 341-374.
While primarily focused on liquidity, this study provides insight into how cash flows, such as those from semi-monthly paychecks, influence liquidity levels and consequently impact stock prices around predictable pay dates.
Ariel, R. A. (1990). High Stock Returns Before Holidays: Existence and Evidence on Possible Causes. The Journal of Finance, 45(5), 1611-1626.
Ariel’s work highlights stock return patterns tied to certain dates, including paydays. Although the study focuses on pre-holiday returns, it suggests broader implications of predictable investment timing, reinforcing the calendar-based effects seen with payday anomalies.
Summary
Research on the payday effect highlights a repeating pattern in stock market returns driven by scheduled payroll investments. This cyclical increase in stock demand aligns with behavioral finance insights and market microstructure theories, offering a valuable basis for trading strategies focused on the beginning, middle, and end of each month.

Immediate Rebalance ICT [TradingFinder] No Imbalances - MTF Gaps🔵 Introduction
The concept of "Immediate Rebalance" in technical analysis is a powerful and advanced strategy within the ICT (Inner Circle Trader) framework, widely used to identify key market levels.
Unlike the "Fair Value Gap," which leaves a price gap requiring a retracement for a fill, an Immediate Rebalance fills the gap immediately, representing an instant balance that strengthens the prevailing market trend. This structure allows traders to quickly spot critical price zones, capitalizing on strong trend continuations without the need for price retracement.
The "Immediate Rebalance ICT" indicator leverages this concept, providing traders with automated identification of critical supply and demand zones, order blocks, liquidity voids, and key buy-side and sell-side liquidity levels.
Through features like crucial liquidity points and immediate rebalancing areas, this tool enables traders to perform precise real-time market analysis and seize profitable opportunities.
🔵 How to Use
The Immediate Rebalance indicator assists traders in identifying reliable trading signals by detecting and analyzing Immediate Rebalance zones. By focusing on supply and demand areas, the indicator pinpoints optimal entry and exit positions.
Here’s how to use the indicator in both bearish (Supply Immediate Rebalance) and bullish (Demand Immediate Rebalance) structures :
🟣 Bullish Structure (Demand Immediate Rebalance)
In a bullish scenario, the indicator detects a Demand Immediate Rebalance formed by two consecutive bullish candles with overlapping wicks. This structure signifies an immediate demand zone, where price instantly balances within the zone, reducing the likelihood of a revisit and indicating potential upside momentum.
Zone Identification : Look for two consecutive bullish candles with overlapping wicks, forming a demand zone. This structure, due to its rapid balance, usually does not require a revisit and supports further upward movement.
Entry and Exit Levels : If price revisits this zone, percentage markers, particularly 50% and 75%, act as supportive levels, creating ideal entry points for long positions.
Example : In the second image, an example of a Demand Immediate Rebalance is shown, where overlapping bullish candle shadows indicate immediate balance, supporting the continuation of the bullish trend.
🟣 Bearish Structure (Supply Immediate Rebalance)
In a bearish setup, the indicator identifies a Supply Immediate Rebalance when two consecutive bearish candles with overlapping wicks appear. This formation signals an immediate supply zone, suggesting a high probability of trend continuation to the downside, with minimal expectation for price to retrace back to this area.
Zone Identificatio n: Look for two consecutive bearish candles with overlapping shadows. This structure forms a supply area where price is expected to continue its downtrend without revisiting the zone.
Entry and Exit Level s: Should price revisit this zone, percentage-based levels (e.g., 50% and 75%) serve as potential resistance points, optimizing entry for short positions, especially if the downtrend is expected to persist.
Example : The attached chart illustrates a Supply Immediate Rebalance, where overlapping candle shadows define this area, reassuring traders of a continued downward trend with a low likelihood of price returning to this zone.
🔵 Settings
ImmR Filter : This filter allows users to adjust the detection of Immediate Rebalance zones in four modes, from "Very Aggressive" to "Very Defensive," based on zone width. The chosen mode controls the sensitivity of Immediate Rebalance detection, allowing users to fine-tune the indicator to their trading style.
Multi Time Frame : Enabling this option allows users to set the indicator to a specific timeframe (1 minute, 5 minutes, 15 minutes, 30 minutes, 1 hour, 4 hours, daily, weekly, or monthly), broadening the perspective for identifying Immediate Rebalance zones across multiple timeframes.
🔵 Conclusion
The Immediate Rebalance indicator, based on rapid balancing zones within supply and demand areas, serves as a powerful tool for market analysis and improving trade decision-making.
By accurately identifying zones where price achieves instant balance without gaps, the indicator highlights areas likely to support strong trend continuations, exempt from common retracements.
The indicator’s use of percentage levels enables traders to pinpoint optimal entry and exit points more effectively, with levels like 50% and 75% acting as support within demand zones and resistance within supply zones. This empowers traders to ride strong trends without the worry of abrupt reversals.
Overall, the Immediate Rebalance is a reliable tool for both professional and beginner traders seeking precise methods to recognize supply and demand zones, capitalizing on consistent trends.
By choosing appropriate settings and focusing on the zones highlighted by this indicator, traders can enter trades with greater confidence and improve their risk management.

Supertrend StrategyThe Supertrend Strategy was created based on the Supertrend and Relative Strength Index (RSI) indicators, widely respected tools in technical analysis. This strategy combines these two indicators to capture market trends with precision and reliability, looking for optimizing exit levels at oversold or overbought price levels.
The Supertrend indicator identifies trend direction based on price and volatility by using the Average True Range (ATR). The ATR measures market volatility by calculating the average range between an asset’s high and low prices over a set period. It provides insight into price fluctuations, with higher ATR values indicating increased volatility and lower values suggesting stability. The Supertrend Indicator plots a line above or below the price, signaling potential buy or sell opportunities: when the price closes above the Supertrend line, an uptrend is indicated, while a close below the line suggests a downtrend. This line shifts as price movements and volatility levels change, acting as both a trailing stop loss and trend confirmation.
To enhance the Supertrend strategy, the Relative Strength Index (RSI) has been added as an exit criterion. As a momentum oscillator, the RSI indicates overbought (usually above 70) or oversold (usually below 30) conditions. This integration allows trades to close when the asset is overbought or oversold, capturing gains before a possible reversal, even if the percentage take profit level has not been reached. This mechanism aims to prevent losses due to market reversals before the Supertrend signal changes.
### Key Features
1. **Entry criteria**:
- The strategy uses the Supertrend indicator calculated by adding or subtracting a multiple of the ATR from the closing price, depending on the trend direction.
- When the price crosses above the Supertrend line, the strategy signals a long (buy) entry. Conversely, when the price crosses below, it signals a short (sell) entry.
- The strategy performs a reversal if there is an open position and a change in the direction of the supertrend occurs
2. **Exit criteria**:
- Take profit of 30% (default) on the average position price.
- Oversold (≤ 5) or overbought (≥ 95) RSI
- Reversal when there is a change in direction of the Supertrend
3. **No Repainting**:
- This strategy is not subject to repainting, as long as the timeframe configured on your chart is the same as the supertrend timeframe .
4. **Position Sizing by Equity and risk management**:
- This strategy has a default configuration to operate with 35% of the equity. At the time of opening the position, the supertrend line is typically positioned at about 12 to 16% of the entry price. This way, the strategy is putting at risk about 16% of 35% of equity, that is, around 5.6% of equity for each trade. The percentage of equity can be adjusted by the user according to their risk management.
5. **Backtest results**:
- This strategy was subjected to deep backtesting and operations in replay mode, including transaction fees of 0.12%, and slippage of 5 ticks.
- The past results in deep backtest and replay mode were compatible and profitable (Variable results depending on the take profit used, supertrend and RSI parameters). However, it should be noted that few operations were evaluated, since the currency in question has been created for a short time and the frequency of operations is relatively small.
- Past results are no guarantee of future results. The strategy's backtest results may even be due to overfitting with past data.
Default Settings
Chart timeframe: 2h
Supertrend Factor: 3.42
ATR period: 14
Supertrend timeframe: 2 h
RSI timeframe: 15 min
RSI Lenght: 5 min
RSI Upper limit: 95
RSI Lower Limit: 5
Take Profit: 30%
BYBIT:1000000MOGUSDT.P

Smart Money Setup 07 [TradingFinder] Liquidity Hunts & Minor OB🔵 Introduction
The Smart Money Concept relies on analyzing market structure, tracking liquidity flows, and identifying order blocks. Research indicates that traders who apply these methods can improve their accuracy in predicting market movements by up to 30%.
These elements allow traders to understand the behavior of market makers, including banks and large financial institutions, which have the ability to influence price movements and shape major market trends. By recognizing how these entities operate, traders can align their strategies with Smart Money actions and better anticipate shifts in the market.
Smart Money typically enters the market at points of high liquidity where trading opportunities are more attractive. By following these liquidity flows, professional traders can position themselves at market reversal points, leading to profitable trades.
The Smart Money Setup 07 indicator has been specifically designed to detect these complex patterns. Using advanced algorithms, this indicator automatically identifies both bullish and bearish trading setups, assisting traders in discovering hidden market opportunities.
As a powerful technical analysis tool, the Smart Money Setup indicator helps predict the actions of major market participants and highlights optimal entry and exit points. Essentially, this tool enables traders to act like institutional investors and market makers, making the most of price fluctuations in their favor.
Ultimately, the Smart Money Setup 07 indicator transforms complex technical analysis into a simple and practical tool. By detecting order blocks and liquidity zones, this tool helps traders execute their strategies with greater precision, leading to more informed and successful trading decisions.
🟣 Bullish Setup
🟣 Bearish Setup
🔵 How to Use
One of the key strengths of the Smart Money Setup 07 indicator is its ability to accurately identify order blocks and analyze liquidity flows. Order blocks represent areas where large buy or sell orders are placed by Smart Money investors, which often indicate key reversal points in the market. Traders can use these order blocks to pinpoint potential entry and exit opportunities.
The Smart Money Setup indicator detects and visually displays these order blocks on the chart, helping traders identify the best zones to enter or exit trades. Since these zones are frequently used by large institutional investors, following these blocks allows traders to capitalize on price fluctuations and trade with confidence.
🟣 Bullish Smart Money Setup
A Bullish Smart Money Setup forms when the market creates Higher Lows and Higher Highs. In this situation, the indicator analyzes pivot points, liquidity flows, and order blocks to identify buy opportunities. Liquidity points in these setups indicate areas where Smart Money is likely to enter long positions.
In the bullish setup image, multiple Higher Lows and Higher Highs are formed. The green zone represents a Bullish Order Block, signaling traders to enter a long trade. The Smart Money Setup indicator displays a green arrow, indicating a high-probability upward price movement from this liquidity zone.
🟣 Bearish Smart Money Setup
A Bearish Smart Money Setup occurs when the market structure shows Lower Highs and Lower Lows, indicating weakness in price. The indicator identifies these patterns and highlights potential sell opportunities. Liquidity points in this setup mark areas where Smart Money enters sell positions.
In the bearish setup image, a Lower High is followed by a Lower Low, with the red liquidity zone acting as a Bearish Order Block. The Smart Money Setup indicator shows a red arrow, signaling a likely downward move, offering traders an opportunity to enter short positions.
🔵 Settings
Pivot Period : This setting determines how many candles are needed to form a pivot point. A default value of 2 is optimal for quickly identifying key pivot points in price action.
Order Block Validity Period : This parameter defines the lifespan of an order block. Traders can adjust how long each order block remains valid. For instance, setting it to 500 means that an order block will be valid for 500 bars after its formation.
Mitigation Level OB : This setting allows traders to select whether order blocks should be based on the "Proximal," "50% OB," or "Distal" levels, helping traders manage risk more effectively.
Order Block Refinement : Traders can refine the order blocks with precision. The indicator offers two refinement modes: Defensive and Aggressive. The Defensive mode identifies safer order blocks, while the Aggressive mode targets higher-risk blocks with the potential for larger reversals.
🔵 Conclusion
The Smart Money Setup 07 indicator is a powerful tool for identifying key Smart Money movements in the market. It provides traders with essential insights for making informed trading decisions, particularly when combined with technical analysis and liquidity flow analysis. This indicator allows traders to accurately pinpoint entry and exit points, helping them maximize profits and minimize risk.
By offering a range of customizable settings, the Smart Money Setup indicator adapts to different trading styles and strategies. Furthermore, its ability to detect order blocks and identify supply and demand zones makes it an indispensable tool for any trader looking to enhance their strategy.
In conclusion, the Smart Money Setup 07 is a crucial tool for traders aiming to optimize their trading performance. By utilizing the concepts of Smart Money in technical analysis, traders can make more precise decisions and take advantage of market fluctuations.

RSI from Rolling VWAP [CHE]Introducing the RSI from Rolling VWAP Indicator
Elevate your trading strategy with the RSI from Rolling VWAP —a cutting-edge indicator designed to provide unparalleled insights and enhance your decision-making on TradingView. This advanced tool seamlessly integrates the Relative Strength Index (RSI) with a Rolling Volume-Weighted Average Price (VWAP) to deliver precise and actionable trading signals.
Why Choose RSI from Rolling VWAP ?
- Clear Trend Detection: Our enhanced algorithms ensure accurate identification of bullish and bearish trends, allowing you to capitalize on market movements with confidence.
- Customizable Time Settings: Tailor the time window in days, hours, and minutes to align perfectly with your unique trading strategy and market conditions.
- Flexible Moving Averages: Select from a variety of moving average types—including SMA, EMA, WMA, and more—to smooth the RSI, providing clearer trend analysis and reducing market noise.
- Threshold Alerts: Define upper and lower RSI thresholds to effortlessly spot overbought or oversold conditions, enabling timely and informed trading decisions.
- Visual Enhancements: Enjoy a visually intuitive interface with color-coded RSI lines, moving averages, and background fills that make interpreting market data straightforward and efficient.
- Automatic Signal Labels: Receive immediate bullish and bearish labels directly on your chart, signaling potential trading opportunities without the need for constant monitoring.
Key Features
- Inspired by Proven Tools: Building upon the robust foundation of TradingView's Rolling VWAP, our indicator offers enhanced functionality and greater precision.
- Volume-Weighted Insights: By incorporating volume into the VWAP calculation, gain a deeper understanding of price movements and market strength.
- User-Friendly Configuration: Easily adjust settings to match your trading preferences, whether you're a novice trader or an experienced professional.
- Hypothesis-Driven Analysis: Utilize hypothetical results to backtest strategies, understanding that past performance does not guarantee future outcomes.
How It Works
1. Data Integration: Utilizes the `hlc3` (average of high, low, and close) as the default data source, with customization options available to suit your trading needs.
2. Dynamic Time Window: Automatically calculates the optimal time window based on an auto timeframe or allows for fixed time periods, ensuring flexibility and adaptability.
3. Rolling VWAP Calculation: Accurately computes the Rolling VWAP by balancing price and volume over the specified time window, providing a reliable benchmark for price action.
4. RSI Analysis: Measures momentum through RSI based on Rolling VWAP changes, smoothed with your chosen moving average for enhanced trend clarity.
5. Actionable Signals: Detects and labels bullish and bearish conditions when RSI crosses predefined thresholds, offering clear indicators for potential market entries and exits.
Seamless Integration with Your TradingView Experience
Adding the RSI from Rolling VWAP to your TradingView charts is straightforward:
1. Add to Chart: Simply copy the Pine Script code into TradingView's Pine Editor and apply it to your desired chart.
2. Customize Settings: Adjust the Source Settings, Time Settings, RSI Settings, MA Settings, and Color Settings to align with your trading strategy.
3. Monitor Signals: Watch for RSI crossings above or below your set thresholds, accompanied by clear labels indicating bullish or bearish trends.
4. Optimize Your Trades: Leverage the visual and analytical strengths of the indicator to make informed buy or sell decisions, maximizing your trading potential.
Disclaimer:
The content provided, including all code and materials, is strictly for educational and informational purposes only. It is not intended as, and should not be interpreted as, financial advice, a recommendation to buy or sell any financial instrument, or an offer of any financial product or service. All strategies, tools, and examples discussed are provided for illustrative purposes to demonstrate coding techniques and the functionality of Pine Script within a trading context.
Any results from strategies or tools provided are hypothetical, and past performance is not indicative of future results. Trading and investing involve high risk, including the potential loss of principal, and may not be suitable for all individuals. Before making any trading decisions, please consult with a qualified financial professional to understand the risks involved.
By using this script, you acknowledge and agree that any trading decisions are made solely at your discretion and risk.
Get Started Today
Transform your trading approach with the RSI from Rolling VWAP indicator. Experience the synergy of momentum and volume-based analysis, and unlock the potential for more accurate and profitable trades.
Download now and take the first step towards a more informed and strategic trading journey!
For further inquiries or support, feel free to contact
Best regards
Chervolino
Inspired by the acclaimed Rolling VWAP by TradingView
