Multi-Timeframe MA Based Zigzag[liwei666]🎲 Overview
🎯 This Zigzag indicator build based on different MA such as EMA/HMA/RMA/SMA, support multi-timeframe setting .
you can get customer zigzag indicator by change short/long ma length and high-timeframe config(5m/15m/30m/1h/2h) in any symbol.
🎲 Indicator design logic
🎯 entired logic is simple and code looks complex, I‘ll explain core logic here, code already equipped with detailed comments.
1. use close-in EMA's highest/lowest value mark as SWING High/Low when EMA crossover/under, not use func ta.pivothigh()/ta.pivotlow()
2. when EMA crossover/under plot a char as signal like ●/❄/▲, crossover get blue char crossunder get red char
3. latest zigzag line is not drawn until EMA is turned (crossover/under), but signal is realtime
4. you can see diff zigzag structure when you open high-timeframe config, then find regular pattern benefit your trading.
🎲 Settings
🎯 there are 3 group properties in script, just focus on 5 properties in 'GRP1' ,
'GRP2' and 'GRP3' are display config.
'GRP1':
MA_Type: MA type you can choose(EMA/RMA/SMA/HMA/WMA), default is EMA
short_ma_len: short MA length of your current timeframe on chart
long_ma_len: long MA length of your current timeframe on chart
htf_ma_len: MA length of high timeframe, MA type same as 'MA_Type' config
htf_ma_tf: high timeframe ma length, 15/30/60/120 minute
'GRP2':
• show_short_zz • show_long_zz • show_htf_zz:
'GRP3':
• show_short_ma_line • show_short_ma_signal
• show_long_ma_line • show_long_ma_signal
• show_htf_ma_line • show_htf_ma_signal
🎲 Usage
🎯 As we know, MA based signal usually worked fine in trend market , low volatility is unprofitable.
🎯 One of pattern as the chart show below.
1. success example : after a blue ▲ signal, entry long when blue ● signal appear, marked with green box.
2. failed example: after a blue ▲ signal, a red ▼ signal appear, marked with white box.
🎯 BoS(Break of Structure) based on ma zigzag is a good idea I'm implementing, it will be published in next script.
Additionally, I plan to publish 20 profitable strategies in 2023; this indicatior not one of them,
let‘s witness it together!
Hope this indicator will be useful for you :)
enjoy! 🚀🚀🚀
Cari dalam skrip untuk "profitable"

RSI Bands [APIDEVs]RSI BANDS:
It is an exclusive product of ApiDevs, this indicator selectively integrates a series of highly advanced algorithms that aim to provide the trader with an effective and profitable trading system, based on a series of conditions that project the price direction with a reasonable probability.
This indicator bears the name of “RSI Bands”, this is because we have based this trading system on the “Relative Strength Index ( RSI )”, the strength of this indicator is centennial and we at APIDEVs have decided to focus our efforts on the development of powerful tools based on the favorite indicators of the afternoon.
WHAT IT HAS INCORPORATED:
1. Exponential Moving Average (EMAs): The RSI Bands has, by default, a band composed of two moving averages of 10 and 55 exponential periods, which can be modified in the indicator menu.
• Possibility of changing the value of the EMAs.
• Function was enabled to change the color and transparency of the bands.
• Visual alerts SHORT (L) and LONG (L) were added when there is the crossing of the EMAS.
• Hull Moving Average ( HMA ) of 100 periods was also incorporated, also modifiable for those who wish to strengthen their visual analysis. (Disabled by default)
• We also add an Exponential Moving Average ( EMA ) of 200 periods to mark the trend. (Disabled by default).
2. ATR ( Average True Range ): This indicator has two main functions in the RSI Bands, the first is to mark the trend of the asset and the second is to establish a margin of safety in price volatility , that is, a maximum estimate of the setbacks without this representing a change in the direction of the price.
3. RSI ( Relative Strength Index ): It was visually incorporated into the RSI Bands, the graph is obtained on the right side and its purpose is to visually indicate where the price is with respect to the RSI PRO+ indicator, offering the following improvements :
• ALERT SYSTEM: THE RSI PRO+ has the ADX incorporated into its algorithm, which allows establishing a filter that will provide reliable inputs, represented by the LONG (L) and SHORT (S) signals.
• FILTER AGAINST TREND: The signals described above will be activated according to the crossing of the RSI above the 50 point, provided that the ADX agrees with the market direction.
• Possibility of deactivating this graphical representation.
4. ADX ( Average Directional Index ): The ADX in this indicator is intended to estimate the strength of the movement, it is present in each part of the code, either to indicate the strength of the market or to serve as a filter against trend. In the same way, we apply certain exclusive improvements for this indicator:
• It was established as default values of the ADX that the Level Range was 10 and the Level Trend 25. This significantly changes the behavior of this indicator, almost completely eliminating the zone of disinterest that was usually considered.
• A function was activated to paint the sails the color of the ADX .
5. ADX Ocillator: Yes, we developed a Wave oscillator type ADX and incorporated it into this strategy. From this indicator, which we recommend using in conjunction with the RSI Bands, we extracted the LONG (L) and SHORT (S) signals. The ADX Oscillator is the improved version of the traditional ADX as it offers the following improvements:
• Its interpretation is much simpler.
• Allows you to set entry and exit signals during the trend change and during the price path.
• It has an integrated alert system.
STRATEGY PANEL:
This panel is an exclusive creation of APIDEVs, and its purpose is to parameterize five conditionals based on the indicators that make up our RSI strategy, giving the trader an immediate vision of the status of the asset analyzed considering this strategy. That is, we decided to transfer our experience of using this indicator on a panel that will project the price trajectory visually. It has the following characteristics:
• It can be placed anywhere on the screen through the main menu of the indicator, it can even be deactivated.
• It can be resized, we designed this to adapt to all types of screens, including those of mobile phones.
• It has an upper panel called "Project" which will calculate the percentage probability that the price has to take a direction based on all the indicators incorporated into the strategy. Their values range from (+ 100%) to (-100%).
STRATEGY PANEL PARAMETERS:
1. EMAs: This panel has 2 variables:
• LONG: If the fast EMA is above the slow EMA .
• SHORT: If the fast EMA is below the slow EMA .
2. RSI: This panel has 3 variables:
• LONG: The RSI should be bullish (green) and above the 50 point.
• SHORT: The RSI should be bearish (red) and be below the 50 point.
• RANK: (Range)this condition is activated when there is no concordance with the RSI condition and its crossing.
3. ATR: This panel has 2 variables:
• LONG: When the price is above the ATR.
• SHORT: When the price is below the ATR.
4. ADX: This panel has 3 variables:
• LONG: The ADX is green. That is, the DI + is above the DI-.
• SHORT: The ADX is red. That is, the DI- is above the DI +.
• RANK: ADX is below point 10.
It also has a numerical value that indicates the value of the ADX and two texts indicating the strength of the trend:
• Trend ( bullish or bearish ).
• Strong trend ( bullish or bearish ).
5. OSC: This panel has 3 variables:
• LONG: The oscillator slopes upward and the built-in ADX is green.
• SHORT: The oscillator slopes downward and the built-in ADX is red.
• RANK: The oscillator slopes downward and the built-in ADX is green and the opposite. In short, there is no coherence in the movement of the oscillator and the projection of the ADX .

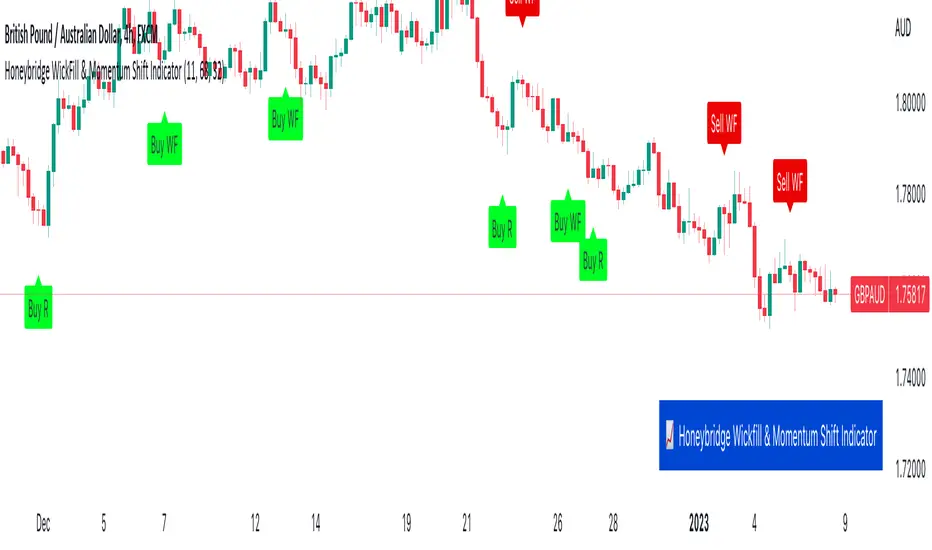
Honeybridge WickFill & Momentum Shift IndicatorAs the creator of this script, I am proud to introduce the "Honeybridge WickFill & Momentum Shift Indicator," a powerful tool for traders looking to capitalize on market opportunities using these two proven strategies.
WICK FILLS
First, let's take a closer look at the WickFill method. In financial markets, candlestick charts are a popular way to visualize the price movement of a security, derivative, or currency over a specific time period. Each candlestick on the chart is composed of a real body and shadows, with the top of the upper shadow representing the highest price paid during the time period, and the bottom of the lower shadow representing the lowest price paid.
The WickFill method involves placing market orders at the closed price indicated by the candlestick. This means that if a trader using this method sees a long upper wick on a bullish candlestick chart, they may place a buy market order at the closed price of the candlestick with the take profit target at the candlestick high price (the highest price paid during the time period), in the belief that the price is likely to rise. Similarly, if they see a long lower wick on a bearish candle, they may place a sell market order at the closed price of the candlestick with the take profit target at the candlestick low price (the lowest price paid during the time period), in the belief that the price is likely to fall.
The idea behind the WickFill method is that the wicks of candlestick chart patterns can provide valuable information about the price action of a security and the sentiment of market participants. By placing market orders at the prices indicated by the candlesticks close, traders using this method hope to capitalize on potential price movements and maximize their returns.
The image below highlights two Wick Fill opportunities. A signal will be provided at the candle close that says: 'Sell WF' or 'Buy WF'.
--------------
MOMENTUM SHIFT REVERSAL
Now, let's turn to the Momentum Shift method. As the name suggests, this method involves identifying changes in the momentum of the price of a security. Traders who use this method are looking to capitalize on shifts in the strength or direction of the price momentum.
There are various ways to trade based on momentum shifts. For example, a trader may look for a security whose price is trending strongly in one direction and then look for a momentum shift that signals a change in the trend. They may then enter a trade in the direction of the new trend, hoping to ride the momentum of the price movement. Alternatively, a trader may look for a security whose price is moving in a range and then look for a momentum shift that signals a breakout from the range. They may then enter a trade in the direction of the breakout, hoping to capitalize on the momentum of the price movement.
--------------
WICK REJECTION REVERSALS
A second Momentum Shift method is the concept of wick rejection reversal trading opportunities. This is a powerful technique for traders looking to capitalize on market opportunities.
So, what exactly is a wick rejection reversal opportunity? Essentially, it is a situation in which the price of a security rejects a wick (or shadow or tail) of a candlestick chart pattern and then reverses direction. For example, if the price is trending upwards and then encounters resistance at a certain level, it may create a long upper wick on a candlestick chart. If the price then falls back below the level of resistance and continues trending downwards, this could be considered a wick rejection reversal opportunity.
Traders can use the Indicator and signals provided to identify wick rejection reversal opportunities by defining certain conditions. For example, the code includes conditions for identifying a "sell reversal" based on the presence of a green candle with a long upper wick, and an RSI value above a certain threshold. This type of setup may indicate that the price is rejecting the resistance represented by the long upper wick and is likely to continue trending downwards.
Similarly, the code includes conditions for identifying a "buy reversal" based on the presence of a red candle with a long lower wick, and an RSI value below a certain threshold. This type of setup may indicate that the price is rejecting the support represented by the long lower wick and is likely to continue trending upwards.
Traders can find wick rejection reversal opportunities particularly beneficial for several reasons. First, these opportunities can provide clear entry and exit points for trades, which can help traders manage risk and maximize their returns. By identifying a specific level of resistance or support that has been rejected by the price, traders can have a clear idea of where to place their orders and where to set their stop-losses.
Second, wick rejection reversal opportunities can be a reliable indicator of market sentiment and direction. By considering the wicks of candlestick chart patterns, traders can gain a deeper understanding of the forces at work in the market and how market participants are reacting to them. This can help traders make more informed decisions about when to enter or exit trades.
Finally, wick rejection reversal opportunities can be found in a variety of market conditions and across different financial instruments. Whether the market is trending, range-bound, or volatile, traders can use this indicator provided to identify wick rejection reversal opportunities and capitalize on them.
In conclusion, wick rejection reversal opportunities are a valuable technique for traders looking to capitalize on market opportunities and improve their returns. By using the indicator provided and considering the wicks of candlestick chart patterns, traders can identify clear entry and exit points, understand market sentiment, and trade across different market conditions and instruments.
The image below depicts two sell opportunities, the top left is a Momentum Shift example and the top right is a Wick Rejection example. A signal will be shown on the chart at the candle close that says: 'Sell R' or 'Buy R'.
--------------
CONCLUSION
So why might traders find the WickFill and Momentum Shift methods useful? There are several reasons. First, these methods can help traders identify potential trade opportunities that may not be immediately apparent from a simple analysis of price trends or chart patterns. By considering the wicks and momentum of a security's price movement, traders can gain a more nuanced understanding of the forces at work in the market and make more informed decisions about when to enter or exit trades.
Second, the WickFill and Momentum Shift methods can be used in conjunction with other technical analysis tools and techniques. For example, traders may use moving averages, oscillators, and trendlines to help confirm the presence of a WickFill or Momentum Shift opportunity. This can help traders increase the reliability and profitability of their trades.
Finally, the WickFill and Momentum Shift methods can be applied to a wide range of financial instruments, including stocks, forex, futures, and more. This versatility makes them useful for traders with diverse investment portfolios and strategies.
Overall, the WickFill and Momentum Shift methods are powerful tools for traders looking to capitalize on market opportunities and improve their returns. By considering the wicks and momentum of a security's price movement, traders can find profitable trading opportunities.
------------
FINAL COMMENT
Just like any other indicator or strategy out there, please consider the timeframe and asset that you are using this indicator with. Higher timeframe price action is more reliable than lower timeframe price action. For example, the 4H and Daily timeframes will provide more reliable signals than the 5m timeframe. With regards to assets, the indicator works extremely well with Forex pairs and Commodities, such as Gold.
I hope you enjoy the indicator.
Trading BehnamI've read around here various definitions for engulfs along the lines of "an engulf consumes all orders at a level to allow price to easily pass through it." . That doesn't make much sense to me, if the guys with billions of dollars want to break a level, they will break it and price will run off very often. We've seen it time and time again, they don't need to engulf levels to give us a nice opportunity to get into the trade with them, if they want to blast through a level, they will do so and price will run off. If they want an opportunity to accumulate more orders before price runs away, then it doesn't make sense to engulf the level, better to let price bounce from that level and then fill more orders, if the level breaks then they have to deliberately stop the market running away and move it back to the pre-engulf area as the market momentum would naturally make it run off after an engulf. Other ideas about it being a secret signal between the institutions don't make sense to me either. To be honest, I think any secret signals between competing institutions come in the form of them in a heavily encrypted chatroom telling each other what to do. This collusion has been reported on previously as traders align their activities at important moments.
So I think we can all agree something along the lines of:
Fakeout:
Fakeout is an engulf of an obvious swing high/low in order to stop out traders and induce breakout traders to trade in the wrong direction, thus generating liquidity for the move in the opposite direction.
What's not so clear is the definition of the engulf, I'd like to try to give some ideas on the purpose of the engulf and it's definition and see what others think.
Engulf:
An engulf is the consumption of orders at an important level, not necessarily a swing/high low but an area where we expect to see supply or demand. Taking out of the orders tells us that the supply or demand which was or should have been present is now not present and tells us the intent direction of the market. If price runs off as is often the case, this is not tradeable and is effectively just a "breakout", although breakouts are usually considered to be breaks of swing high and lows which are obvious to the average trader. For an engulf to be tradeable there must be a retrace following the engulf back in the original direction. This adds confusion as it initially resembles a fakeout. So the question is, why does price retrace after the engulf? If an engulf to the short side is a genuine engulf and not a fakeout to generate long liquidity, why does it not travel immediately south if market momentum is ultimately south.
A small pocket of demand beneath the engulfed level may make it retrace north as price moves between areas of liquidity, this pocket of demand may give price enough momentum to make it back up to the supply which broke the demand level if key market participants do not favour an immediate market drop.
Alternatively key market participants may step in and drive the market back upwards.
Price moving north back to supply after the engulf may occur or be favourable for various reasons:
1) We often talk about FO generating liquidity because of breakout trading, but an engulf can also generate liquidity from breakout traders. Short breakout traders would place their stop losses a small distance above the engulf (breakout). If key players absorb this selling or allow a demand level to push price back up, they can run price back up to supply taking out the stops of the breakout short traders and make quick profit and/or generate more liquidity for their own shorts.
2) To confuse traders, the ITs don't want the puzzle that is Forex to be easy to solve, if price never retraced after an engulf then engulfs of all levels would be FOs. Price would either break and immediately runoff or it would turn and runoff in the other direction. In order to keep people confused about whether price is faking out or breaking out, sometimes price should whipsaw by breaking out, briefly faking out and then continuing in the direction of the breakout. This whipsaw pattern is to us a tradeable engulf.
3) Market momentum may be mixed, key players are indecisive or inactive or the market is behaving erratically.
4) As previously mentioned there may be a small pocket of supply/demand just past the engulf which is causing a reaction. This could also be viewed as a FO on a different timeframe. If the market engulfs an H1 demand level, then retraces for 30 mins upwards to supply, this engulf would be a valid and very profitable FO for an M1 trader looking to get long.

[TTI] Ned Davis 3 day Price Thrust IndicatorThe NedDavis 3 Day Price Thrust Indicator
HISTORY AND CREDITS –––––––––––––––––––––––––––––––––––––––––––––––––––––––
The indicator is inspired by studies from Ned Davis' NDR Institutional Service. I have shared before the backtest of this indicator, and now have coded it for TradingView so that you can have it on your charts.
Link to idea here:
WHAT IT DOES ––––––––––––––––––––––––––––––––––––––––––––––––––––––––––––––
Thrusts occur when the S&P 500 rises at least 1.5% for one day, at least 1.15% for a second day, and at least 1.5% on the third day. The record since 1970 is perfect one year later. However, the prior 18 cases, ending in 1938, only show 11 out of 18 profitable one year later.
HOW TO USE IT –––––––––––––––––––––––––––––––––––––––––––––––––––––––––––––
I use the indicator as a gauge tool, in other words it is a piece of the puzzle to justify bullish or bearish trades. I put this type of analysis in my secondary tools that give me additional confidence for market direction and aggressiveness in my trading

HeikinAshi / MS-Signal (HA-MS)Hello?
Traders, welcome.
If you "Follow", you can always get new information quickly.
Please also click "Boost".
Have a good day.
-------------------------------------
I would like to take the time to explain the indicators needed for trading among the two indicator formulas previously disclosed.
The HA-MS indicator is an indicator created using the Heikin Ashi formula and the MACD formula.
Therefore, the reliability of the indicator is considered to be high.
If you want a comprehensive indicator, you can share the chart being published as an idea and use the MRHAB-T indicator.
The shared indicators can be used without any restrictions if you are a paid member of TradingView.
(Free members have many restrictions on sharing charts.)
The MS-Signal indicator using MACD is an indicator composed of M-Signal and S-Signal lines.
I made it possible to display the M-Signal line of the 1D, 1W, and 1M charts separately so that the trend can be checked on other timeframe charts.
Therefore, by looking at the 15m chart or 1h chart to check the overall trend when trading, we prevented getting caught up in temporary volatility, that is, a whipsaw, and made this M-Signal line to be used as support and resistance.
If you touch these M-Signal lines when a surge or plunge occurs, it means that there is a high possibility of indicating support or resistance.
If the 5EMA line on the 1D chart rises above the 5EMA line enough to be called a soaring moving average, it means that there is a high possibility of a sudden movement.
Therefore, the 5EMA line of the 1D chart is displayed separately so that it can be checked in time frames other than 1D (15m, 1h charts, etc.).
This 5EMA line can also be used as support and resistance like the M-Signal line of the 1D, 1W, and 1M charts described above.
The MS-Signal indicator is for viewing trends.
So, if the price stays above the MS-Signal indicator and the MS-Signal indicator turns into a bullish sign, it means that the uptrend is likely to continue.
Conversely, if the price stays below the MS-Signal indicator and the MS-Signal indicator turns to a bearish sign, then the downtrend is likely to continue.
Therefore, even if it temporarily rises above the MS-Signal indicator, it cannot be said that it will show an uptrend unless it is converted to an uptrend.
So, when the price surges and rises above the MS-Signal indicator, it is important to hold the price until the MS-Signal indicator turns into an uptrend.
If the HA-Low line or HA-High line is passing through these movements, you should respond by looking at whether you are supported or resisted on these lines.
The HA-Low line and the HA-High line are lines created for trading using Heikin Ashi candles.
Therefore, it can be interpreted that if it is supported by the HA-Low or HA-High line, it is highly likely to show an uptrend.
However, since the HA-Low and HA-High lines are calculated together with the RSI indicator, they are displayed on the chart as interactions.
The HA-Low line is a line created near the low point,
The HA-High line is a line created near the high point.
Therefore, if it shows support at the HA-Low line, it is time to buy.
And, if the price rises and rises above the HA-High line, it is likely to show a sharp movement.
Because of this movement, the HA-Low line is called the buy line, and the HA-High line is called the soaring line.
Since the HA-High line is a soaring line, if it is resisted by the HA-High line, it also means that there is a high possibility of a sharp decline.
If you see support at the HA-High line, you can buy it, but as I said, it is a sharp rise line, so you have to respond from a short-term perspective.
The Heikin Ashi body indicator is significant as it marks the first trend reversal.
So, you can see the first reversal move, either when the price first makes a move from a downtrend to an uptrend, or when the price first makes a move from an uptrend to a downtrend.
For example, if the price is in a downtrend and stops falling and moves sideways or rises slightly, the Heikin Ashi body indicator is likely to turn into an uptrend.
If this turns into a bullish sign, aggressive buying is possible.
However, since there is a high possibility that it will not rise higher and fall immediately, it is better to think of a trading strategy when it shows support by rising above the 5EMA line, HA-Low line, and MS-Signal indicator.
Let's assume that from an uptrend in price, the Heikin Ashi body indicator turns to a downtrend.
Then, if you touch the 5EMA line, the HA-High line, and the MS_Signal indicator, I think you can buy some time to think about a selling strategy.
-------------------------------------------------- -
It doesn't matter how you trade and what tools you use.
What matters is whether you can create a trading strategy.
We tend to spend more time on analysis like chart analysis, economic analysis.
Also, many analytical techniques are studied to do this kind of analysis.
I have spent a lot of time studying various analysis techniques and putting a lot of effort into using them in trading.
However, I realized that acquiring all of these things did not make me a good trader.
The indicators released today also do not mean much in reality.
It merely provides minimal information for creating a trading strategy.
I think it is better to put aside the idea of investing a lot of time in chart analysis and economic analysis and proceeding with trading.
Instead, I recommend spending a lot of time thinking about how to buy at the point or section you are trading, how to sell if the price rises, and how to stop loss if the price falls.
Quickly learn that learning difficult analytical techniques doesn't make you profitable on your trades.
I hope you understand.
An analytical technique or tool that allows you to earn a steady income is the best technique.
Creating a trading strategy is not difficult.
It's just that it feels difficult because I haven't organized my thoughts until now.
trading strategy
1. Investment period
2. Investment scale
3. Trading method and profit realization method
You just need to think in order and then start trading.
The most important thing in this trading strategy is the investment period.
The most important thing is whether to trade the coin (token) you want to trade by investing for a period such as the same day, short term, mid term, or long term.
This is because even though this first button is not connected properly, the following fund management and trading methods are all wrong.
I hope the day will come soon when you can play with the movement of the chart and get away from wrestling with the chart.
thank you.
---------------------------------

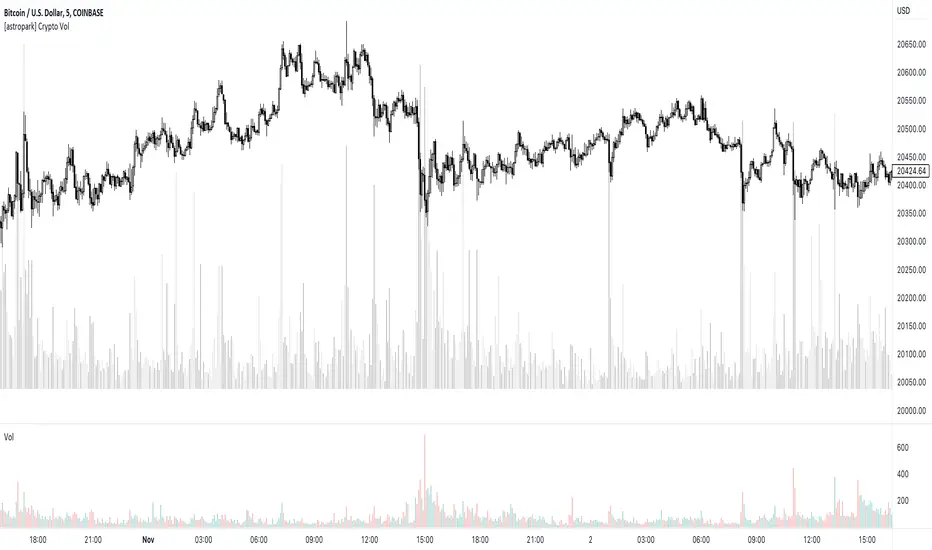
[astropark] Crypto VolumeDear followers,
today I'm releasing a free tool to show on your chart the total volume for the ticker you are navigating amongst most important crypto exchanges , both spot and futures pairs: binance, bybit, ftx, coibase, kucoin, bitget, huobi, bitifnex, kraken.
Hope it can help you to visualize traders' actions at key points and be more profitable!
-- astropark
TradingWolf Premium OscillatorsThe TradingWolf Premium Oscillators is a unique and enhanced selection of oscillators designed to help give you an edge on the markets.
Within this one indicator you will have access to RSI, Stochastic, MACD, Awesome Oscillator, Wavetrend, Zig Zag Pivots and DPO.
Including Divergence and Hidden Divergence signals for them.
Below each indicator is explained along with its enhancements to help you understand it better.
This script comes with the 'TradingWolf Premium' to get access, read the Author’s Instructions below.
There are extensive explanations on how to use these oscillators in our documentation on the website but we will give a simple overview here.
RSI
We try not to mess with these too much because if used correctly, they are very powerful tools. The main differences you will notice is that we have highlighted the areas where you should be paying attention to the oscillator with reversal/continuation zones.
The most popular feature from these will be the 4 divergences which can be toggled on or off in the settings.
Stochastic
Stochastic we have tried to keep as similar to the original as possible, main features are being able to select alternate timeframes for it to be calculated on as well as displaying divergences.
We have created a highlighted zone for when price enters the overbought/sold territory. A lot of traders will look for crossovers happening in these areas however from our tests we have discovered entering trades as the Stochastic comes out of these areas has hugely reduced losing trades, still not a perfect strategy but it does often show that the trend is showing weakening momentum and its commonly followed by a period of sideways action before continuing in a new direction.
MACD
We have calculated a dynamic extreme range for the MACD, you will notice the green/red bars as the bottom and top of the Oscillator. These levels help adjust with the assets volatility so they will work universally on all assets and timeframes. When these levels get more narrow, this indicates there is a potential larger move to come, similar thought process to a Bollinger band squeeze.
We like the Divergence signals you receive whilst in this OB/OS range as they give more confluence behind the divergence signal that price has over extended and is looking to retrace or consolidate.
Awesome Oscillator
The Awesome Oscillator is based on some pretty simple calculations but is hugely powerful.
The 3 main use cases are crossing the 0 value, showing weakening momentum and divergence signals.
We Particularly like the Divergence signals it gives us as they tend to be more accurate than any other oscillator.
Wavetrend
Wavetrend we try describe as a more dynamic Stochastic/MACD, it moves smoother and quicker without giving too many false signals.
Conditions we use the Wavetrend for are similar to the MACD where we are looking for crossovers or divergences in the extreme bands, these shouldn’t be used to trade alone and should be paired with other pieces of confluence for a higher probability trade however this is one of our favourites.
We also have a VWAP extreme detector which we pair with the Wavetrend, helping us identify areas where price should start cooling off.
Zig Zag
The main purpose of the standard Zig Zag is to analyse historical data to be able to observe cycle's in a market's movement, this requires a bit more explanation than we can include here so please refer to our documentation on the website for further guidance.
DPO
The detrended price oscillator is unlike other oscillators, such as the Stochastic or MACD the DPO is not a momentum indicator. It instead highlights peaks and troughs in price, which are used to estimate buy and sell points in line with the historical cycle.
We personally think this is the most under-rated oscillator out there, if you simply followed the DPO above 0 for long and below for short on higher timeframes you can outperform the buy and hold return of Bitcoin (BTCUSDT)...
This is just one simple way of using the DPO there are other more in depth methods of using it within our documentation.

STP PSAR V5PSAR V5: Automate your trading bots to automate your life!
Welcome to the new revolution in trading bots! PSAR V5 is built to automatically change its indicator settings based on real-time market conditions without any human intervention. Instead of setting up 8-10 alerts for each pair, just setup 1 or 2 alerts.
PSAR is our high-frequency scalper that is designed to take hundreds of trades a day and is the most profitable bot available from Swing Trade Pros. PSAR V5 uses multiple filters (SEE BELOW FOR FILTER DESCRIPTIONS) to reduce the risk of using PSAR by filtering out trades that could become stuck, and changes these filters based on real-time market conditions. Even with multiple filters to reduce risk, it is always important for users to manage their risk and accept the risks of running trading bots and strategies.
PSAR V5 is our first fully automated trading bot, changing its own settings based on real-time market conditions. Ever notice how one setting doesn’t work in all market conditions? PSAR V5 solves this by using 4 different trend indicators to detect the trend of the market, and then uses predefined settings for 8 different trend conditions to automatically adjust as the market changes! This reduces risk and saves the user time.
PSAR V5 isn’t just hands-off, set it and forget it for one market condition, PSAR V5 is set it and forget it for ALL market conditions!!!
PSAR V5 is meant for the beginner user, making it easy to setup and easy to adjust with predefined default risk conditions for each market condition. PSAR V5 ADVANCED allows the user to finely tune each setting for every market condition, and is available for our advanced users in VIP .
DETAILED DESCRIPTION OF FILTERS USED:
PSAR TREND: To detect trend, PSAR V5 uses 4 high time frame PSAR filters to detect overall market conditions. By combining lower time frames such as 5 minute and 15 minute with higher time frame such as 4 hour and daily, PSAR trend detection allows for quick reactions during quick market changes while still adapting and staying on trend with overall market conditions using the higher time frames.
This enables PSAR V5 to combine all 4 PSAR trend filters to determine the strength of the overall market while reacting to quick changes, providing 8 different customizable trend conditions which PSAR uses for settings and to trigger up to 8 different bots, allowing the user to risk on when trend is in their favor, and risk off when trend is not in their favor. PSAR V5 also shows NO TREND when there is indecision in the market when all time frames do not agree.
DIVERGENCES: PSAR V5 uses an enhances version of our previous divergence filter to detect loss of strength in the market by detecting divergences in the Relative Strength Index and filtering out those trades.
ADX: PSAR V5 uses the ADX filter to capture the strongest part of a move in price while avoiding the end of the price movement. This allows us to filter out late longs and shorts.
PSAR DISTANCE: Our PSAR Distance filter will filter out any trades that get beyond a predefined distance from the PSAR indicator dots. This is very useful for avoiding tops and bottoms.
REPAINTING: Significant code has been added to avoid repainting by making each high time frame calculation individually within its own time frame, and then using the bar merge method to eliminate repaints.

BE - Volume Scalping ProDear Traders,
Here with presenting the new Indicator (Strategy) for scalping which is primarily built based on the the Volume Analysis.
Idea behind this Indicator: I am sure every trader would agree that Volume is one of the Leading indicator along with Price, and hence thought to use the same for scalping the trades. There is a direct co-relation between the price and volume and thereby used this as a base for arriving at strength of the volume pumped in. Indicator is working on the Logic of "What is the ROC in price for the volume dumped in and does ROC quantify the same which is happened in the recent past of x candles." In order to be successful in scalping trade, Accuracy, Risk to reward and Money Management is very much crucial and hence thought so much on this to make it happen.
Note: Accuracy here being profitable in the trade and not hitting the bulls eye all the time.
What this indicator is providing:
Based on the volume, ROC & Candle Thresholds and using the inputs provided for RISK and Money Management options, Indicator continuously scans for trading opportunities and provides alerts for possible trades.
Alerts & Notifications:
There are basically 3 types of Alerts provided one with General Notification and Other with Dhan HQ notifications to support Algo Trades and AlgoJi for supporting Algo trades too.
Self Declaration:
I have been testing the performance in 30 seconds and 1 min chart and I haven't faced any issues yet. I strongly recommend users to use the same in timeframe less than 10 Min only.
Enjoy!
DISCLAIMER: No sharing, copying, reselling, modifying, or any other forms of use are authorized for our documents, script / strategy, and the information published with them. This informational planning script / strategy is strictly for individual use and educational purposes only. This is not financial or investment advice. Investments are always made at your own risk and are based on your personal judgement. I am not responsible for any losses you may incur. Please invest wisely.
Happy to receive suggestions and feedback in order to improve the performance of the indicator better.

Supertrend, MA 44|6, EMA FIBS 13|21|34I have this indicator based on my strategy. This indicator is based on existing functions available in the system. I haven't added anything new. This indicator uses Supertrend, MA44|6, EMA fibs 13|21|34 combining to find a profitable trade.
- Supertrend : Indicator uses supertrend strategy with default ATR period of 10 and Factor value 3. These values can be customized based on your preferences. Uptrend is denoted by green color and downtrend by red color. You can change the colors based on your preferences.
- MA 44|6: Indicator plots moving averages of 44 and 6. These values can be customized based on your preferences. Although it is highly recommended to keep 44 as is. Value 6 can be adjusted based on your preference. Default color for uptrend is green and for downtrend is red. You can change the colors based on your preferences.
- FIBS EMA 13|21|34: Indicator plots EMA of fibbonacci numbers 13, 21,34 to identify consolidation and breakout. The periods can be adjusted but it is highly recommended not to do so. Default colors for 13,21 and 34 is Aqua, Blue and Navy respectively. You can change the colors based on your preferences.
When to take trade?
To take a trade all conditions needs to be fulfilled.
Supertrend : Always take a trade in the direction of Supertrend. It is always advisable to take trade if the trend is changing or price is taking support of resistance.
MA 44|6: Moving average 44 indicates average price of 44 last candles and 6 for last 6 candles. Price crossing MA 44 indicates change in trend. It is advisable to take trade at crossing the line above or below. If many candles closing near MA 44 then it indicates consolidation. The more far the candle closes from MA44 the better. MA 6 is used to identify when to enter or exit the trade. If candle closes away from MA 6 then you can wait for candle to start near the MA 6 line. If candle closes above/below MA 6 you can exit your trade.
Fibonacci 13|21|34: When all lines are closed it indicates consolidation. When price breakouts to either direction you can take a trade in that direction with following conditions.
Bullish Trade:
When to enter?
If candle closed above MA 44, Supertrend is uptrend and EMA Fibs are moving away and are above MA 44. The price is near to MA 6 line then you can enter into bullish trade. If price is away from MA 6 then you should wait until the price/line comes near to avoid loss.
When to exit?
Price moving in opposite direction:
You should set a stop loss when you enter the trade. The stop loss can be set below the low of the previous candle or any other strategy you have. But it is really important to set the stop loss. If price moves in opposite direction then your stop loss will hit and you will be out of the trade.
Price moving in same direction:
Once you enter the trade you can exit based on two conditions whichever suits you.
1. Exit the trade if candle closes below MA6. The drawback is you may exit too early. You can also adjust the period based on your preferences.
2. Exit the trade if candle closed below low of previous candle. The drawback is you may book less profit but you can capture the movement very well.
Bearish Trade:
When to enter?
If candle closed below MA 44, Supertrend is downtrend and EMA Fibs are moving away and are below MA 44. The price is near to MA 6 line then you can enter into bearish trade. If price is away from MA 6 then you should wait until the price/line comes near to avoid loss.
When to exit?
Price moving in opposite direction:
You should set a stop loss when you enter the trade. The stop loss can be set below the low of the previous candle or any other strategy you have. But it is really important to set the stop loss. If price moves in opposite direction then your stop loss will hit and you will be out of the trade.
Price moving in same direction:
Once you enter the trade you can exit based on two conditions whichever suits you.
1. Exit the trade if candle closes below MA6. The drawback is you may exit too early. You can also adjust the period based on your preferences.
2. Exit the trade if candle closed below low of previous candle. The drawback is you may book less profit but you can capture the movement very well.
When not to take trade?
1. If MA 44 is completely horizontal and EMA Fibs are very close to each other. This indicates that the market is consolidated and if you enter the trade you may hit stop loss very often.
Note: Please note that I am not expert and I don't take any responsibility of your profits or losses. I have created this indicator based on my knowledge and it is for study purpose. Use of this indicator is totally your responsibility. Use all your knowledge and expertise and don't totally depend on the indicator. Don't forget to use stop loss and do money management.
Happy Trading!

Dynamically Adjusting EMA Crossing
The Exponential Moving Average is the most commonly used indicator in every market. but no one can predict which pair of exponential moving average crossing will work best together. Every instrument require different EMAs crossing. It can be 2 EMA crossings or 3 EMA crossings.
Dynamically Adjusting EMA crossing tries to solve this issue. Algorithm finds the optimal EMA crossing setting for every instrument across all timeframes based on the EMA lengths provided in the settings. It evaluates the most profitable crossing combination for each instrument. The logic backtests the different combinations of EMA crossing based on the EMA lengths provided in the indicator's settings.
There are 3 EMA options in the settings Fact, Slow and Long. Indicator's Settings have the option to choose 2 EMA crossings or 3 EMA crossings.
Default Settings
Fast : 5 to 10
Slow : 13 to 19
Long : 20 to 60
Please do keep in mind that the performance of the indicator reduces as we increase the default settings range.
Please contact me for access

Benjamin Graham Net-Net AnalyserA simple indicator that displayers as a table, telling you whether or not the stock you have selected has a current price that is less than 67% of the company's net current asset value per share (NCAVPS) at its last reporting period (FQ, FY, TTM).
Benjamin Graham uses this 67% rule to decide whether or not a stock is significantly undervalued, and studies have shown that investing in companies whose share prices are less than 67% of their NCAVPS can be highly profitable, and will beat markets in the long run.
Feel free to use as you please or repurpose the code for your own projects.

TradingWolf Premium PatternsThe TradingWolf Premium is a one of a kind indicator which can identify charting patterns unlike any others. Standard Chart patterns take 10+ candles to recognise where as ares are almost instant without repainting!
Within this one indicator you will have access to Break Out Levels , Dynamic Support and resistance, Bull Flag, Bear Flag, Rising Wedge, Falling Wedge, Inverse Head & Shoulders, Head & Shoulders, Double Top, Double Bottom, Trend Lines, Ascending Triangle, Descending Triangle, Parallel Channel & Linear Regression Channels.
Below each indicator is explained along with its enhancements to help you understand it better.
This script comes with the 'TradingWolf Premium' to get access, read the Author’s Instructions below.
There are extensive explanations on how to use this indicator in our documentation on the website but we will give a simple overview here.
Break Out Levels
Break out levels are great for breakout traders, this indicator is scanning for strong points of support & resistance, it does this by finding pivot points where price has had a noticeable pull back. From there it will monitor that level and display a signal soon as price breaks it.
Another use case for this indicator is helping identify the market structure direction. If we are breaking up and getting Green triangles, this suggests we are in a bullish up-trending structure and vice versa for red bearish signals.
Support & Resistance
There are lots of ways of deciding how to mark up support and resistance, we like to use ATR values related to daily price action. Marking levels up on lower timeframes tend not to give such good levels to play whereas calculating values from the Higher time frames gives us levels we know are more like to be respected.
Although they are calculated from the daily timeframe you will notice these levels will adjust to the daily price action to make sure they are keeping up to date on levels you need to keep an eye on.
Flags
Flags show signs of continuation, they are confirmed when price breaks the upper resistance for bull flags and lower support for bear flags. They are commonly used in trading but with this indicator, it will help you spot ones you may normally miss. Everyone judges flags differently so we have given you the ability to decide how strict you would like the flags to be with the correlation setting, if you set it to 100% the top and bottom lines of the flag must be going at the exact same angle to count as a valid flag.
Wedges
A wedge pattern is typically a reversal pattern, you would normally use these in correlation with volume. For a confirmed wedge you want declining volume as the price reaches the wedge end. You can either try entering at the top/bottom of the wedge pattern or wait until price breaks into the opposite trending direction.
Head & Shoulders
These are reversal patterns, for a confirmed Head and shoulder pattern you want to pair it with declining volume or momentum
You will notice you have a HF option, when enabled this will scan multiple different lengths of pivots to try spot more patterns which the regular settings may miss. If you think you are getting enough you may want to disable this.
Triangles
Triangles help us identify areas where price starts consolidating in a narrow range, once we reach roughly ¾ of the way through the triangle, we will see a break out in either direction, normally confirmation just requires 1 close out of the triangle along with increased volume. If you miss the initial move you may be able to catch a retest if you are lucky!
Double Tops & Bottoms
These patterns are considered reversal patterns. They are confirmed on the break of the neck line with increased volume.
Trend Lines
These are as simple as the name suggests, the lines are calculated slightly differently to other support and resistance points but they will work the same spotting potential areas where price will bounce or reject.
Channels
Similar to Trend lines but these are looking for trend lines at the same angle forming channels where price tends to range between. You have several options to edit these in the settings including the correlation % of the channel lines, how many candles are allowed outside of the channel (fake outs), sensitivity/ frequency the channels appear and whether you use the Wicks or candle Closes to determine where to calculate the channels from.
Linear Regression Channels
Linear regression is the analysis of two separate variables to define a single relationship and is a useful measure from a technical and quantitative point of view.
As seen in the image above, these can be used to help determine key levels in the chart where price is likely to react. In the settings you will be able to adjust its sensitivity to the levels you like to trade.

Bollinger BandsThis strategy is inspired from Power of Stock aka Subhasish Panni.
Target is minimum 1:3 when you get this setup right.
Buy when:
1) Low is greater than upper band of BB and next candle breaks high of that candle, SL is Low of previous candle which is has low above upper band.
2) High is lower than lower band of BB and next candle breaks high of that candle, SL is low of previous candle which has high lower than lower band.
Sell when:
1) Low is greater than upper band of BB and next candle breaks low of that candle, SL is high of previous candle which is has low above upper band.
2) High is lower than lower band of BB and next candle breaks high of that candle, SL is high of previous candle which has high lower than lower band.
Disclaimer: this setup will cause many small stoploss hit, you have to accept that loss but you will be profitable because of R:R.

Adaptive Parabolic SAR (APSAR) - [MYN]We took the code that we wrote in Myth Busting Strategy #6 to make it more profitable, specifically the timeframe adaptive Parabolic SAR logic and published this as a separate indicator to make it easier for others to use and adopt.
There really is no magic to this. This indicator basically just evaluates the timeframe and derives a multiplier that is applied to the PSAR Max attribute.

Delta Volume Channels [LucF]█ OVERVIEW
This indicator displays on-chart visuals aimed at making the most of delta volume information. It can color bars and display two channels: one for delta volume, another calculated from the price levels of bars where delta volume divergences occur. Markers and alerts can also be configured using key conditions, and filtered in many different ways. The indicator caters to traders who prefer chart visuals over raw values. It will work on historical bars and in real time, using intrabar analysis to calculate delta volume in both conditions.
█ CONCEPTS
Delta Volume
The volume delta concept divides a bar's volume in "up" and "down" volumes. The delta is calculated by subtracting down volume from up volume. Many calculation techniques exist to isolate up and down volume within a bar. The simplest techniques use the polarity of interbar price changes to assign their volume to up or down slots, e.g., On Balance Volume or the Klinger Oscillator . Others such as Chaikin Money Flow use assumptions based on a bar's OHLC values. The most precise calculation method uses tick data and assigns the volume of each tick to the up or down slot depending on whether the transaction occurs at the bid or ask price. While this technique is ideal, it requires huge amounts of data on historical bars, which usually limits the historical depth of charts and the number of symbols for which tick data is available.
This indicator uses intrabar analysis to achieve a compromise between the simplest and most precise methods of calculating volume delta. In the context where historical tick data is not yet available on TradingView, intrabar analysis is the most precise technique to calculate volume delta on historical bars on our charts. TradingView's Volume Profile built-in indicators use it, as do the CVD - Cumulative Volume Delta Candles and CVD - Cumulative Volume Delta (Chart) indicators published from the TradingView account . My Volume Delta Columns Pro indicator also uses intrabar analysis. Other volume delta indicators such as my Realtime 5D Profile use realtime chart updates to achieve more precise volume delta calculations. Indicators of that type cannot be used on historical bars however; they only work in real time.
This is the logic I use to assign intrabar volume to up or down slots:
• If the intrabar's open and close values are different, their relative position is used.
• If the intrabar's open and close values are the same, the difference between the intrabar's close and the previous intrabar's close is used.
• As a last resort, when there is no movement during an intrabar and it closes at the same price as the previous intrabar, the last known polarity is used.
Once all intrabars making up a chart bar have been analyzed and the up or down property of each intrabar's volume determined, the up volumes are added and the down volumes subtracted. The resulting value is volume delta for that chart bar, which can be used as an estimate of the buying/selling pressure on an instrument.
Delta Volume Percent (DV%)
This value is the proportion that delta volume represents of the total intrabar volume in the chart bar. Note that on some symbols/timeframes, the total intrabar volume may differ from the chart's volume for a bar, but that will not affect our calculations since we use the total intrabar volume.
Delta Volume Channel
The DV channel is the space between two moving averages: the reference line and a DV%-weighted version of that reference. The reference line is a moving average of a type, source and length which you select. The DV%-weighted line uses the same settings, but it averages the DV%-weighted price source.
The weight applied to the source of the reference line is calculated from two values, which are multiplied: DV% and the relative size of the bar's volume in relation to previous bars. The effect of this is that DV% values on bars with higher total volume will carry greater weight than those with lesser volume.
The DV channel can be in one of four states, each having its corresponding color:
• Bull (teal): The DV%-weighted line is above the reference line.
• Strong bull (lime): The bull condition is fulfilled and the bar's close is above the reference line and both the reference and the DV%-weighted lines are rising.
• Bear (maroon): The DV%-weighted line is below the reference line.
• Strong bear (pink): The bear condition is fulfilled and the bar's close is below the reference line and both the reference and the DV%-weighted lines are falling.
Divergences
In the context of this indicator, a divergence is any bar where the slope of the reference line does not match that of the DV%-weighted line. No directional bias is assigned to divergences when they occur.
Divergence Channel
The divergence channel is the space between two levels (by default, the bar's low and high ) saved when divergences occur. When price has breached a channel and a new divergence occurs, a new channel is created. Until that new channel is breached, bars where additional divergences occur will expand the channel's levels if the bar's price points are outside the channel.
Prices breaches of the divergence channel will change its state. Divergence channels can be in one of five different states:
• Bull (teal): Price has breached the channel to the upside.
• Strong bull (lime): The bull condition is fulfilled and the DV channel is in the strong bull state.
• Bear (maroon): Price has breached the channel to the downside.
• Strong bear (pink): The bear condition is fulfilled and the DV channel is in the strong bear state.
• Neutral (gray): The channel has not been breached.
█ HOW TO USE THE INDICATOR
Load the indicator on an active chart (see here if you don't know how).
The default configuration displays:
• The DV channel, without the reference or DV%-weighted lines.
• The Divergence channel, without its level lines.
• Bar colors using the state of the DV channel.
The default settings use an Arnaud-Legoux moving average on the close and a length of 20 bars. The DV%-weighted version of it uses a combination of DV% and relative volume to calculate the ultimate weight applied to the reference. The DV%-weighted line is capped to 5 standard deviations of the reference. The lower timeframe used to access intrabars automatically adjusts to the chart's timeframe and achieves optimal balance between the number of intrabars inspected in each chart bar, and the number of chart bars covered by the script's calculations.
The Divergence channel's levels are determined using the high and low of the bars where divergences occur. Breaches of the channel require a bar's low to move above the top of the channel, and the bar's high to move below the channel's bottom.
No markers appear on the chart; if you want to create alerts from this script, you will need first to define the conditions that will trigger the markers, then create the alert, which will trigger on those same conditions.
To learn more about how to use this indicator, you must understand the concepts it uses and the information it displays, which requires reading this description. There are no videos to explain it.
█ FEATURES
The script's inputs are divided in four sections: "DV channel", "Divergence channel", "Other Visuals" and "Marker/Alert Conditions". The first setting is the selection method used to determine the intrabar precision, i.e., how many lower timeframe bars (intrabars) are examined in each chart bar. The more intrabars you analyze, the more precise the calculation of DV% results will be, but the less chart coverage can be covered by the script's calculations.
DV Channel
Here, you control the visibility and colors of the reference line, its weighted version, and the DV channel between them.
You also specify what type of moving average you want to use as a reference line, its source and length. This acts as the DV channel's baseline. The DV%-weighted line is also a moving average of the same type and length as the reference line, except that it will be calculated from the DV%-weighted source used in the reference line. By default, the DV%-weighted line is capped to five standard deviations of the reference line. You can change that value here. This section is also where you can disable the relative volume component of the weight.
Divergence Channel
This is where you control the appearance of the divergence channel and the key price values used in determining the channel's levels and breaching conditions. These choices have an impact on the behavior of the channel. More generous level prices like the default low and high selection will produce more conservative channels, as will the default choice for breach prices.
In this section, you can also enable a mode where an attempt is made to estimate the channel's bias before price breaches the channel. When it is enabled, successive increases/decreases of the channel's top and bottom levels are counted as new divergences occur. When one count is greater than the other, a bull/bear bias is inferred from it.
Other Visuals
You specify here:
• The method used to color chart bars, if you choose to do so.
• The display of a mark appearing above or below bars when a divergence occurs.
• If you want raw values to appear in tooltips when you hover above chart bars. The default setting does not display them, which makes the script faster.
• If you want to display an information box which by default appears in the lower left of the chart.
It shows which lower timeframe is used for intrabars, and the average number of intrabars per chart bar.
Marker/Alert Conditions
Here, you specify the conditions that will trigger up or down markers. The trigger conditions can include a combination of state transitions of the DV and the divergence channels. The triggering conditions can be filtered using a variety of conditions.
Configuring the marker conditions is necessary before creating an alert from this script, as the alert will use the marker conditions to trigger.
Markers only appear on bar closes, so they will not repaint. Keep in mind, when looking at markers on historical bars, that they are positioned on the bar when it closes — NOT when it opens.
Raw values
The raw values calculated by this script can be inspected using a tooltip and the Data Window. The tooltip is visible when you hover over the top of chart bars. It will display on the last 500 bars of the chart, and shows the values of DV, DV%, the combined weight, and the intermediary values used to calculate them.
█ INTERPRETATION
The aim of the DV channel is to provide a visual representation of the buying/selling pressure calculated using delta volume. The simplest characteristic of the channel is its bull/bear state. One can then distinguish between its bull and strong bull states, as transitions from strong bull to bull states will generally happen when buyers are losing steam. While one should not infer a reversal from such transitions, they can be a good place to tighten stops. Only time will tell if a reversal will occur. One or more divergences will often occur before reversals.
The nature of the divergence channel's design makes it particularly adept at identifying consolidation areas if its settings are kept on the conservative side. A gray divergence channel should usually be considered a no-trade zone. More adventurous traders can use the DV channel to orient their trade entries if they accept the risk of trading in a neutral divergence channel, which by definition will not have been breached by price.
If your charts are already busy with other stuff you want to hold on to, you could consider using only the chart bar coloring component of this indicator:
At its simplest, one way to use this indicator would be to look for overlaps of the strong bull/bear colors in both the DV channel and a divergence channel, as these identify points where price is breaching the divergence channel when buy/sell pressure is consistent with the direction of the breach. I have highlighted all those points in the chart below. Not all of them would have produced profitable trades, but nothing is perfect in the markets. Also, keep in mind that the circles identify the visual you would be looking for — not the trade's entry level.
█ LIMITATIONS
• The script will not work on symbols where no volume is available. An error will appear when that is the case.
• Because a maximum of 100K intrabars can be analyzed by a script, a compromise is necessary between the number of intrabars analyzed per chart bar
and chart coverage. The more intrabars you analyze per chart bar, the less coverage you will obtain.
The setting of the "Intrabar precision" field in the "DV channel" section of the script's inputs
is where you control how the lower timeframe is calculated from the chart's timeframe.
█ NOTES
Volume Quality
If you use volume, it's important to understand its nature and quality, as it varies with sectors and instruments. My Volume X-ray indicator is one way you can appraise the quality of an instrument's intraday volume.
For Pine Script™ Coders
• This script uses the new overload of the fill() function which now makes it possible to do vertical gradients in Pine. I use it for both channels displayed by this script.
• I use the new arguments for plot() 's `display` parameter to control where the script plots some of its values,
namely those I only want to appear in the script's status line and in the Data Window.
• I wrote my script using the revised recommendations in the Style Guide from the Pine v5 User Manual.
█ THANKS
To PineCoders . I have used their lower_tf library in this script, to manage the calculation of the LTF and intrabar stats, and their Time library to convert a timeframe in seconds to a printable form for its display in the Information box.
To TradingView's Pine Script™ team. Their innovations and improvements, big and small, constantly expand the boundaries of the language. What this script does would not have been possible just a few months back.
And finally, thanks to all the users of my scripts who take the time to comment on my publications and suggest improvements. I do not reply to all but I do read your comments and do my best to implement your suggestions with the limited time that I have.

ARKA-Fisher TransformThe Fisher Transform is a technical indicator created by John F. Ehlers that converts prices into a Gaussian normal distribution.
The indicator highlights when prices have moved to an extreme, based on recent prices. This may help in spotting turning points in the price of an asset. It also helps show the trend and isolate the price waves within a trend. The Fisher Transform is a technical indicator that normalizes asset prices, thus making turning points in price clearer.
Takeaways
Turning points become a lot clearer with the use of Fisher Transform and its ability to track asset prices. In addition, while some traders choose to look for more dramatic readings that signal to price reversals, others may find it more beneficial to track Fisher Transform directional changes. Although the Fisher Transform is usually applied to asset prices, it can be applied to other indicators as well.
What to look for
As mentioned in the Definition section, the Fisher Transform is a technical indicator that converts price to Gaussian normal distribution, often including data that is not usually normal distributed (i.e. market prices).This causes data to present itself as more uniform, with less extreme changes in order to determine true price reversals in the market.
This technical indicator is what some would call “unbounded,” and therefore it is possible for extremes to occur long-term. The basis of what constitutes an extreme is determined by the historical readings of the asset you are working with. Reading values differ depending on the asset you’re analyzing. Asset readings are important because they have the potential of signalling a reversal, which can be confirmed or denied by Fisher Transform directional changes.
The Fisher Transform will often have a signal line attached. It is essentially the Fisher Transform’s value moving average and moves slower than the traditional indicator’s line. It is often used when the Fisher Transform moves across the trigger line.
Many traders opt to use the Fisher Transform with other indicators that specifically map out trend analysis. This is because the Fisher Transform sends out many different trade signals, some of which are not profitable in the slightest. By pairing it up with other indicators, traders get a more complete picture on when to acknowledge and act on buy and sell signals.
Keep in mind that the Fisher Transform indicator should not be confused for Bollinger Bands. They may look different on a chart, but both are rooted in distribution of asset prices and can often be confused. One way to easily tell them apart is to remember that the Fisher Transform appears on a price chart as a separate indicator, whereas Bollinger Bands are distinctively overlaid over the price.
Limitations
As mentioned in the What to look for section, the Fisher Transform can often send out many trade signals, causing a bit of congestion when all it is trying to do is make reversals and extreme change in price easier for traders to identify. This can become quite an issue, which is why pairing it with another indicator is highly suggested.
Also in this indicator, we can use Histogram and Lines simultaneously.

[blackcat] L3 Banker Fund AttackLevel 3
Background
This indicator is used to capture the movement of the banker fund. The buying and selling point is determined according to whether the momentum of the banker fund and the price momentum resonate.
How to use the indicator:
The red column line indicates that the banker fund accumulation signal appears, and the following 2 conditions are all satisfied to buy; (both above the green line of the banker fund attack threshold)
1. The yellow line and the purple line all cross the red accumulation histogram signal;
2. The yellow and purple trend lines are up
Key point: If the yellow line crosses the green line of the banker fund attack threshold, it will be pulled up or the big market will open! The main thing is to see the red accumulation histogram signal, or the green line that crosses the banker fund attack threshold. If there is a red accumulation histogram signal, it means that there are main low-acquisition chips, and start trading on the left to open a position. The area above the green line of the banker fund attack threshold belongs to the main force pulling stage. When the green line of the banker fund attack threshold is not broken upwards, there is still a lot of profit space, but if it can be effectively broken through, it is highly profitable!
Remarks
This indicator only effective for instruments that contains banker fund. If there is no obvious large fund inside, the indicator is not as meaningful as it is called.
I verified it worked well for > 4H or 1D timeframe. For the other time frames, you may need to check and verify by yourself.
Feedbacks are appreciated.

Step-MA Filtered Stochastic [Loxx]Step-MA Filtered Stochastic is a stochastic indicator with step moving average filtering. This smooths the signal by filtering out noise.
What is the Stochastic Indicator?
The stochastic oscillator, also known as stochastic indicator, is a popular trading indicator that is useful for predicting trend reversals. It also focuses on price momentum and can be used to identify overbought and oversold levels in shares, indices, currencies and many other investment assets.
The stochastic oscillator measures the momentum of price movements. Momentum is the rate of acceleration in price movement. The idea behind the stochastic indicator is that the momentum of an instrument’s price will often change before the price movement of the instrument actually changes direction. As a result, the indicator can be used to predict trend reversals.
The stochastic indicator can be used by experienced traders and those learning technical analysis. With the help of other technical analysis tools such as moving averages, trendlines and support and resistance levels, the stochastic oscillator can help to improve trading accuracy and identify profitable entry and exit points.
Included:
Bar coloring
3 signal variations w/ alerts
Loxx's Expanded Source Types

Blockchain Fundamentals - Active Address Sentiment Osc. [CR]Blockchain Fundamentals: Active Address Sentiment Oscillator AASO
Back with another script today, this one is a useful tool in helping to determine bitcoins value. We are looking at 2 data sources: the daily active addresses on the BTC blockchain, and the daily returns of BTC.
THIS INDICATOR WILL ONLY GIVE YOU THE CORRECT RESULTS ON THE DAILY TIMEFRAME
There is an interesting relationship that you can see by comparing the two timeseries. But for us to create a good indicator we first need to normalize the data. So we look at the percent change over the past 28 days for each metric (DAA and price).
THIS INDICATOR WILL ONLY GIVE YOU THE CORRECT RESULTS ON THE DAILY TIMEFRAME
We then calculate standard deviation bands around the DAA metric. We finalize them by averaging the bands over a 28 day period.
When the Price series (yellow line) is higher than the SD bands BTC is considered overvalued or price is overheated. A pullback could be expected soon. When the Price series is below the SD bands BTC is considered undervalued or price is oversold.
THIS INDICATOR WILL ONLY GIVE YOU THE CORRECT RESULTS ON THE DAILY TIMEFRAME
This tool doesnt give signals on the one minute chart or tell you exactly when to buy or sell. BUT what it does do is act as a convenient macro sentiment indicator that is not based completely upon price.
In an attempt to narrow down the really juicy areas, if you seen the background color highlights with white, that means its likely a top or bottom. At the very least on a local sense and many times in a cyclical macro sense as well. It also narrows down the signal to a generally more profitable area.
This indicator is not meant to be used on timeframes other than daily (did I mention that already?). I am lazy and did not code the calculations to be MTF (which is why you have to use on the daily chart). If you want to code this, please forward it on to me and I will post an update with a heartfelt credit to you.

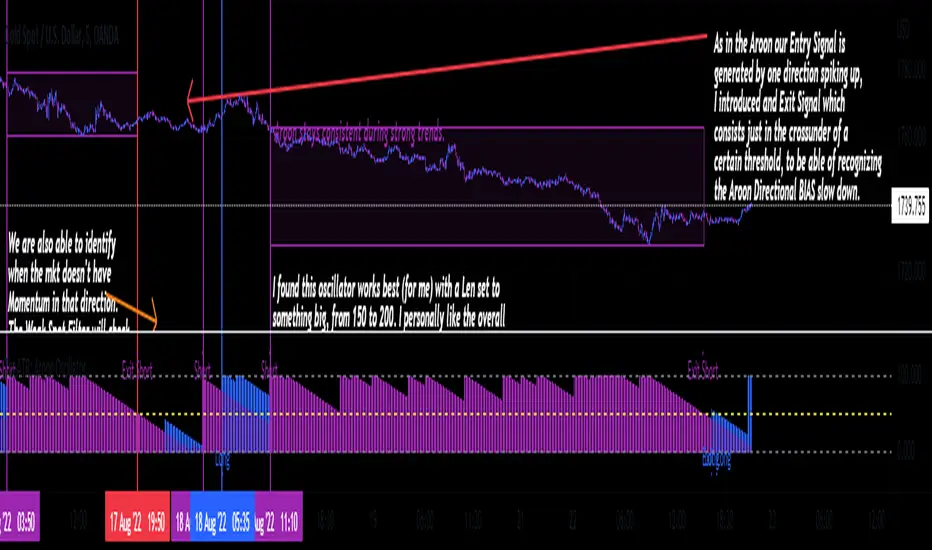
TheATR: Aroon Oscillator.Aroon Oscillator (AO).
The Aroon Oscillator, was developed by Tushar Chande, in 1995, to highlight the start of a new trend and to measure trend strength.
I re-branded a bit the whole thing, If you are familiar with how this Oscillator usually is, you are going to notice the differences.
Aroon Oscillator Components.
1 - Aroon Up -> Bullish Directional Component, highlighted in blue.
2 - Aroon Down -> Bearish Directional Component, highlighted in purple.
We also have the Oscillators static thresholds, which are:
- 0 Line.
- 100 Line.
- Exit Signal Line Level.
How to read the Aroon Oscillator.
The AO main goal, is to identify the trend from its first stages, to then come up with how strong that trend is.
So, classic interpretation for the AO would be:
-Aroon Up>Aroon Down = Bull Scenario.
-Aroon Up
Crypto Terminal [Kioseff Trading]Hello!
Introducing Crypto Terminal (:
The indicator makes use of cryptocurrency data provided by vendor INTOTHEBLOCK.
NOTE: The cryptocurrency on your chart must be paired with USD or USDT. Data won't load otherwise - possibly transient. For instance, BTCUSD or BTCUSDT, ETHUSD or ETHUSDT.
Provided datasets:
Twitter Sentiment Data
Telegram Sentiment Data
Whale Data (i.e. % of Asset Belonging to Whales)
$100,000+ Transactions
Bulls/Bears (Bulls Buying | Bears Selling)
Current Position PnL (Currently Open Positions for the Coin are Retrieved and Plotted. Data is Split into Currently Profitable Positions, Losing Positions, and B/E Positions)
Average Balance
Holders/Traders Percentage (Addresses are Retrieved and Classified as Holding Accounts or Trader Accounts)
Correlation
Futures OI
Perpetual OI
Zero Balance Addresses
Flow (Money Inflow & Outflow)
Active Addresses
Average Transaction Time
Realized PnL (Addresses with Realized Profits, Realized Losses, and B/E)
Cruisers
A few more data points are provided.
Additionally, you can plot the values of any dataset in a pane below price.
Below are images of plottable data; different cryptocurrencies will be shown for each example (:
Twitter sentiment data.
Assess this data lightly; difficult to confirm accuracy.
Telegram sentiment data.
Assess this data lightly; difficult to confirm accuracy.
Percentage of asset belonging to whales.
$100,000+ transactions (volume oriented)
Bulls buying; bears selling.
Current positions at profit; current positions at loss; current positions at breakeven.
Average balance.
Percentage of asset belonging to traders; percentage of asset belonging to holders.
Asset's 30-interval correlation to BTC.
Perpetual open interest.
Zero-balance addresses.
Flows.
Active addresses.
Average transaction time.
Addresses at realized profit; addresses at realized loss; addresses at breakeven.
Cruiser data.
Futures open interest.
Naturally, this data isn't provided for every cryptocurrency; NaN values are returned in some instances.
Table 1
I provided three data tables, which load independently, so you don't have to change plotted data to access values.
Table 2
Lastly, you can create a 10-asset crypto index and run calculations against it.
The image shows an example.
I'll update this script with additional calculations/data in the near future. If you've any suggestions - please let me know!
Enjoy (:
