Trend dealing rangeHi all!
This indicator will help you find the current dealing range according to the trend. If the trend is bullish the indicator will look for a range between the latest low pivot to the latest high pivot. Vice versa in a bearish trend. The code uses my new library 'FibonacciRetracement' () that has the same code as my other indicator 'Fibonacci retracement' ().
It plots 5 lines from the low to the high and labels them 0 %, 25 %, 50 %, 75 % and 100 %. A trendline can be drawn between the two pivots (dashed and gray by default). Firstly you can define the pivot lengths used, this setting is in the 'Market structure' section but it also applies to the dealing range (it defaults to 5 (left) and 2 (right)). You can show prices if you want to (shown in parantheses, off by default). You can change the default labels position (from left) and the font size (12 by default and higher up it's 7 for market structure text). Lastly you can change the alert frequency (defaults to once per bar close) and the price that has to enter a zone for alert to be sent. 'Close' means that the closing price (or current price if you change the alert frequency to all or once per bar) has to be inside the zone and 'Wick' means that the entire candle needs to be inside the zone.
It's very useful for traders to find the current dealing range and this indicator will help you to do so.
So, this indicator will give you the dealing range and basic market structure through break of structures and change of characters.
If you have any input or suggestions on future features or bugs, don't hesitate to let me know!
Best of trading luck!
Cari dalam skrip untuk "range"

Time Based Range CandleThis indicator creates a visual candle representation from price action during a specified time period.
Key Features:
Configurable Sessions: Set any calculation period (when range is measured) and display period (when visualization appears)
Candle Visualization: Draws a large candle showing open, close, high, low with proper body coloring
Wick/Tail Analysis: Displays wicks and tails with quarter-level subdivisions based on candle type (bullish vs bearish)
End Marker: Vertical line marks exactly when the calculation period ends
Quarter Lines: Optional dotted/dashed lines showing 25%, 50%, 75% levels within body, wicks, and tails
Common Use Cases:
Overnight range analysis (18:00 - 6:00 ET) displayed during regular hours
Session-based range trading (Asian, London, NY sessions)
Custom time period analysis for any market
The indicator follows proper candle terminology where wicks and tails are measured differently for bullish vs bearish candles, making it useful for precise level analysis and range trading strategies.

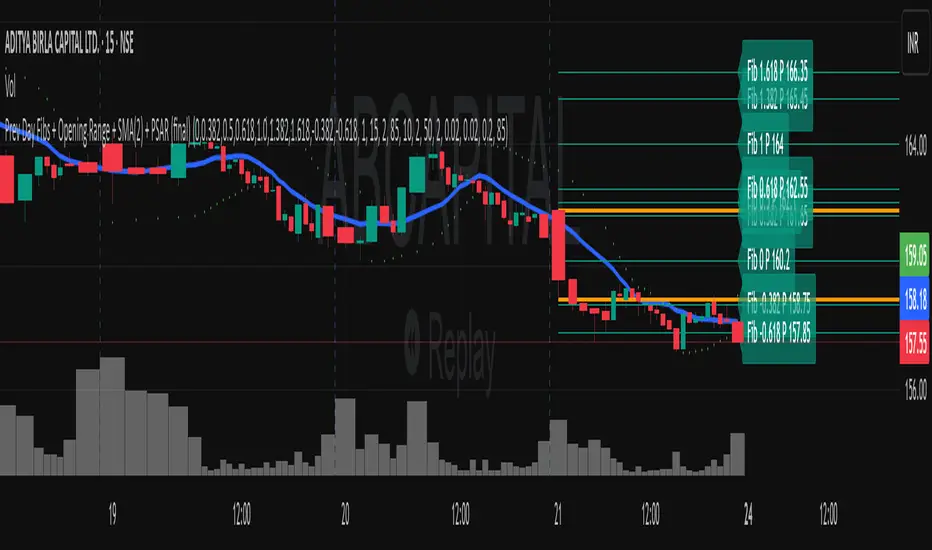
Previous Day Fibonacci + Opening RangePrev Day Fibonacci & Opening Range Levels
This indicator is designed for professional traders who want to combine yesterday’s market structure with today’s intraday levels.
🔹 Features:
Automatic Fibonacci Retracements: Draws customizable Fibonacci retracement/extension levels based on the previous day’s High & Low.
Full Customization: Users can adjust the Fibonacci ratios and colors directly in settings.
Opening Range Levels: Plots today’s first candle High & Low (user-selectable timeframe for OR).
Clear Visuals: Helps identify key reversal zones, breakout levels, and confluence areas between higher timeframe structure and intraday moves.
🔹 Usage Ideas:
Spot potential reversal zones when price reacts to previous-day Fib levels.
Combine Opening Range breakout strategies with daily Fib levels for high-probability setups.
Use as confluence levels with your existing price action or indicator-based strategy.
⚡ Pro Tip: Look for overlaps between the Opening Range and Fibonacci retracements — these zones often act as strong support/resistance areas.
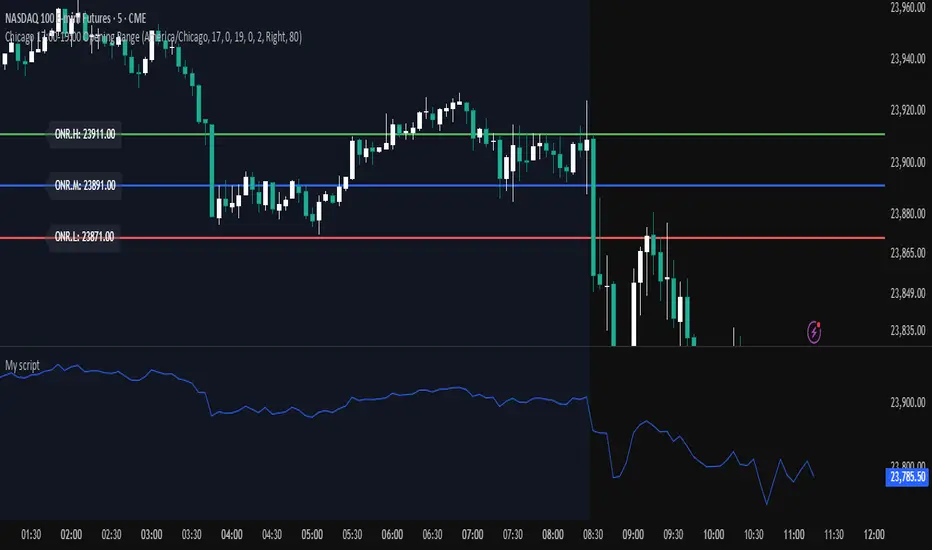
Chicago 17:00-19:00 Overnight RangeThis indicator will map out range high and range low of previous 17:00 - 19:00 of the chart. It can also display mid range if needed
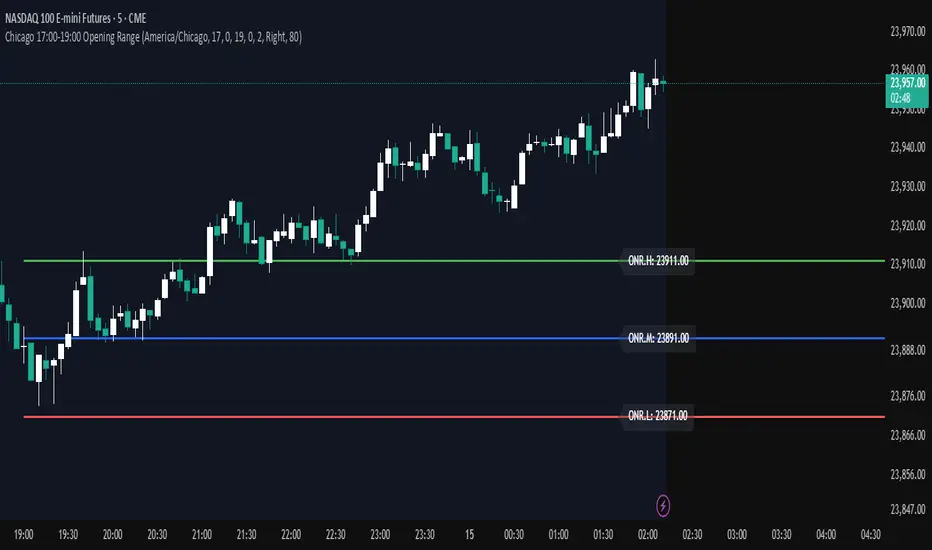
Opening Range — Chicago 17:00-19:00 (Customizable)Maps opening 2 hour range of Chicago timezone with the range high range low and medium zone. It can be customized to fit your needs
CP Strat ORBnew york opening range breakout and retest allows you to enter a trade with a better clarity if the price comes back and retest the range

Closing RangeFInd the closing range, This script used to find the closing range of a stock in bar chart

Opening Range Breakout (9:30 - 9:45 EST)Here's a Pine Script (v5) for TradingView that plots the Opening Range Breakout (ORB) lines from 9:30 AM to 9:45 AM EST on a 15-minute chart.
It draws a green line at the high of the opening range and a red line at the low, both extending through the rest of the day.

Modular Range-Trading Strategy (V9.2)# 模块化震荡行情策略 (V9.2)
# Modular Range-Trading Strategy (V9.2)
## 策略简介 | Strategy Overview
该策略基于布林带 (Bollinger Bands)、RSI、MACD、ADX 等经典指标的组合,通过多逻辑模块化结构识别震荡区间的价格反转机会,支持多空双向操作,并在相同逻辑下允许智能加仓,适用于震荡市场的回测和研究。
This strategy combines classic indicators such as Bollinger Bands, RSI, MACD, and ADX to identify price reversal opportunities within ranging markets. It features a modular multi-logic structure, allowing both long and short trades with intelligent pyramiding under the same logic. It is designed for backtesting and research in range-bound conditions.
---
## 功能特点 | Key Features
- **多逻辑结构**:支持多套震荡逻辑(动能确认均值回归、布林带极限反转等)。
- **加仓与仓位互斥**:同逻辑下可智能加仓,不同逻辑间自动互斥,避免冲突。
- **回测可调时间范围**:可自定义回测起止时间,精准评估策略表现。
- **指标可视化**:布林带、RSI、MACD 及动态 ATR 止损线实时绘图。
- **K线收盘确认信号**:通过 `barstate.isconfirmed` 控制信号,避免未收盘的虚假信号。
- **Multi-logic structure**: Supports multiple range-trading logics (e.g., momentum-based mean reversion, Bollinger Band reversals).
- **Pyramiding with mutual exclusion**: Allows intelligent pyramiding within the same logic while preventing conflicts between different logics.
- **Adjustable backtesting range**: Customizable start and end dates for accurate performance evaluation.
- **Visual indicators**: Real-time plotting of Bollinger Bands, RSI, MACD, and dynamic ATR stop lines.
- **Close-bar confirmation**: Uses `barstate.isconfirmed` to avoid false signals before bar close.
---
## 使用说明 | Usage
1. 将该脚本添加到 TradingView 图表。
2. 在参数中设置回测时间段和指标参数。
3. 仅用于学习与策略研究,请勿直接用于实盘交易。
1. Add this script to your TradingView chart.
2. Configure backtesting dates and indicator parameters as needed.
3. For educational and research purposes only. **Not for live trading.**
---
## ⚠️ 免责声明 | Disclaimer
本策略仅供学习和研究使用,不构成任何形式的投资建议。
作者不参与任何实盘交易、资金管理或收益分成,也不保证策略盈利能力。
严禁将本脚本用于任何非法集资、私募募资或与虚拟货币相关的金融违法活动。
使用本策略即表示您自行承担所有风险与法律责任。
This strategy is for educational and research purposes only and does not constitute investment advice.
The author does not participate in live trading, asset management, or profit sharing, nor guarantee profitability.
The use of this script in illegal fundraising, private placements, or cryptocurrency-related financial activities is strictly prohibited.
By using this strategy, you accept all risks and legal responsibilities.
---

Breakout Range Signal with Quality Analysis [Dova Lazarus]📌 Breakout Range Signal with Quality Analysis
🎓 Training-focused indicator for breakout logic, SL & TP behavior and signal quality assessment
🔷 PURPOSE
This tool identifies breakout candles from a calculated channel range and visually simulates entries, stop losses, and take profits, providing live and historical performance metrics.
⚙️ MAIN SETTINGS
1️⃣ Channel Setup
channel_length = 10 → how many candles are averaged to form channel boundaries
channel_multiplier = 0.0 → adds expansion above/below the base channel
channel_smoothing_type = SMA → smoothing method for high/low averaging
📊 The channel consists of two moving averages: one from highs, the other from lows. When expanded (via multiplier), it creates a buffer range for breakout validation.
2️⃣ Signal Detection
Body > Channel % = 50 → a breakout candle's body must exceed 150% of the channel width
Signal Mode:
• Weak → every valid breakout candle is highlighted
• Strong → only the first signal in a sequence is shown (helps reduce noise)
🟦 Bullish signals (blue):
• Candle opens inside the channel
• Closes above the channel
• Body is large enough
• Optional: confirms with trend (if enabled)
🟨 Bearish signals (yellow):
• Candle opens inside the channel
• Closes below the channel
• Body is large enough
• Optional: confirms with trend
3️⃣ Trend Filter (optional)
Enabled via checkbox
Uses a higher timeframe MA to filter signals
Bullish signals are allowed only if price is below the trend MA
Bearish signals only if price is above it
⏱️ trend_timeframe = 1D (typically set higher than the chart's timeframe)
🟢 Trend line is plotted if enabled
🎯 ENTRY, STOP LOSS & TAKE PROFIT LOGIC
SL and TP are based on channel width, not fixed pip/tick size:
📍 Entry Price = close of the breakout candle
🛑 Stop Loss:
• Bullish → below the lower channel border (minus offset)
• Bearish → above the upper channel border (plus offset)
🎯 Take Profit:
• Bullish → entry + channel width × profit multiplier
• Bearish → entry − channel width × profit multiplier
You can control:
Profit Target Multiplier (e.g., 1.0 → TP = 1×channel width)
Stop Loss Target Multiplier (e.g., 0.5 → SL = 0.5×channel width)
Signals to Show = how many historical SL/TP setups to display
📈 Lines and labels ("TP", "SL") are drawn on the chart for clarity.
🧪 QUALITY ANALYSIS MODULE
If enabled, the indicator will:
Track each new signal (entry, SL, TP)
Analyze outcomes:
• Win = TP hit before SL
• Loss = SL hit before TP
• Expired = signal unresolved after N bars
Display statistics in a table (top-right corner):
📋 Table fields:
✅ Overall win rate
📈 Bullish win rate
📉 Bearish win rate
🔢 Total signals
🕓 Pending (still active trades)
Maximum bars to wait for outcome is customizable (max_bars_to_analyze).
📐 VISUALIZATION TOOLS
TP / SL lines per signal
Labels “TP” and “SL”
Optional channel lines and trendline for better context
Colored bars for valid signals (blue/yellow)
📌 BEST USE CASES
Understand how breakout signals are formed
Learn SL/TP logic based on dynamic range
Test how volatility affects trade outcomes
Use as a visual simulation of trade behavior over time

Twin Range Filter – Buy/Sell SignalsThe Twin Range Filter is a trend-following indicator that combines two adaptive volatility filters to identify potential market reversals and trend continuations. It uses two configurable smoothing periods (fast and slow) to calculate a dynamic range around price, filtering out market noise and highlighting meaningful shifts in direction.
This indicator plots BUY and SELL signals based on price action in relation to the range filter, as well as internal trend conditions.
✅ How It Works:
Long Signal (BUY) is triggered when:
Price is above the filtered range (showing strength), and
Short-term upward momentum is confirmed.
Short Signal (SELL) is triggered when:
Price is below the filtered range (showing weakness), and
Short-term downward momentum is confirmed.
The signals are highlighted using green "Long" and red "Short" labels on the chart.
Background colors reinforce the current directional bias.
🔔 Alerts:
Long Signal – A new BUY condition has been detected.
Short Signal – A new SELL condition has been detected.
📌 Use Cases:
Entry timing for swing or intraday trades
Trend confirmation filter
Signal generator in automated strategies (when paired with a strategy script)
ORB Range Indicator with Fibonacci Targets
This script plots the Opening Range (ORB) high and low based on a configurable time window (5–45 minutes from the U.S. session open at 9:30 AM EST).
Once the ORB window closes, the indicator draws horizontal lines marking:
ORB High and Low
The size of the range in price and %
Fibonacci-based price targets above and below the range (0.382, 0.618, 1.000, 1.618, 2.000)
You can control:
Which Fibonacci levels to display
Whether to show long targets, short targets, or both
All drawings are automatically cleared at the start of each trading day.
Ideal for breakout traders using ORB and Fibonacci extensions for target planning.

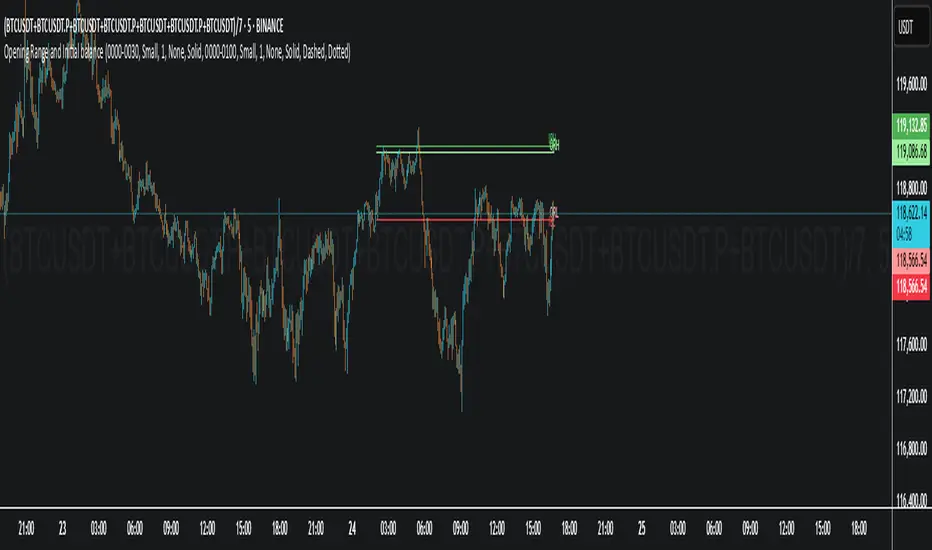
Opening Range and Initial balanceThis indicator represents Opening Range and Initial Balance levels.
Opening Range represents the high and low established during the first few minutes of the trading session — usually 5, 15 or 30 minutes.
Initial Balance represents the high and low established during the first hour of the trading session.
Average Daily Range in TicksPurpose: The ADR Ticks Indicator calculates and displays the average daily price range of a financial instrument, expressed in ticks, over a user-specified number of days. It provides traders with a measure of average daily volatility, which can be used for position sizing, setting stop-loss/take-profit levels, or assessing market activity.
Calculation: Computes the average daily range by taking the difference between the daily high and low prices, averaging this range over a customizable number of days, and converting the result into ticks (using the instrument's minimum tick size).
Customization: Includes a user input to adjust the number of days for the average calculation and a toggle to show/hide the ADR Ticks value in the table.
Risk Management: Helps traders estimate typical daily price movement to set appropriate stop-loss or take-profit levels.
Market Analysis: Offers insight into average daily volatility, useful for day traders or swing traders assessing whether a market is trending or ranging.
Technical Notes:
The indicator uses barstate.islast to update the table only on the last bar, reducing computational load and preventing overlap.
The script handles different chart timeframes by pulling daily data via request.security, making it robust across various instruments and timeframes.

Multi Pivot Point & Central Pivot Range - Nadeem Al-QahwiThis indicator combines four advanced trading modules into one flexible and easy-to-use script:
Traditional Pivot Points:
Calculates classic support and resistance levels (PP, R1–R5, S1–S5) based on previous session data. Ideal for identifying key turning points and mapping out the daily, weekly, or monthly structure.
Camarilla Levels:
Provides six upper and lower pivot levels (H1–H6, L1–L6) derived from volatility and closing price formulas. Especially effective for intraday reversal, mean reversion, and finding overbought/oversold extremes.
Central Pivot Range (CPR):
Plots the median, top, and bottom of the value area each session. CPR width instantly highlights whether the market is likely to trend (narrow CPR) or remain range-bound (wide CPR).
Developing CPR projects the evolving range for the current period—essential for real-time analysis and pre-market planning.
Dynamic Zone Levels (DZL):
Automatically detects and highlights clusters of pivots to reveal high-probability support/resistance zones, filtering out market “noise.”
DZL alerts notify you whenever price breaks or retests these key areas, making it easier to spot momentum trades and avoid false signals.
Key Features:
Multi-timeframe flexibility: Use with daily, weekly, monthly, yearly, or custom timeframes—even rare ones like biyearly and decennial.
Modular design: Activate or hide any system (Traditional, Camarilla, CPR, DZL) as you need.
Bilingual interface: Every setting and label is shown in both English and Arabic.
Full customization: Control visibility, color, style, and placement for every level and label.
Historical depth: Plot up to 5,000 pivot/zones back for deep analysis and backtesting.
Smart alerts: Get instant notifications on true S/R breakouts or retests (from DZL).
How to Use:
Trend Trading:
Watch for a very narrow CPR to identify potential trending days—trade in the breakout direction above/below the CPR.
Range Trading:
When CPR is wide, expect sideways movement. Fade reversals at R1/S1 or within the CPR boundaries.
Breakouts:
Use DZL alerts to capture momentum as price breaks or retests dynamic support/resistance zones.
Multi-Timeframe Confluence:
Combine CPR and pivot levels from multiple timeframes for higher-probability entries and exits.
All calculations and logic are fully open.

OBR 15min Session Opening Range Breakout + Volume Trend DeltaQuick Overview
This Pine Script plots the opening range for London and New York sessions, highlights breakout levels, draws previous session pivots, and offers a live volume delta table for trend confirmation.
Session Opening Range
- Captures the high/low of the first 15 minutes (configurable) for both London & NY sessions.
- Fills the range area with adjustable semi‑transparent colors.
- Optional alerts fire on breakout above the high or below the low.
Previous Session Levels
- Automatically draws previous day’s High, Low, Open and previous 4‑hour High/Low.
- Helps identify key S/R zones as price approaches ORB breakouts.
Volume Trend Delta
- Uses a CMO‑weighted moving average and ATR bands to detect trend state.
- Accumulates bullish vs. bearish volume during each trend.
- Displays Bull Vol, Bear Vol, and Delta % in a movable table for quick strength checks.
How to Use
1. Let the opening range complete (first 15 min).
2. Look for price closing above/below the ORB—enter long on an upside break, short on a downside break.
3. Check the Volume Delta table: positive delta confirms buying strength; negative delta confirms selling pressure.
4. Use previous day/4h levels as additional support/resistance filters.
Settings & Customization
- ORB Duration & Session Times (London/NY), fill colors, and toggles.
- Enable/disable Previous Day & 4H levels.
- Trend Period, Momentum Window, and Delta table position/size.
- Pre‑built alert conditions for all ORB breakouts.
Developer Notes
- Fully commented for easy adjustments.
- Modular sections: ORB, previous levels, trend delta, and alerts.
- No external libraries—pure Pine Script v6.
Tip
Combine ORB breakouts with Volume Delta and prior session pivots to filter false signals and trade stronger, more reliable moves.

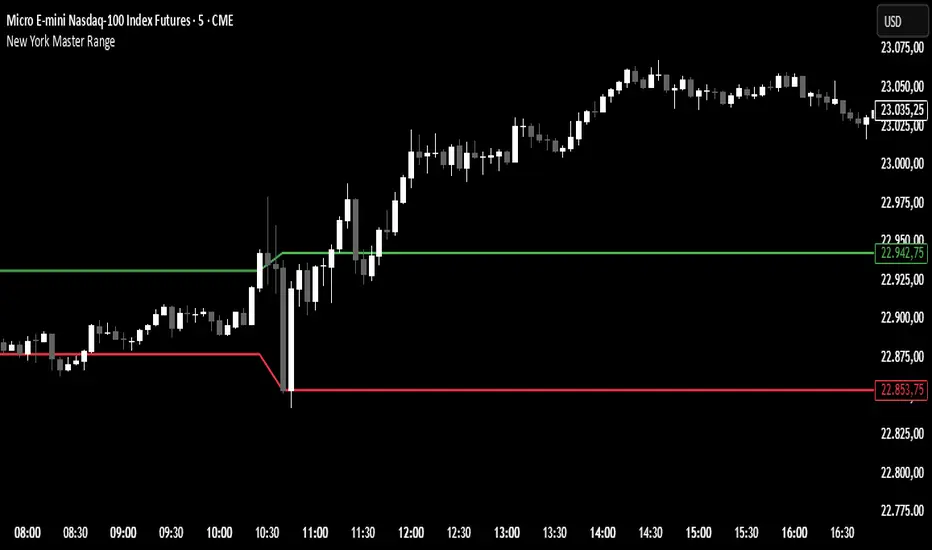
New York Master Range📈 New York Master Range (5-Min Timeframe)
Description:
This custom TradingView indicator captures the opening range based on the body high and low of the first 3 candles after 10:30 AM (BRT – Brasília Time) on the 5-minute timeframe — a technique often used during the New York market session.
🔍 How it works:
At exactly 10:30 AM (BRT), the indicator starts collecting the highs and lows of candle bodies (not wicks) for the next 3 five-minute candles.
Once the 3 candles are processed, the highest close/open (body high) and lowest close/open (body low) are plotted as static green and red lines on the chart.
These levels can act as key intraday support/resistance zones or range breakout triggers.
Essa's Sessions IndicatorOverview
This powerful tool is designed to visually map out the key trading sessions: Asia, London, and New York directly on your chart. By highlighting these periods and plotting their respective highs and lows, it helps you identify critical price levels, gauge market sentiment, and pinpoint potential breakout opportunities with ease.
What It Does
Visualizes Key Trading Sessions: Automatically draws colored backgrounds for the Asia, London, and New York sessions to show you exactly when the most important market activity is happening.
Plots Session Highs & Lows: Displays precise horizontal lines for the highest and lowest prices reached during each session, acting as key support and resistance levels.
Dual Timezone Mode: Easily switch between London (GMT/BST) and New York (EST/EDT) timezones with a single click. The indicator automatically adjusts all session times for you, ensuring accuracy no matter where you are.
Interactive & Informative Labels: Hover over any session high or low label to see a detailed tooltip containing:
The exact price level.
The session's price range (calculated in pips or points).
The total daily price range for broader context.
A simple volatility gauge (from "Low Vol 😴" to "High Vol 🔥").
Customizable Alerts: Enable breakout alerts to receive instant notifications the moment the price closes above a session high or below a session low.
Simple, powerful, and highly informative, this indicator is an essential tool for traders looking to build strategies around session-based price action.

Opening Range Breakout (ORB) with Fib RetracementOverview
“ORB with Fib Retracement” is a Pine Script indicator that anchors a full Fibonacci framework to the first minutes of the trading day (the opening-range breakout, or ORB).
After the ORB window closes the script:
Locks-in that session’s high and low.
Calculates a complete ladder of Fibonacci retracement levels between them (0 → 100 %).
Projects symmetric extension levels above and below the range (±1.618, ±2.618, ±3.618, ±4.618 by default).
Sub-divides every extension slice with additional 23.6 %, 38.2 %, 50 %, 61.8 % and 78.6 % mid-lines so each “zone” has its own inner fib grid.
Plots the whole structure and—optionally—extends every line into the future for ongoing reference.
**Session time / timezone** – Defines the ORB window (defaults 09:30–09:45 EST).
**Show All Fib Levels** – Toggles every retracement and extension line on or off.
**Show Extended Lines** – Draws dotted, extend-right projections of every level.
**Color group** – Assigns colors to buy-side (green), sell-side (red), and internal fibs (gray).
**Extension value inputs** – Allows custom +/- 1.618 to 4.618 fib levels for personalized projection zones.
Morning Structure – Live 30 Min Range📝 Description:
This indicator captures the morning price structure by tracking the high and low during the first 30 minutes after market open (default: 9:30 AM to 10:00 AM, New York time).
🔧 How it works:
At market open, it begins tracking the highest high and lowest low
The high and low lines are dynamic and update in real-time during the first 30 minutes
Once the 30-minute range completes, the lines freeze at their final values
Lines extend horizontally across the rest of the session to mark the "Morning Range"
✅ Key Features:
Tracks live price action during the morning session
Freezes the structure after 30 minutes (or user-defined)
Automatically resets each new trading day
Built-in timezone setting (America/New_York) to align with standard U.S. market hours
Clean visual lines that scroll naturally with the chart
⚙️ Use Cases:
Identify morning breakout zones
Define support and resistance early in the session
Combine with breakout, fade, or range-trading strategies
⚠️ Note:
This version does not include alerts or labels, by design (clean and focused).
Those can be added easily for custom strategies.

Simple Sessions & LevelsWhat this indicator does:
This script marks out two essential types of price levels for intraday and swing traders:
The high and low of a customizable 15-minute opening range after the market/session open.
The previous day’s high, midpoint (“halfback”), and low.
How it works:
The script lets you set the session start time (hour and minute) to match your market.
It then calculates the high and low of the first 15 minutes after the session opens and plots those as solid lines.
It also plots the prior day’s high, halfback (midpoint), and low on your chart for easy reference.
Each line and each label can be toggled on or off independently in the settings for maximum customization.
Colors for each level are also fully customizable.
How to use it:
Add the script to your chart.
Set the session start hour and minute to match the open of the market or instrument you trade.
Choose which levels and labels you want displayed by using the toggles in the settings.
The indicator will automatically draw the session range and prior day levels for you.
Use these lines as reference for key support, resistance, and potential trade entry/exit points.
What makes it unique and useful:
This tool combines a flexible session opening range with classic daily reference levels in one package. You have complete control over which levels and labels are shown, making it adaptable for any trading style. It’s especially useful for day traders who want to quickly identify volatility windows and the most important price levels from the previous session.

Percent Change of Range Candles - FullPercent Change of Range Candles – Full (PCR Full)
Description:
PCR Full is a custom momentum indicator that measures the percentage price change relative to a defined range, offering traders a unique way to evaluate strength, direction, and potential reversals in price movement.
How it works:
The main value (PCR) is calculated by comparing the price change over a selected number of candles (length) to the range between the highest high and lowest low in the same period.
This percentage change is normalized and visualized with dynamic candles on the subgraph.
Reference levels at +100, +50, 0, -50, and -100 serve as key zones to indicate potential overbought/oversold conditions, continuation, or neutrality.
How to read the indicator:
1. Trend continuation:
When PCR breaks above +50 and holds, it often confirms a strong bullish move.
Similarly, values below -50 and staying low signal a bearish continuation.
2. Wick behavior (volatility insight):
Long wicks on PCR candles suggest uncertainty or failed breakout attempts.
Short or no wicks with strong body color show stable momentum and conviction.
On the chart, multiple long wicks near -50 suggest bulls are attempting to push price upward, but lack the strength — until a confirmed breakout.
3. Polarity transition (Bearish to Bullish or vice versa):
A transition from negative PCR values to above zero shows that the market is possibly turning.
Especially if PCR climbs gradually and stabilizes above zero, it indicates a developing bullish phase.
Components:
Main PCR line: Color-coded (green for rising, red for falling).
Open Average (gray line): Smooths recent PCR values, indicating balance.
High/Low adaptive bands: Adjust dynamically to PCR polarity.
PCR Candles: Visualize OHLC of PCR data for enhanced interpretation.
Suggested use cases:
Enter trend trades when PCR crosses +50 or -50 with volume or price confirmation.
Watch for reversal signs near ±100 if PCR fails to break further.
Use 0 line as a neutral zone — markets hovering near 0 are often in consolidation.
Combine with price action or oscillators like RSI/MACD for additional signals.
Customization:
The length input allows users to define the range for PCR calculations, making it adjustable to various timeframes and strategies (scalping, intraday, swing).

Haven Average Daily RangeOverview
This indicator is an enhanced version of the traditional ADR tool that adapts to intraday price movements. Unlike static ADR levels, this indicator dynamically adjusts its range boundaries based on real-time price action while maintaining the original ADR calculation framework.
Key Features
ADR calculation based on multiple periods (5, 10, and 20 days)
ADR levels displayed with automatic style changes upon range reach
Customizable display settings (color, line style)
Price labels for better visualization
The indicator helps traders assess the instrument's volatility, identify potential reversal zones, and plan daily trading targets.
Suitable for all timeframes up to D1 and any trading instrument.
How It Works
Session Start (UTC+0): Calculates ADR based on historical data and sets initial High/Low levels
Dynamic Phase: Monitors price action and adjusts the opposite boundary (ADR Low or High) when new extremes are reached.
When price creates new Day high price above the opening price, the ADR Low level moves upward proportionally.
When price creates new Day low price below the opening price, the ADR High level moves downward proportionally.
Completion Phase: Stops adjustments and highlights breach when price reaches either boundary
Trading Application
Entry and Exit Signals
The ADR boundaries serve as key decision points for trade execution. When price approaches the upper ADR boundary, it often signals a potential selling zone, particularly when confluence exists with other overbought indicators such as RSI divergence or resistance levels. Conversely, price reaching the lower ADR boundary frequently indicates potential buying opportunities, especially when supported by oversold conditions or support confluences.
Trend Continuation Assessment
One of the most valuable applications is gauging the probability of continued directional movement. When the current session's price action has not yet reached either ADR boundary, statistical probability favors trend continuation in the established direction. This information helps traders stay with profitable positions longer rather than exiting prematurely.
Reversal and Consolidation Zones
The visual color change to orange when ADR boundaries are reached provides immediate feedback that the normal daily range has been exhausted. At this point, the probability of trend reversal or sideways consolidation increases significantly. This signal helps traders prepare for potential position adjustments or new counter-trend opportunities.
