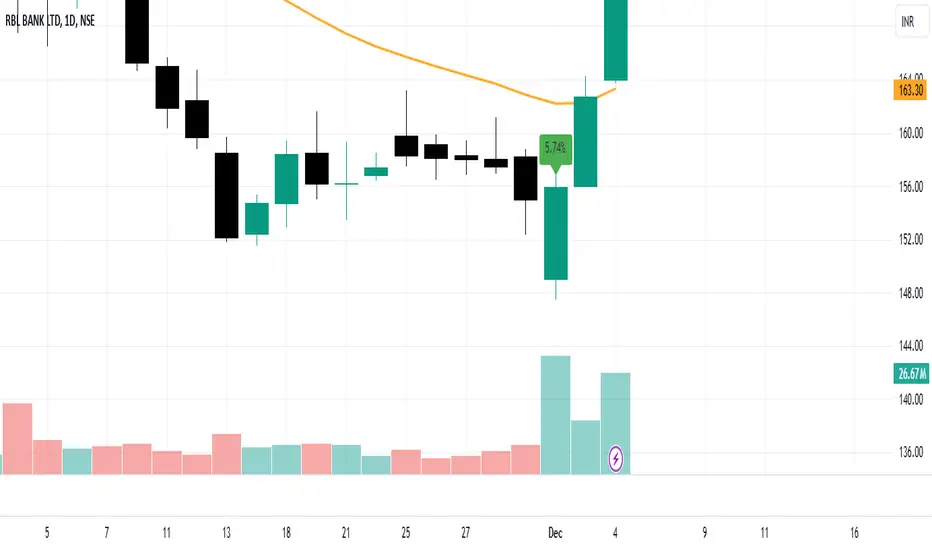
Customizable Days Range HighlighterThis Pine Script highlights ranges where consecutive green candles (bullish candles) form a price move within a specified percentage range.
It draws a visual box to represent this move, with the ability to customize both the percentage range and the number of consecutive green candles required to trigger the highlight.
The script calculates the range based on the low to close of the candles, allowing you to focus on the body of the candle (excluding wicks).
Key Features:
Customizable Percentage Range: Set a range (from and to) for the percentage price move between the lowest low and the close of the candle. This enables you to target specific price moves based on your trading strategy.
Consecutive Green Candle Range: Highlight moves only after a specific number of consecutive green candles. You can define the minimum and maximum number of green candles (days) that must be present for the range to be considered valid.
Wick Option: Choose whether to include wicks in the price move calculation or focus purely on the low to close of each green candle (body of the candle).
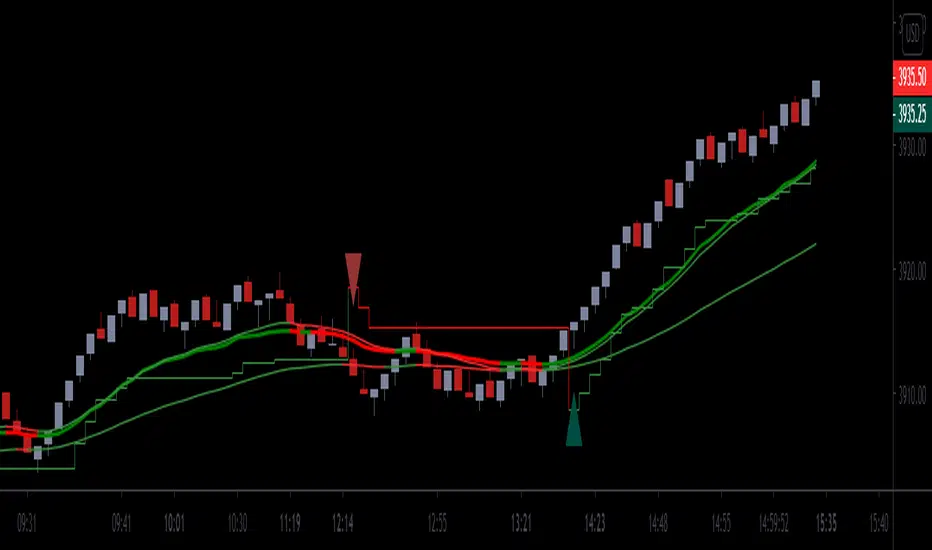
Visual Highlights: When a valid range is identified, the script draws a green box around the price move and labels it with the calculated percentage move. This helps you visually spot significant bullish price moves.
Parameters:
Percentage Move From: Minimum percentage move between the low and close of the candle for the range to be highlighted.
Percentage Move To: Maximum percentage move for the range to be considered valid.
Minimum and Maximum Green Candles: Set the minimum and maximum number of consecutive green candles (bullish candles) to trigger the range highlight.
Include Wicks: Choose whether to include the candle wicks in the percentage calculation or focus on the body (low to close).
How It Works:
The script tracks consecutive green candles and calculates the range from the low to close of each green candle.
When a valid range is found, where the price move falls within the defined percentage range and the consecutive green candles are within the specified days range, a box is drawn around the price move.
A label is also placed on the chart, showing the percentage move, to help you quickly identify potentially significant price movements.
This tool is ideal for traders who are looking for specific bullish moves over a series of green candles and want to visually identify those opportunities based on price movement and percentage change.
Penunjuk Pine Script®