Candlestick DataCandlestick Data Indicator
The Candlestick Data indicator provides a comprehensive overview of key metrics for analyzing price action and volume in real-time. This overlay indicator displays essential candlestick data and calculations directly on your chart, offering an all-in-one toolkit for traders seeking in-depth insights.
Key Features:
Price Metrics: View the daily high, low, close, and percentage change.
Volume Insights: Analyze volume, relative volume, and volume buzz for breakout or consolidation signals.
Range Analysis: Includes closing range, distance from low of day (LoD), and percentage change in daily range expansion.
Advanced Metrics: Calculate ADR% (Average Daily Range %), ATR (Average True Range), and % from 52-week high.
Moving Averages: Supports up to four customizable moving averages (EMA or SMA) with distance from price.
Market Context: Displays the sector and industry group for the asset.
This indicator is fully customizable, allowing you to toggle on or off specific metrics to suit your trading style. Designed for active traders, it brings critical data to your fingertips, streamlining decision-making and enhancing analysis.
Perfect for momentum, swing, and day traders looking to gain a data-driven edge!
Cari dalam skrip untuk "range"

True Range Trend StrengthThis script is designed to analyze trend strength using True Range calculations alongside Donchian Channels and smoothed moving averages. It provides a dynamic way to interpret market momentum, trend reversals, and anticipate potential entry points for trades.
Key Functionalities:
Trend Strength Oscillator:
Calculates trend strength based on the difference between long and short momentum derived from ATR (Average True Range) adjusted stop levels.
Smooths the trend strength using a simple moving average for better readability.
Donchian Channels on Trend Strength Oscillator:
Plots upper and lower Donchian Channels on the smoothed trend strength oscillator.
Traders can use these levels to anticipate breakout points and determine the strength of a trend.
Zero-Cross Shading:
Highlights bullish and bearish zones with shaded backgrounds:
Green for bullish zones where smoothed trend strength is above zero.
Red for bearish zones where smoothed trend strength is below zero.
Moving Averages for Oscillator:
Overlays fast and slow moving averages on the oscillator to provide crossover signals:
Fast MA Cross Above Slow MA: Indicates bullish momentum.
Fast MA Cross Below Slow MA: Indicates bearish momentum.
Alerts:
Alerts are available for MA crossovers, allowing traders to receive timely notifications about potential trend reversals or continuation signals.
Anticipating Entries with Donchian Channels:
The integration of Donchian Channels offers an edge in anticipating excellent trade entries.
Traders can use the oscillator's position relative to the channels to gauge oversold/overbought conditions or potential breakouts.
Use Case:
This script is particularly useful for traders looking to:
Identify the strength and direction of market trends.
Time entries and exits based on dynamic Donchian Channel levels and trend strength analysis.
Incorporate moving averages and visual cues for better decision-making.

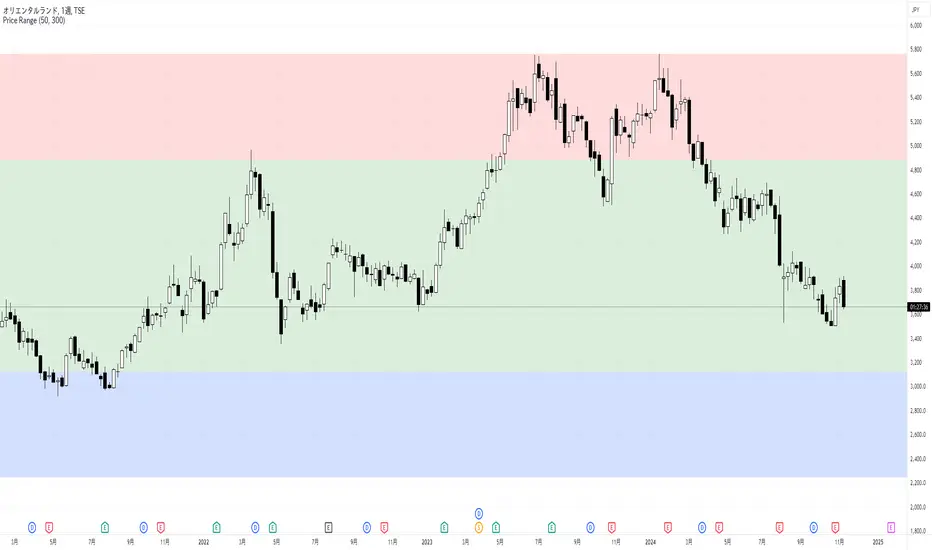
Price RangePrice Range
This indicator displays low, middle, and high price zones based on the lowest and highest prices over a specified period, using color-coding. This helps users visually identify the current price's position within these zones.
The effectiveness of chart patterns varies depending on where they appear within these price zones. For example, a double bottom pattern, which signals a potential market bottom, is a strong buy signal if it forms in the low zone, but it has less reliability if it forms in the middle or high zones.
Similarly, price action signals vary in significance based on their location. If a long upper wick pin bar appears in the high zone, it is often interpreted as a sign of reversal.
By combining this Price Range indicator with indicators that display chart patterns or price action signals, traders can make more informed trading decisions.
By default, the middle zone is set to cover 50% of the range, but this can be adjusted.
このインジケーターは、指定した期間の最安値と最高値をもとに、安値圏、中段圏、高値圏を色分けして表示します。これにより、ユーザーは現在の価格がどの位置にあるのかを視覚的に判断できます。
また、チャートパターンの効果は、出現する価格帯によって異なります。たとえば、ダブルボトムは相場の底を示すパターンで、安値圏で形成されると強い買いシグナルとなりますが、中段圏や高値圏で出現しても信頼性は低くなります。
プライスアクションも、どの価格帯に現れるかによって解釈が異なります。高値圏で上ヒゲの長いピンバーが現れると、反転の兆しとして判断されることが多いです。
このPrice Rangeインジケーターを、チャートパターンやプライスアクションを表示するインジケーターと組み合わせることで、より適切なトレード判断が可能になります。
デフォルトでは中段圏の割合が50%になるように設定されていますが、変更することが可能です。
PERFECT PIVOT RANGE DR ABIRAM SIVPRASAD (PPR)PERFECT PIVOT RANGE (PPR) by Dr. Abhiram Sivprasad
The Perfect Pivot Range (PPR) indicator is designed to provide traders with a comprehensive view of key support and resistance levels based on pivot points across different timeframes. This versatile tool allows users to visualize daily, weekly, and monthly pivots along with high and low levels from previous periods, helping traders identify potential areas of price reversals or breakouts.
Features:
Multi-Timeframe Pivots:
Daily, weekly, and monthly pivot levels (Pivot Point, Support 1 & 2, Resistance 1 & 2).
Helps traders understand price levels across various timeframes, from short-term (daily) to long-term (monthly).
Previous High-Low Levels:
Displays the previous week, month, and day high-low levels to highlight key zones of historical support and resistance.
Traders can easily see areas of price action from prior periods, giving context for future price movements.
Customizable Options:
Users can choose which pivot levels and high-lows to display, allowing for flexibility based on trading preferences.
Visual settings can be toggled on and off to suit different trading strategies and timeframes.
Real-Time Data:
All pivot points and levels are dynamically calculated based on real-time price data, ensuring accurate and up-to-date information for decision-making.
How to Use:
Pivot Points: Use daily, weekly, or monthly pivot points to find potential support or resistance levels. Prices above the pivot suggest bullish sentiment, while prices below indicate bearishness.
Previous High-Low: The high-low levels from previous days, weeks, or months can serve as critical zones where price may reverse or break through, indicating potential trade entries or exits.
Confluence: When pivot points or high-low levels overlap across multiple timeframes, they become even stronger levels of support or resistance.
This indicator is suitable for all types of traders (scalpers, swing traders, and long-term investors) looking to enhance their technical analysis and make more informed trading decisions.
Here are three detailed trading strategies for using the Perfect Pivot Range (PPR) indicator for options, stocks, and commodities:
1. Options Buying Strategy with PPR Indicator
Strategy: Buying Call and Put Options Based on Pivot Breakouts
Objective: To capitalize on sharp price movements when key pivot levels are breached, leading to high returns with limited risk in options trading.
Timeframe: 15-minute to 1-hour chart for intraday option trading.
Steps:
Identify the Key Levels:
Use weekly pivots for intraday trading, as they provide more significant levels for options.
Enable the "Previous Week High-Low" to gauge support and resistance from the previous week.
Call Option Setup (Bullish Breakout):
Condition: If the price breaks above the weekly pivot point (PP) with high momentum (indicated by a strong bullish candle), it signifies potential bullishness.
Action: Buy Call Options at the breakout of the weekly pivot.
Confirmation: Check if the price is sustaining above the pivot with a minimum of 1-2 candles (depending on timeframe) and the first resistance (R1) isn’t too far away.
Target: The first resistance (R1) or previous week’s high can be your target for exiting the trade.
Stop-Loss: Set a stop-loss just below the pivot point (PP) to limit risk.
Put Option Setup (Bearish Breakdown):
Condition: If the price breaks below the weekly pivot (PP) with strong bearish momentum, it’s a signal to expect a downward move.
Action: Buy Put Options on a breakdown below the weekly pivot.
Confirmation: Ensure that the price is closing below the pivot, and check for declining volumes or bearish candles.
Target: The first support (S1) or the previous week’s low.
Stop-Loss: Place the stop-loss just above the pivot point (PP).
Example:
Let’s say the weekly pivot point (PP) is at 1500, the price breaks above and sustains at 1510. You buy a Call Option with a strike price near 1500, and the target will be the first resistance (R1) at 1530.
2. Stock Trading Strategy with PPR Indicator
Strategy: Swing Trading Using Pivot Points and Previous High-Low Levels
Objective: To capture mid-term stock price movements using pivot points and historical high-low levels for better trade entries and exits.
Timeframe: 1-day or 4-hour chart for swing trading.
Steps:
Identify the Trend:
Start by determining the overall trend of the stock using the weekly pivots. If the price is consistently above the pivot point (PP), the trend is bullish; if below, the trend is bearish.
Buy Setup (Bullish Trend Reversal):
Condition: When the stock bounces off the weekly pivot point (PP) or previous week’s low, it signals a bullish reversal.
Action: Enter a long position near the pivot or previous week’s low.
Confirmation: Look for a bullish candle pattern or increasing volumes.
Target: Set your first target at the first resistance (R1) or the previous week’s high.
Stop-Loss: Place your stop-loss just below the previous week’s low or support (S1).
Sell Setup (Bearish Trend Reversal):
Condition: When the price hits the weekly resistance (R1) or previous week’s high and starts to reverse downwards, it’s an opportunity to short-sell the stock.
Action: Enter a short position near the resistance.
Confirmation: Watch for bearish candle patterns or decreasing volume at the resistance.
Target: Your first target would be the weekly pivot point (PP), with the second target as the previous week’s low.
Stop-Loss: Set a stop-loss just above the resistance (R1).
Use Previous High-Low Levels:
The previous week’s high and low are key levels where price reversals often occur, so use them as reference points for potential entry and exit.
Example:
Stock XYZ is trading at 200. The previous week’s low is 195, and it bounces off that level. You enter a long position with a target of 210 (previous week’s high) and place a stop-loss at 193.
3. Commodity Trading Strategy with PPR Indicator
Strategy: Trend Continuation and Reversal in Commodities
Objective: To capitalize on the strong trends in commodities by using pivot points as key support and resistance levels for trend continuation and reversal.
Timeframe: 1-hour to 4-hour charts for commodities like Gold, Crude Oil, Silver, etc.
Steps:
Identify the Trend:
Use monthly pivots for long-term commodities trading since commodities often follow macroeconomic trends.
The monthly pivot point (PP) will give an idea of the long-term trend direction.
Trend Continuation Setup (Bullish Commodity):
Condition: If the price is consistently trading above the monthly pivot and pulling back towards the pivot without breaking below it, it indicates a bullish continuation.
Action: Enter a long position when the price tests the monthly pivot (PP) and starts moving up again.
Confirmation: Look for a strong bullish candle or an increase in volume to confirm the continuation.
Target: The first resistance (R1) or previous month’s high.
Stop-Loss: Place the stop-loss below the monthly pivot (PP).
Trend Reversal Setup (Bearish Commodity):
Condition: When the price reverses from the monthly resistance (R1) or previous month’s high, it’s a signal for a bearish reversal.
Action: Enter a short position at the resistance level.
Confirmation: Watch for bearish candle patterns or decreasing volumes at the resistance.
Target: Set your first target as the monthly pivot (PP) or the first support (S1).
Stop-Loss: Stop-loss should be placed just above the resistance level.
Using Previous High-Low for Swing Trades:
The previous month’s high and low are important in commodities. They often act as barriers to price movement, so traders should look for breakouts or reversals near these levels.
Example:
Gold is trading at $1800, with a monthly pivot at $1780 and the previous month’s high at $1830. If the price pulls back to $1780 and starts moving up again, you enter a long trade with a target of $1830, placing your stop-loss below $1770.
Key Points Across All Strategies:
Multiple Timeframes: Always use a combination of timeframes for confirmation. For example, a daily chart may show a bullish setup, but the weekly pivot levels can provide a larger trend context.
Volume: Volume is key in confirming the strength of price movement. Always confirm breakouts or reversals with rising or declining volume.
Risk Management: Set tight stop-loss levels just below support or above resistance to minimize risk and lock in profits at pivot points.
Each of these strategies leverages the powerful pivot and high-low levels provided by the PPR indicator to give traders clear entry, exit, and risk management points across different markets

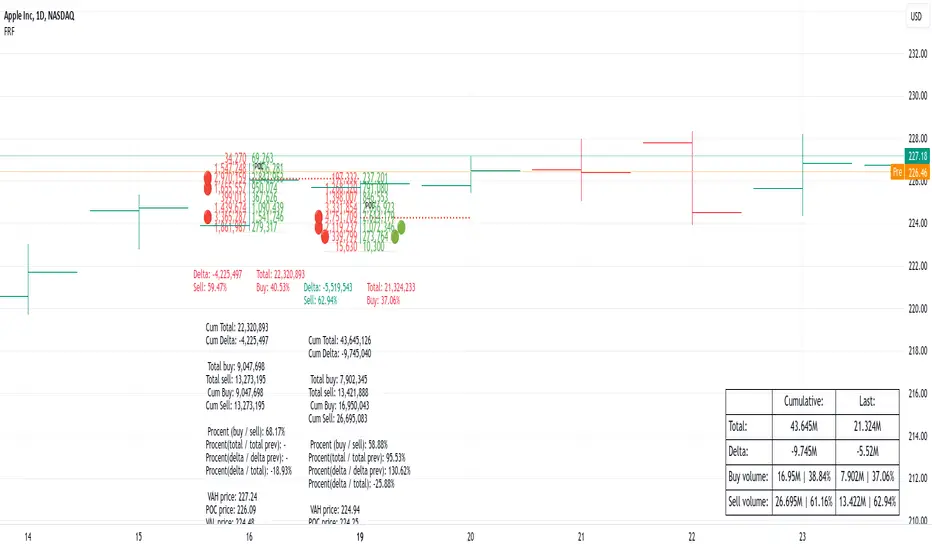
Fixed Range FootprintFixed Range Footprint allows you to analyze the Footprint over a specified time period. By enabling the "Extend Right" option, the Footprint transforms into a classic mode, extending from the starting point to the most recent bar in real-time.
Input Options:
Group: Coordinates
"Start range": Defines the starting coordinate for the Footprint period.
"End range": Defines the ending coordinate for the Footprint period.
Group: Row Size
"Ticks Per Row": Directly sets the price step, calculated by multiplying the input value by syminfo.mintick.
"Auto": Activates automatic mode for selecting the "Ticks Per Row" value.
"Max row": Relevant in auto mode; it limits the number of rows within a bar. The automatic calculation for "Ticks Per Row" is based on the first available bar and applied to subsequent bars.
Group: Imbalance
"Imbalance Percent": Sets a percentage-based coefficient to determine price level Imbalance by comparing the diagonal buy price to the previous sell price.
"Stacked levels": Defines the minimum number of consecutive Imbalance levels required to draw extended lines.
Group: Support
"Show Footprint Info": Toggles the display of Footprint information.
Group: Value Area
"Value Area": Sets the percentage for the Value Area.
"POC": Toggles the Point of Control (POC).
"VAH": Toggles the Value Area High (VAH).
"VAL": Toggles the Value Area Low (VAL).
"Show Volume Profile": Displays buy/sell volume at each level.
Group: Alerts
"Alert on New Imbalance": Enables alerts for the creation of new Imbalance levels.
"Alert on New Imbalance Line": Enables alerts for the creation of new Imbalance lines.
"Alert on Stop Past Imbalance Line": Enables alerts when price stops past an Imbalance line.
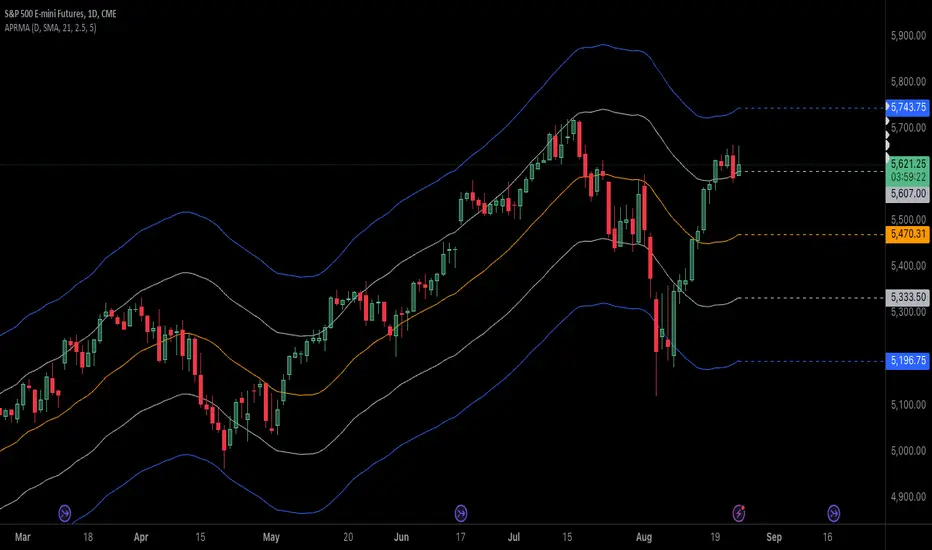
Adjustable Percentage Range Moving AverageAdjustable Percentage Range Moving Average (APRMA)
The Adjustable Percentage Range Moving Average (APRMA) is a technical analysis tool designed for traders and market analysts who seek a dynamic approach to understanding market volatility and trend identification. Unlike traditional moving averages, the APRMA incorporates user-adjustable percentage bands around a central moving average line, offering a customizable view of price action relative to its recent history.
Key Features:
Central Moving Average: At its core, APRMA calculates a moving average (type of your choice) of the price over a specified number of periods, serving as the baseline for the indicator.
Percentage Bands: Surrounding the moving average are four bands, two above and two below, set at user-defined percentages away from the central line. These bands expand and contract based on the percentage input, not on standard deviation like Bollinger Bands, which allows for a consistent visual interpretation of how far the price has moved from its average.
Customizability: Users can adjust:
The length of the moving average period to suit short-term, medium-term, or long-term analysis.
The percentage offset for the bands, enabling traders to set the sensitivity of the indicator according to the asset's volatility or their trading strategy.
Visual Interpretation:
When the price moves towards or beyond the upper band, it might indicate that the asset is potentially overbought or that a strong upward trend is in place.
Conversely, price action near or below the lower band could suggest an oversold condition or a strong downward trend.
The space between the bands can be used to gauge volatility; narrower bands suggest lower current volatility relative to the average, while wider bands indicate higher volatility.
Usage in Trading:
Trend Confirmation: A price staying above the moving average and pushing the upper band might confirm an uptrend, while staying below and testing the lower band could confirm a downtrend.
Reversion Strategies: Traders might look for price to revert to the mean (moving average) when it touches or crosses the bands, setting up potential entry or exit points.
Breakout Signals: A price moving decisively through a band after a period of consolidation within the bands might signal a breakout.
The APRMA provides a clear, adaptable framework for traders to visualize where the price stands in relation to its recent average, offering insights into potential overbought/oversold conditions, trend strength, and volatility, all tailored by the trader's strategic preferences.
Daily Bias Engine | PDH/PDL Range This program is designed to track the previous day range and interactions with the mean threshold on the following day.
The bias strategy is simple:
If you create new range highs over a PDH, you will lean towards calls.
If you create new range lows over a PDL, you will learn towards puts.
If neither event happens, no bias can be determined and therefore no trades taken.
If by 12:00pm there still is no bias determined, it will show moderate strength based on the trend.
Remember, use this strategy to outline your bias and find a cheap entry model to take advantage of.

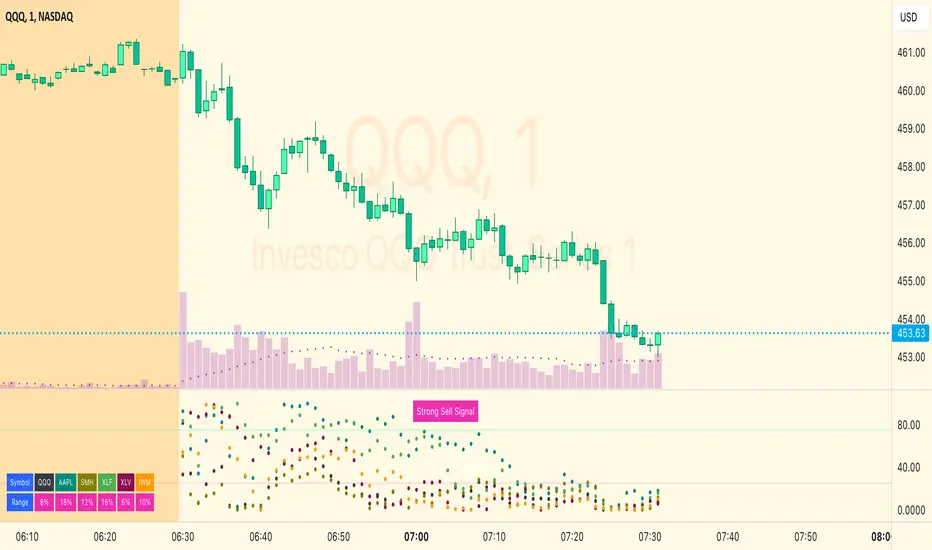
MM Market Range MapWhat this script does:
The purpose of this script is to help traders identify when the major sectors of the market are moving in one direction - also known as a "market trend day".
How this script works:
The indicator uses QQQ, SMH and NVDA to represent the technology side of the market, and XLF, XLV & IWM to represent everything else. It tracks where price is within the day's range for each of those symbols, and presents that data in a table and in also in a dot-based "map".
How to use this script:
Using the dot-based map, you can see if all symbols were ever at the highs or lows of their range together. You can use this information to decide which direction you should be trading (ie. with trend). For example, in order for there to be healthy bullish moves in the market, you would want this indicator to show you that all sectors are at the highs or trending in that direction.
What makes this script original:
Most indicators and even the TradingView watchlist measure the percent changed on the day from the closing price of a stock on the prior trading day, essentially telling you what sentiment is since yesterday. This script tells you the sentiment today since it is priced from the opening print. It also provides the map so you can see if they were ever at the highs or lows together throughout the day, which can be an early indicator that the market will trend.
S&P Short-Range Oscillator**SHOULD BE USED ON THE S&P 500 ONLY**
The S&P Short-Range Oscillator (SRO), inspired by the principles of Jim Cramer's oscillator, is a technical analysis tool designed to help traders identify potential buy and sell signals in the stock market, specifically for the S&P 500 index. The SRO combines several market indicators to provide a normalized measure of market sentiment, assisting traders in making informed decisions.
The SRO utilizes two simple moving averages (SMAs) of different lengths: a 5-day SMA and a 10-day SMA. It also incorporates the daily price change and market breadth (the net change of closing prices). The 5-day and 10-day SMAs are calculated based on the closing prices. The daily price change is determined by subtracting the opening price from the closing price. Market breadth is calculated as the difference between the current closing price and the previous closing price.
The raw value of the oscillator, referred to as SRO Raw, is the sum of the daily price change, the 5-day SMA, the 10-day SMA, and the market breadth. This raw value is then normalized using its mean and standard deviation over a 20-day period, ensuring that the oscillator is centered and maintains a consistent scale. Finally, the normalized value is scaled to fit within the range of -15 to 15.
When interpreting the SRO, a value below -5 indicates that the market is potentially oversold, suggesting it might be a good time to start buying stocks as the market could be poised for a rebound. Conversely, a value above 5 suggests that the market is potentially overbought. In this situation, it may be prudent to hold on to existing positions or consider selling if you have substantial gains.
The SRO is visually represented as a blue line on a chart, making it easy to track its movements. Red and green horizontal lines mark the overbought (5) and oversold (-5) levels, respectively. Additionally, the background color changes to light red when the oscillator is overbought and light green when it is oversold, providing a clear visual cue.
By incorporating the S&P Short-Range Oscillator into your trading strategy, you can gain valuable insights into market conditions and make more informed decisions about when to buy, sell, or hold your stocks. However, always consider other market factors and perform your own analysis before making any trading decisions.
The S&P Short-Range Oscillator is a powerful tool for traders looking to gain insights into market sentiment. It provides clear buy and sell signals through its combination of multiple indicators and normalization process. However, traders should be aware of its lagging nature and potential complexity, and use it in conjunction with other analysis methods for the best results.
Disclaimer
The S&P Short-Range Oscillator is for informational purposes only and should not be considered financial advice. Trading involves risk, and you should conduct your own research or consult a financial advisor before making investment decisions. The author is not responsible for any losses incurred from using this indicator. Use at your own risk.

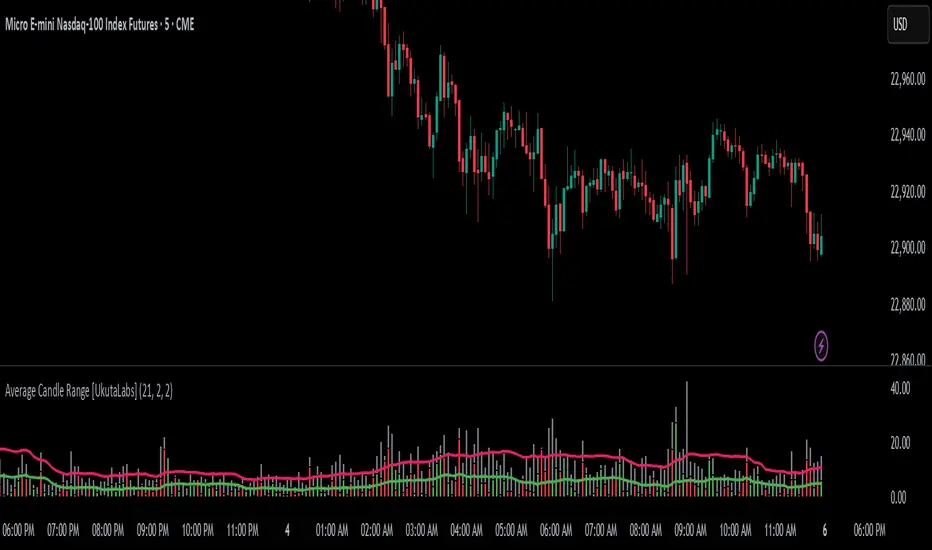
Average Candle Range [UkutaLabs]█ OVERVIEW
The Average Candle Range is a powerful indicator that compares the size of the current bar to past bars. This comparison can be used in a wide variety of trading strategies, allowing traders to understand at a glance the relative size of each candle.
█ USAGE
As each candlestick forms, two bars will be plotted on the indicator. The grey bar represents the total range of the candle from the high to the low, and the second bar represents the body of the bar from the open to the close. Depending on whether the bar is bullish or bearish, the second bar will be colored green or red respectively.
Two averages will also be drawn over these bars that represent the average size of the two bar types over a period that is specified by the user. These averages can be toggled in the indicator settings.
█ SETTINGS
Configuration
• Period: Determines how many bars to use in the calculation of the averages.
• Show Bar Average: Determines whether or not the average for the full bar size is displayed.
• Show Body Average: Determines whether or not the average for the body is displayed.
Fibonacci IntraDay Range [UkutaLabs]█ OVERVIEW
The Fibonacci IntraDay Range is a powerful trading tool that combines recent price action data with key Fibonacci ratios to identify strong levels of support and resistance.
The purpose of this script is to simplify the trading experience of users by identifying and labelling strong levels of support and resistance that they should be aware of.
█ USAGE
At the beginning of each trading day, the Fibonacci IntraDay Range indicator will calculate the average total range of the past 14 trading days. This average will be drawn on either side of the open, then several more levels will be drawn between them using Fibonacci ratios.
These levels can be treated as levels of support and resistance that can be incorporated into many different trading strategies.
Each line will also have an identifying label so traders will know at a glance what each line represents. These labels can be toggled in the settings.
█ SETTINGS
Configuration
• Show Labels: Determines whether or not labels will be drawn on each line.
• Display Mode: Determines the number of days to load.
• Font Size: Determines the font size of labels.
• Text Alignment: Determines the alignment of labels on their respective line.

Visible Range Support and Resistance [AlgoAlpha]🌟 Introducing the Visible Range Support and Resistance 🌟
Discover key support and resistance levels with the innovative "Visible Range Support and Resistance" indicator by AlgoAlpha! 🚀📈 This advanced tool dynamically identifies significant price zones based on the visible range of your chart, providing traders with crucial insights for making informed decisions.
Key Features:
Dynamic support and resistance levels based on visible chart range 📏
User-defined resolution for tailored analysis 🎯
Clear visual representation of significant key zones 🖼️
Easy integration with any trading strategy 💼
How to Use:
🛠 Add the Indicator : Add the indicator to favourites. Adjust settings like resolution and horizontal extension to suit your trading style.
📊 Market Analysis : Identify key support and resistance zones based on the highlighted areas. These zones indicate significant price levels where the market may react.
How it Works:
The indicator segments the price range into user-defined resolutions, analyzing the highest and lowest points to establish boundaries. It calculates the frequency of price action within these segments, highlighting key levels where price movements are least concentrated (areas where price tends to pivot). Customizable settings like resolution and horizontal extension allow for tailored analysis, while the intuitive visual representation makes it easy to spot potential support and resistance zones directly on your chart.
By leveraging this indicator, you can gain deeper insights into market dynamics and improve your trading strategy with data driven support and resistance analysis. Happy trading! 💹✨

Flush Percent RangeFans of Woodies CCI may recognize the approach to this one. This is my attempt at using the same methods but for taking the highs and lows into account without the standard deviation of the CCI. The smoothness of other oscillators may not be ideal however the Williams Percent Range is a fast stochastic that also operates within a channel. This provides an alternative yet still complex view for the virtuoso. A unique feature is total utilization of the weighted moving average, from the standard to the more complex. A fun fact is the Hull Moving Average is actually calculated using weighted moving averages.
How to use:
The base length is for accuracy, the fast length is for catching all the moves(even the wrong ones sometimes.)
The bars back option will not flip the histogram/base trend to its bullish/bearish alternative until the base plot remains on the latter half of the oscillator for a certain number of bars. This can be set to zero if desired.
The factor controls the chop on the various levels. A higher number will increase it.
The oscillator levels are measuring slope, price relative to the average, and a summation of percent changes between the two. Both the baseline/histogram and the levels have color coding for bullishness, bearishness, and indecision(depending on the factor.) The fast line matches the indecision color by default. This is all customizable.
There are many potential ways to trade with this indicator. From hooks back toward the trend and range line crossovers to divergence and reversals. It's important to note the current performance of the oscillator levels. Time cycles may come in handy along with other forecasting tools.
Lastly, there are optional linear regression lines plotted on the chart. They're synchronized to the lengths in the oscillator. This is an additional visual aid to provide context to the direction of the channel.
Overall the Flush Percent Range is for analyzing multiple regression models within a single price channel. No smoothing, fast averages, and specified timeframes of highs/lows. Credit to Larry Williams for the original calculation and Ken Woods for design/methodology inspiration.

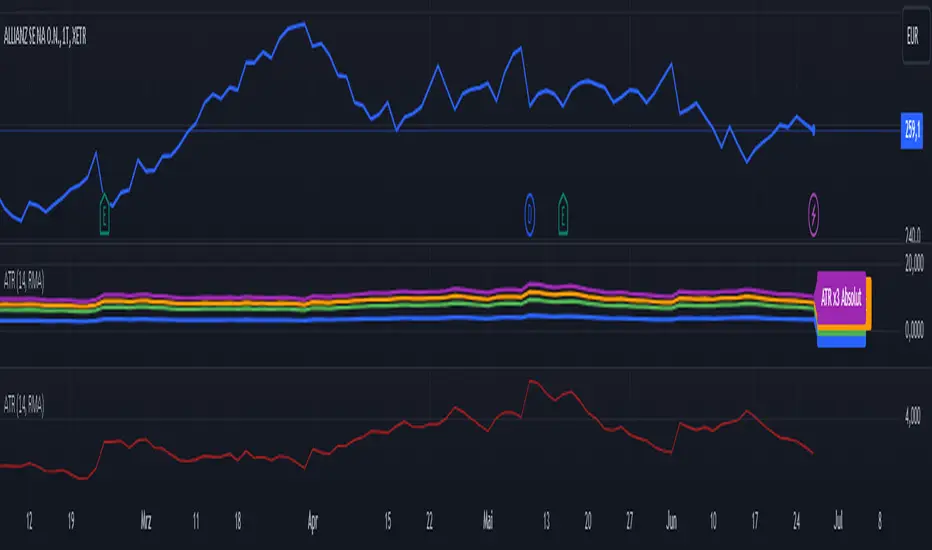
ATR (Average True Range) mit relative/absolute Zahlen GERMAN:
Schnelle Zusammenfassung:
Dieses Skript basiert auf dem ATR-Indikator und wurde so angepasst, dass sowohl relative (%) als auch absolute Zahlen angezeigt werden. Es bietet eine Darstellung des ATR in absoluten und prozentualen Werten sowie multipliziert mit den Faktoren x2, x2.5 und x3. Diese Darstellung erleichtert die Festlegung von Stop-Kursen, insbesondere für Trailing Stops und Trailing Abstände.
Periode:
Die Periode ist einstellbar und definiert die Länge der Berechnung des ATR (Standardwert: 14).
Glättung: Es stehen verschiedene Methoden zur Auswahl, um die Daten zu glätten (RMA, SMA, EMA, WMA).
Berechnungen:
ATR (Absolute Zahl): Berechnung der durchschnittlichen wahren Reichweite (ATR) unter Verwendung der ausgewählten Glättungsmethode und Periode.
ATR (Prozentualer Wert): Berechnung des ATR als Prozentsatz des aktuellen Schlusskurses.
Multiplikation des ATR: Berechnung des ATR multipliziert mit den Faktoren 2, 2.5 und 3 zur Einschätzung verschiedener Handelsszenarien.
Darstellung:
Absoluter ATR-Wert: Darstellung der absoluten ATR-Werte in Blau.
Relative ATR-Werte (%): Darstellung der prozentualen ATR-Werte, ohne Linie in der Grafik (transparent).
Multiplizierte ATR-Werte (x2, x2.5, x3): Darstellung der multiplizierten ATR-Werte in den Farben Grün (x2), Orange (x2.5) und Lila (x3).
Textbeschriftungen: Für jeden absoluten ATR-Wert und seine Multiplikationen werden Textbeschriftungen links im Chart angezeigt.
Verwendung des Indikators:
Dieser Indikator unterstützt Trader und Analysten dabei, die durchschnittliche wahre Reichweite (ATR) eines Finanzinstruments zu verstehen und zu visualisieren. Die verschiedenen Multiplikationen des ATR ermöglichen es, potenzielle Preisbewegungen zu analysieren und Handelsstrategien zu entwickeln, die auf der Volatilität basieren.
Hinweis:
Dies ist meine persönliche Meinung und Einstellung. Dieses Skript stellt keine Bankberatung oder Anlageempfehlung dar. Die Nutzung erfolgt auf eigenes Risiko und Verantwortung des Nutzers.
----------------------------------------------------------------------
ENGLISH:
Quick Summary:
This script is based on the ATR (Average True Range) indicator and has been modified to display both relative (%) and absolute values. It provides a representation of ATR in absolute and percentage terms, as well as multiplied by factors x2, x2.5, and x3. This visualization aids in setting stop-loss levels, especially for trailing stops and trailing distances.
Period:
The period is adjustable and defines the length of the ATR calculation (default: 14).
Smoothing: Various methods are available to smooth the data (RMA, SMA, EMA, WMA).
Calculations:
ATR (Absolute Value): Computes the Average True Range using the selected smoothing method and period.
ATR (Percentage Value): Calculates the ATR as a percentage of the current closing price.
Multiplication of ATR: Computes the ATR multiplied by factors 2, 2.5, and 3 to assess different trading scenarios.
Visualization:
Absolute ATR Value: Displays the absolute ATR values in blue.
Relative ATR Values (%): Shows the ATR values as percentages, without lines in the chart (transparent).
Multiplied ATR Values (x2, x2.5, x3): Presents the multiplied ATR values in green (x2), orange (x2.5), and purple (x3).
Text Labels: Text labels are shown on the left side of the chart for each absolute ATR value and its multiples.
Use of the Indicator:
This indicator helps traders and analysts understand and visualize the Average True Range (ATR) of a financial instrument. The different multipliers of ATR allow for the analysis of potential price movements and the development of trading strategies based on volatility.
Disclaimer:
This represents my personal opinion and viewpoint. This script does not constitute bank advice or investment recommendations. Use it at your own risk and responsibility.
Average Session Range [QuantVue]The Average Session Range or ASR is a tool designed to find the average range of a user defined session over a user defined lookback period.
Not only is this indicator is useful for understanding volatility and price movement tendencies within sessions, but it also plots dynamic support and resistance levels based on the ASR.
The average session range is calculated over a specific period (default 14 sessions) by averaging the range (high - low) for each session.
Knowing what the ASR is allows the user to determine if current price action is normal or abnormal.
When a new session begins, potential support and resistance levels are calculated by breaking the ASR into quartiles which are then added and subtracted from the sessions opening price.
The indicator also shows an ASR label so traders can know what the ASR is in terms of dollars.
Session Time Configuration:
The indicator allows users to define the session time, with default timing set from 13:00 to 22:00.
ASR Calculation:
The ASR is calculated over a specified period (default 14 sessions) by averaging the range (high - low) of each session.
Various levels based on the ASR are computed: 0.25 ASR, 0.5 ASR, 0.75 ASR, 1 ASR, 1.25 ASR, 1.5 ASR, 1.75 ASR, and 2 ASR.
Visual Representation:
The indicator plots lines on the chart representing different ASR levels.
Customize the visibility, color, width, and style (Solid, Dashed, Dotted) of these lines for better visualization.
Labels for these lines can also be displayed, with customizable positions and text properties.
Give this indicator a BOOST and COMMENT your thoughts!
We hope you enjoy.
Cheers!

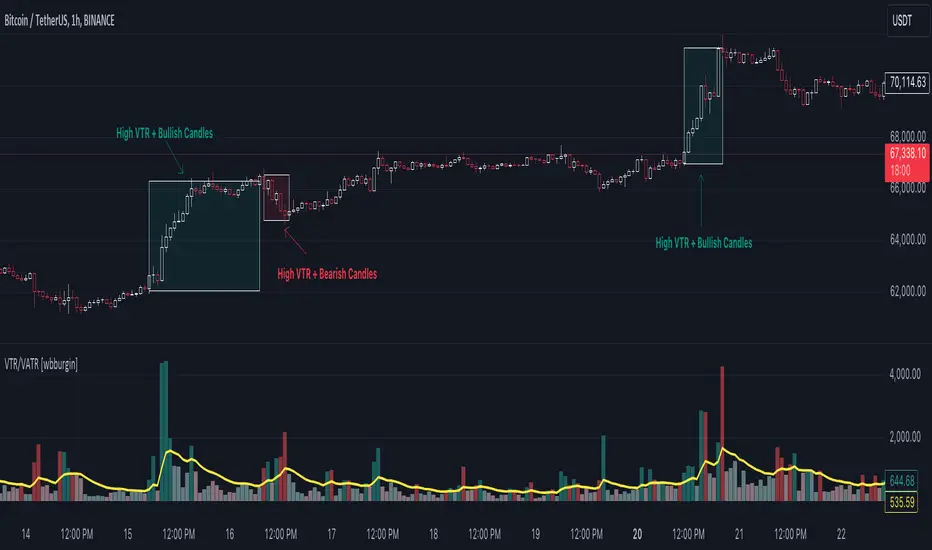
Volume True Range (VTR) and Volume Average True Range (VATR)This indicator uses lower-timeframe cumulative volume delta (CVD) candles to calculate the Volume True Range (VTR) of your instrument. The VTR is calculated similarly to the traditional true range, but uses volume instead (no price is involved in the calculation other than in the lower timeframe bar delta assignments). I haven't seen this concept developed before on TradingView or frankly the Internet, but I thought it seemed fairly intuitive; we can calculate the lower timeframe volume delta candles, so it makes sense to calculate a volume true range, which could show divergences in volume and price.
The VTR is calculated by the following code which uses the lower-timeframe CVD candles:
volumeTR = math.max(cvd_high - cvd_low, math.abs(cvd_high - nz(cvd_close )), math.abs(cvd_low - nz(cvd_close )))
The Volume Average True Range (VATR) is calculated by taking the RMA of the VTR, similarly to the ATR.
I would like to thank TradingView for the calculation of up/down intrabar volumes, which I referenced from their 'CVD - Cumulative Volume Delta Candles' indicator.
How to Use
The VTR and VATR can be used to identify price-volume trends and volatility divergences. A strong VTR (above the VATR of your specified length) can indicate the start or continuation of a trend, which you can identify via the VTR color (determined via price candle colors). Similarly, a rising VATR with most VTR bars of a specific color (green or red) will show that volume is moving in a specific price direction.
Additionally, the VATR plotted next to the ATR of the same length will show you volume volatility divergences. A strong VATR next to a muted/flat ATR indicates strong volume movement, which price might follow in the upcoming bars. Or, for trend reversals, a decreasing ATR after a strong trend combined with a rising VATR of the opposite trend may show a possible reversal.
Hope you all enjoy this.
-wbburgin
* Quick note: lower timeframe analysis returns only so much data. If you are on a high timeframe and the indicator is showing only a limited amount of bars, raise the lower timeframe (but still keep it below your current timeframe) so that the arrays can return more bars for you.
Fourier Adjusted Average True Range [BackQuant]Fourier Adjusted Average True Range
1. Conceptual Foundation and Innovation
The FA-ATR leverages the principles of Fourier analysis to dissect market prices into their constituent cyclical components. By applying Fourier Transform to the price data, the FA-ATR captures the dominant cycles and trends which are often obscured in noisy market data. This integration allows the FA-ATR to adapt its readings based on underlying market dynamics, offering a refined view of volatility that is sensitive to both market direction and momentum.
2. Technical Composition and Calculation
The core of the FA-ATR involves calculating the traditional ATR, which measures market volatility by decomposing the entire range of price movements. The FA-ATR extends this by incorporating a Fourier Transform of price data to assess cyclical patterns over a user-defined period 'N'. This process synthesizes both the magnitude of price changes and their rhythmic occurrences, resulting in a more comprehensive volatility indicator.
Fourier Transform Application: The Fourier series is calculated using price data to identify the fundamental frequency of market movements. This frequency helps in adjusting the ATR to reflect more accurately the current market conditions.
Dynamic Adjustment: The ATR is then adjusted by the magnitude of the dominant cycle from the Fourier analysis, enhancing or reducing the ATR value based on the intensity and phase of market cycles.
3. Features and User Inputs
Customizability: Traders can modify the Fourier period, ATR period, and the multiplication factor to suit different trading styles and market environments.
Visualization : The FA-ATR can be plotted directly on the chart, providing a visual representation of volatility. Additionally, the option to paint candles according to the trend direction enhances the usability and interpretative ease of the indicator.
Confluence with Moving Averages: Optionally, a moving average of the FA-ATR can be displayed, serving as a confluence factor for confirming trends or potential reversals.
4. Practical Applications
The FA-ATR is particularly useful in markets characterized by periodic fluctuations or those that exhibit strong cyclical trends. Traders can utilize this indicator to:
Adjust Stop-Loss Orders: More accurately set stop-loss orders based on a volatility measure that accounts for cyclical market changes.
Trend Confirmation: Use the FA-ATR to confirm trend strength and sustainability, helping to avoid false signals often encountered in volatile markets.
Strategic Entry and Exit: The indicator's responsiveness to changing market dynamics makes it an excellent tool for planning entries and exits in a trend-following or a breakout trading strategy.
5. Advantages and Strategic Value
By integrating Fourier analysis, the FA-ATR provides a volatility measure that is both adaptive and anticipatory, giving traders a forward-looking tool that adjusts to changes before they become apparent through traditional indicators. This anticipatory feature makes it an invaluable asset for traders looking to gain an edge in fast-paced and rapidly changing market conditions.
6. Summary and Usage Tips
The Fourier Adjusted Average True Range is a cutting-edge development in technical analysis, offering traders an enhanced tool for assessing market volatility with increased accuracy and responsiveness. Its ability to adapt to the market's cyclical nature makes it particularly useful for those trading in highly volatile or cyclically influenced markets.
Traders are encouraged to integrate the FA-ATR into their trading systems as a supplementary tool to improve risk management and decision-making accuracy, thereby potentially increasing the effectiveness of their trading strategies.
INDEX:BTCUSD
INDEX:ETHUSD
BINANCE:SOLUSD

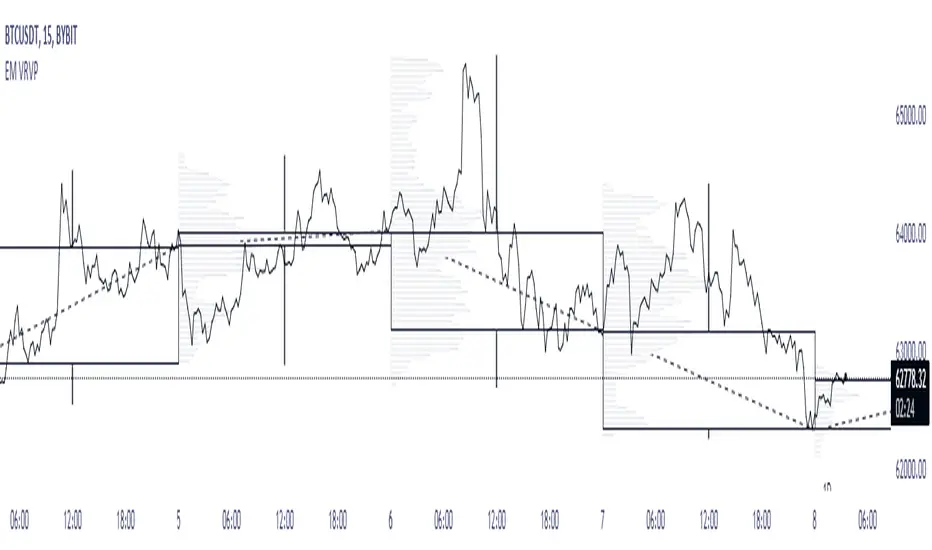
EM Visible Range Volume Profile█ OVERVIEW
ᴇᴍ VRVP (Visible Range Volume Profile) indicator calculates the volume profile within the visible range of prices.
Volume Profile is an advanced technical analysis indicator that shows trading activity over a specified period of time at certain price levels.
The indicator plots a histogram on the chart that reflects dominant or significant price levels based that are based on volume.
VP concept
VP Components
Open, High, Low, Close:
There are different types of volume profile indicators but the majority of them will designate the OHLC.
Point of Control:
A price level with the most traded volume during one session, also known as POC.
High Volume Node (HVN):
Area of high volume relative to surrounding price action.
Low Volume Node (LVN):
Area of low volume relative to surrounding price action.
Analysis of price in relation to high and low volume nodes is useful when building context around your trades.
█ VOLUME PROFILE STRATEGIES
The distribution of a volume profile can help you determine the strength of a trend and spot potential reversal zones. Let’s take a look at the five different distribution types.
Neutral D
In order for price to break away from value, either the buyers or the sellers will have to become more aggressive than the other side. When this occurs, it gives us with a vital piece of information.
Now we know who were the agressors at this price level: either the buyers or the sellers. That's why this is a good level for a trading setup if the price bounces back.
Bearish P and Bullish P
Bearish P — reversal. Bullish P — confirmation.
Bearish Ь and Bullish Ь
Bearish Ь — confirmation. Bullish Ь — reversal.
Examples
█ INPUTS
Width — amplitude of the VP histogram.
Grid — the number of columns of the VP histogram.
Delta of volumes — combinatorial determination of the ratios of sellers and buyers.
In quoted units — conversion in units of quoted currency.
Logarithmic scale — recalculation the grid step to the logarithmic scale of the chart.
HTF — (Higher Timeframe) calculation of VP for the period of the selected timeframe. ISO: Isolated computation in HTF period.
Palette: Total volume, Volume of buyers, Volume of sellers, HTF bars.
Warnings: colour of the «⚠» icon, language of information in the Tooltip.
Addition: ᴇᴍ CHN-RMA — a grid of moving averages with periods of centered hexagonal numbers.
█ ОБЩИЕ СВЕДЕНИЯ
ᴇᴍ VRVP (Visible Range Volume Profile) рассчитывает профиль объёма в видимом диапазоне цен.
Профиль объёма — это продвинутый индикатор технического анализа, который показывает торговую активность за условленный период времени на определённых ценовых уровнях.
Индикатор строит на графике гистограмму, отражающую доминирующие или значимые ценовые уровни, основанные на объёме.
█ НАСТРОЙКИ
Ширина — амплитуда гистограммы VP.
Сетка — количество колонок гистограммы VP.
Дельта объёмов — комбинаторное определение соотношений продаж и покупок.
В котируемых единицах — пересчёт в единицах котируемой валюты.
Логарифмическая шкала — пересчёт шага сетки на логарифмическую шкалу графика.
HTF — (Higher Timeframe) расчёт VP за период выбранного таймфрейма. ISO: Изолированное вычисление в HTF-периоде.
Палитра: Суммарный объём, Объём покупок, Объём продаж, Бары HTF.
Предупреждения: цвет значка «⚠», язык информации в Tooltip.
Дополнение: ᴇᴍ CHN-RMA — сетка скользящих средних с периодами центрированных гексагональных чисел.
time_and_sessionA library that provides utilities for working with trading sessions and time-based conditions. Functions include session checks, date range checks, day-of-week matching, and session high/low calculations for daily, weekly, monthly, and yearly timeframes. This library streamlines time-related calculations and enhances time-based strategies and indicators.
Library "time_and_session"
Provides functions for checking time and session-based conditions and retrieving session-specific high and low values.
is_session(session, timeframe, timezone)
Checks if the current time is within the specified trading session
Parameters:
session (string) : The trading session, defined using input.session()
timeframe (string) : The timeframe to use, defaults to the current chart's timeframe
timezone (string) : The timezone to use, defaults to the symbol's timezone
Returns: A boolean indicating whether the current time is within the specified trading session
is_date_range(start_time, end_time)
Checks if the current time is within a specified date range
Parameters:
start_time (int) : The start time, defined using input.time()
end_time (int) : The end time, defined using input.time()
Returns: A boolean indicating whether the current time is within the specified date range
is_day_of_week(sunday, monday, tuesday, wednesday, thursday, friday, saturday)
Checks if the current day of the week matches any of the specified days
Parameters:
sunday (bool) : A boolean indicating whether to check for Sunday
monday (bool) : A boolean indicating whether to check for Monday
tuesday (bool) : A boolean indicating whether to check for Tuesday
wednesday (bool) : A boolean indicating whether to check for Wednesday
thursday (bool) : A boolean indicating whether to check for Thursday
friday (bool) : A boolean indicating whether to check for Friday
saturday (bool) : A boolean indicating whether to check for Saturday
Returns: A boolean indicating whether the current day of the week matches any of the specified days
daily_high(source)
Returns the highest value of the specified source during the current daily session
Parameters:
source (float) : The data series to evaluate, defaults to high
Returns: The highest value during the current daily session, or na if the timeframe is not suitable
daily_low(source)
Returns the lowest value of the specified source during the current daily session
Parameters:
source (float) : The data series to evaluate, defaults to low
Returns: The lowest value during the current daily session, or na if the timeframe is not suitable
regular_session_high(source, persist)
Returns the highest value of the specified source during the current regular trading session
Parameters:
source (float) : The data series to evaluate, defaults to high
persist (bool) : A boolean indicating whether to retain the last value outside of regular market hours, defaults to true
Returns: The highest value during the current regular trading session, or na if the timeframe is not suitable
regular_session_low(source, persist)
Returns the lowest value of the specified source during the current regular trading session
Parameters:
source (float) : The data series to evaluate, defaults to low
persist (bool) : A boolean indicating whether to retain the last value outside of regular market hours, defaults to true
Returns: The lowest value during the current regular trading session, or na if the timeframe is not suitable
premarket_session_high(source, persist)
Returns the highest value of the specified source during the current premarket trading session
Parameters:
source (float) : The data series to evaluate, defaults to high
persist (bool) : A boolean indicating whether to retain the last value outside of premarket hours, defaults to true
Returns: The highest value during the current premarket trading session, or na if the timeframe is not suitable
premarket_session_low(source, persist)
Returns the lowest value of the specified source during the current premarket trading session
Parameters:
source (float) : The data series to evaluate, defaults to low
persist (bool) : A boolean indicating whether to retain the last value outside of premarket hours, defaults to true
Returns: The lowest value during the current premarket trading session, or na if the timeframe is not suitable
postmarket_session_high(source, persist)
Returns the highest value of the specified source during the current postmarket trading session
Parameters:
source (float) : The data series to evaluate, defaults to high
persist (bool) : A boolean indicating whether to retain the last value outside of postmarket hours, defaults to true
Returns: The highest value during the current postmarket trading session, or na if the timeframe is not suitable
postmarket_session_low(source, persist)
Returns the lowest value of the specified source during the current postmarket trading session
Parameters:
source (float) : The data series to evaluate, defaults to low
persist (bool) : A boolean indicating whether to retain the last value outside of postmarket hours, defaults to true
Returns: The lowest value during the current postmarket trading session, or na if the timeframe is not suitable
weekly_high(source)
Returns the highest value of the specified source during the current weekly session. Can fail on lower timeframes.
Parameters:
source (float) : The data series to evaluate, defaults to high
Returns: The highest value during the current weekly session, or na if the timeframe is not suitable
weekly_low(source)
Returns the lowest value of the specified source during the current weekly session. Can fail on lower timeframes.
Parameters:
source (float) : The data series to evaluate, defaults to low
Returns: The lowest value during the current weekly session, or na if the timeframe is not suitable
monthly_high(source)
Returns the highest value of the specified source during the current monthly session. Can fail on lower timeframes.
Parameters:
source (float) : The data series to evaluate, defaults to high
Returns: The highest value during the current monthly session, or na if the timeframe is not suitable
monthly_low(source)
Returns the lowest value of the specified source during the current monthly session. Can fail on lower timeframes.
Parameters:
source (float) : The data series to evaluate, defaults to low
Returns: The lowest value during the current monthly session, or na if the timeframe is not suitable
yearly_high(source)
Returns the highest value of the specified source during the current yearly session. Can fail on lower timeframes.
Parameters:
source (float) : The data series to evaluate, defaults to high
Returns: The highest value during the current yearly session, or na if the timeframe is not suitable
yearly_low(source)
Returns the lowest value of the specified source during the current yearly session. Can fail on lower timeframes.
Parameters:
source (float) : The data series to evaluate, defaults to low
Returns: The lowest value during the current yearly session, or na if the timeframe is not suitable
Deck@r True Range IndexThis Pine Script calculates the True Range Index (TRI) using ATR and Fib Levels and uses the result to generate buy and sell signals based on certain conditions.
Here's a breakdown of the code:
Inputs:
atr_period: Determines the period for calculating the Average True Range (ATR), preferred setting at 14.
atr_multiplier: Multiplier used to set the width of the ATR bands preferred setting at 1.
Calculations:
atr_value: Calculates the Average True Range (ATR) using the input period.
upper_band: Calculates the upper band of the ATR bands using a Simple Moving Average (SMA) of the close price plus the ATR multiplied by the multiplier.
lower_band: Calculates the lower band of the ATR bands using a Simple Moving Average (SMA) of the close price minus the ATR multiplied by the multiplier.
midline_75 and midline_25: Calculate midlines at Fibonacci retracement levels of 0.75 and 0.25, respectively, between the upper and lower bands.
Plotting:
Plots the upper and lower bands of the ATR bands.
Optionally plots midlines for the ATR bands (commented out in the code).
Buy and Sell Conditions:
buy_condition: Defines a condition for a buy signal, which occurs when the close price is above the midline at the Fibonacci retracement level of 0.25.
sell_condition: Defines a condition for a sell signal, which occurs when the close price is below the midline at the Fibonacci retracement level of 0.75.
Candle Color:
Sets the candle color based on the buy and sell conditions.
Buy and Sell Signals:
buy_signal: Checks for a buy signal when the close price crosses above the midline at the Fibonacci retracement level of 0.25.
sell_signal: Checks for a sell signal when the close price crosses below the midline at the Fibonacci retracement level of 0.75.
Plots buy and sell signals on the chart.

DEMA Adjusted Average True Range [BackQuant]The use of the Double Exponential Moving Average (DEMA) within your Adjusted Average True Range (ATR) calculation serves as a cornerstone for enhancing the indicator's responsiveness to market changes. To delve deeper into why DEMA is employed specifically in the context of your ATR calculation, let's explore the inherent qualities of DEMA and its impact on the ATR's performance.
DEMA and Its Advantages
As previously mentioned, DEMA was designed to offer a more responsive alternative to the traditional Exponential Moving Average (EMA). By giving more weight to recent price data, DEMA reduces the lag typically associated with moving averages. This reduction in lag is especially beneficial for short-term traders looking to capitalize on trend reversals and other market movements as swiftly as possible.
The calculation of DEMA involves the following steps:
Calculate EMA1: This is the Exponential Moving Average of the price.
Calculate EMA2: This is the Exponential Moving Average of EMA1, thus it is a smoothing of a smoothing, leading to a greater lag.
Formulate DEMA: The formula
EMA1 = EMA of price
EMA2 = EMA of EMA1
DEMA = (2 x EMA1) - EMA2
effectively doubles the weighting of the most recent data points by subtracting the lagged, double-smoothed EMA2 from twice the single-smoothed EMA1.
This process enhances the moving average's sensitivity to recent price movements, allowing the DEMA to adhere more closely to the price bars than either EMA1 or EMA2 alone.
Integration with ATR
In the context of your ATR calculation, the integration of DEMA plays a crucial role in defining the indicator's core functionality. Here's a detailed explanation of how DEMA affects the ATR calculation:
Initial Determination of DEMA : By applying the DEMA formula to the chosen source data (which can be adjusted to use Heikin Ashi candle close prices for an even smoother analysis), you set a foundation for a more reactive trend-following mechanism within the ATR framework.
Application to ATR Bands : The calculated DEMA serves as the central line from which the ATR bands are derived. The ATR value, multiplied by a user-defined factor, is added to and subtracted from the DEMA to form the upper and lower bands, respectively. This dynamic adjustment not only reflects the volatility based on the ATR but does so in a way that is closely aligned with the most recent price action, thanks to the utilization of DEMA.
Enhanced Signal Quality : The responsiveness of DEMA ensures that the ATR bands adjust more promptly to changes in market conditions. This quality is vital for traders who rely on the ATR bands to identify potential entry and exit points, trend reversals, or to assess market volatility.
By employing DEMA as the core component in calculating the Adjusted Average True Range, your indicator leverages DEMA's reduced lag and increased weight on recent data to provide a more timely and accurate measure of market volatility. This innovative approach enhances the utility of the ATR by making it not only a tool for assessing volatility but also a more reactive indicator for trend analysis and trading signal generation.
The main concept of combining these is to reduce lag, get a more robust signal and still capture clear trends over medium time horizons.
For me, this is best used in confluence with other indicators, it can be made faster in order to get fasters response time, or slower. This is all depending on the needs of you as a trader.
User Inputs:
The script offers several user-configurable inputs, such as the period lengths for DEMA and ATR calculations, the multiplication factor for the ATR, and options to use Heikin Ashi candles or standard price data. Additionally, it allows for the toggling of visual features, like the plotting of the DEMA ATR and its moving average, and the application of color-coded trends on price bars.
Additional Features:
Moving Average Confluence: Traders can opt to display a moving average of the DEMA ATR, choosing from various types (e.g., SMA, EMA, HMA). This feature provides a layer of confluence, aiding in the identification of trend direction and strength.
Trend Identification :
The script employs logical conditions to ascertain the trend direction based on the movement of the DEMA ATR. It assigns colors to represent bullish or bearish trends, which are reflected in the plotted lines and the coloring of price bars.
Alerts :
Customizable alert conditions for trend reversals enhance the utility of the indicator for active trading, notifying users of significant changes in trend direction.
1D Backtests
We include these backtests as a general proxy for how they work.
Please do your own calibrating to suit it to your own needs and backtest.
Past results don't = future results but they can help you understand how it functions.
INDEX:BTCUSD
INDEX:ETHUSD
BINANCE:SOLUSD

Candle Range ExtensionThis script defines an indicator called "Candle Range Extension" that calculates the range of each candle (high minus low) and then multiplies that range by 3 to get the extension distance. It then plots two lines on the chart: one line that extends 3 times the candle range above the candle's high (in green) and another line that extends 3 times the candle range below the candle's low (in red).

Time Candle Range HistoryThe 'Intraday Candle Range Average' indicator is designed to provide traders with insights into the average price range of intraday candles, specifically focusing on the period around 9:30 AM. By calculating the difference between the high and low of candles occurring at 9:30 AM, the indicator offers a dynamic view of market volatility during this critical time window. Users can customize parameters such as the number of days to consider for the average calculation, allowing for flexibility in analyzing short-term price movements. Additionally, the indicator offers a clear visualization of the current candle range compared to the historical average, aiding traders in identifying potential trading opportunities based on volatility patterns. Whether used independently or in conjunction with other technical analysis tools, the 'Intraday Candle Range Average' indicator empowers traders with valuable insights into intraday market dynamics.
