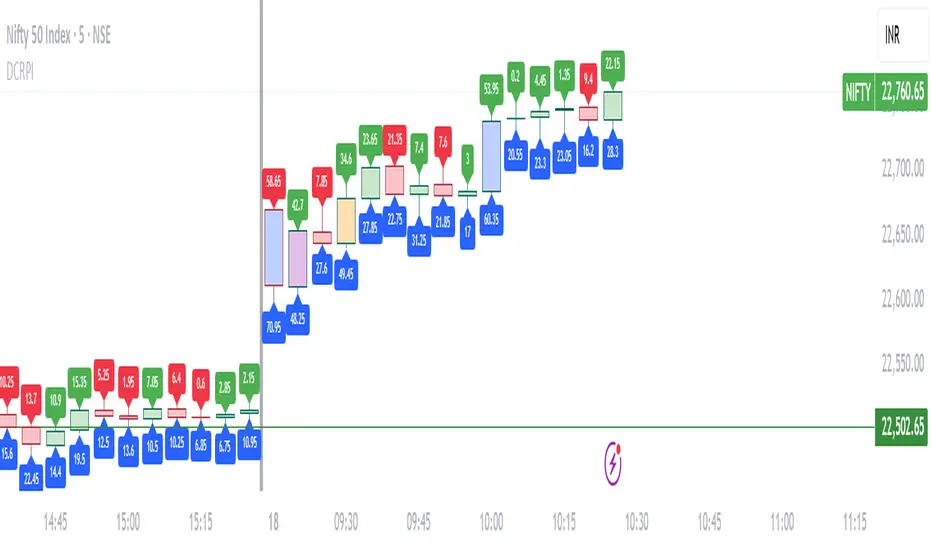
Technical Dashboard with High and Low Price Prediction Hello everyone!
I am releasing this indicator. It is called the Technical Dashboard and the name is pretty self explanatory! So let's get into it:
What it does:
The technical dashboard displays 4 commonly used technical indicators: Stochastics, RSI, Z-Score and MFI. It will display the current value of each of these technical indicators, as well as the highest and lowest value over a user defined period and the SMA.
The user can input the source and lookback period for each of the indicators individually. It is defaulted to 14, but I do recommend using a larger lookback time period as 14 tends to be a little too narrow.
The indicator will display a notice of whether the stock is trading in a max range, min range or neutral range based on its previous highest and lowest range. If the stock is trading between the highest and lowest range, it will display a neutral range reading.
In addition to displaying those 4 commonly used technical indicators, the indicator will also display the highest and lowest highs and lows of a ticker over a user defined period. You can opt for it to plot out the High and Low SMA and select your timeframe for these SMA plots.
The current value for the High and Low actually depicts a predicted High and Low based on the user defined lookback period. The Current Range column will show you when and if the predicted high or low is reached. The high and low defaults to the timeframe you are on. So if you are trading off the 5 minute chart, it will display the predicted high and low on the 5 minute time frame. The 1 hour, it will show the 1 hour, etc. It provides price prediction using a simple regression based analysis that pinescript provides.
Examples of its use:
In the image above, you can see how the indicator shows you when the stock is trading in some of its max ranges.
Note that just because a stock is trading in its max or min range does not necessarily mean that the stock is going to reverse in the opposite direction. While highest and lowest represent previous areas of reversal, it doesn't always mean that it will result in a reversal again. What it tells us more is whether momentum has picked up one way or the other, be it bearish or bullish momentum. This is useful information to help us decide whether a ticker has good momentum and whether a move is likely to have follow through. However, a stock trading in its high or low range can indeed signal a reversal. It is important to pay attention to the underlying price action and plan your trades accordingly.
Customizations
All of the indicators are individually customizable, from lookback length, SMA length and input source for RSI, Z-Score and MFI.
In addition to the lookback periods, you can also view highest and lowest ranges based on the SMA length. If you select "Show reversals based on SMA", the indicator will display the highest and lowest values of the SMA instead of the stock itself.
Gauging Strength:
You can use this indicator to gauge strength in many ways. First of all, your ability to see where a stock is trading relative to its historically high and low technical ranges helps you determine the overall momentum of the stock. However, you can have the indicator plot the predicted high and low ranges (see image below):
The green arrows are pointing to areas where the stock is breaking past its high levels. This shows that the over-arching sentiment is bullish. However, we can see when it starts to lose steam, it stops touching the high values and starts to touch and break below the low values (red arrows). This signals to us that the stock is losing the bullish momentum and we should be alert for a reversal to the downside or upside, depending on the setup.
There are many applications you can use it for and there is a lot of customizability. Play around with it and let me know what you think, how it helps you and any suggestions for its improvement.
As always, I have prepared a quick video tutorial on getting started with the setups on the indicator which is linked below:
Thank you all for checking this out and safe trades everyone!
Cari dalam skrip untuk "range"
DR/IDR of Omega by TRSTNThis is an EXPERIMENTAL Script by @TRSTNGLRD derived from the coding of @IAmMas7er's "DR/IDR" Indicator that adds a total of 11 additional DR / IDR Ranges on both lower and higher timeframes.
This script is no-longer being worked on, so I have made it public.
Background:
This Script utilizes the Fibonacci-Doubling Sequence between the range of 18:30pm and 16:55pm NY-Time. Each Cycle is grouped into the following:
Omega/2, Omega/4, Omega/8, and Omega/16
The Mas7er's three original sessions are: Omega/4v1, Omega/4v2, and Omega/8v1
These three Sessions above take rule over all others. If you are looking to back-test this version of the script, please use the Experimental ranges as confirmation for the three above.
Important Notes:
- Please only select Sessions with their respected groups (All of Omega/4, All of Omega/16, etc...) rather than selecting all of them at once.
If you select all of them at once, the ranges will not be correct and cut each other off.
The only exceptions to this rule are the Mas7er's original ranges above.
- If you wish to have multiple groups of Ranges together, please add a second indicator to your chart.
- Omega/16v1 and Omega/16v6 are known to have a high-probability of a Judas Swing (takes out both sides of the range) - Be Cautious!
- Omega/2v1 is a very large DR / IDR range. I am working on shrinking it in size, but have more experimenting to do with different ranges.
- I do not use the experimental ranges with the IDR , only the DR . I have not been able to define probabilities fully yet, but the levels are respected nonetheless.
This script is not supposed to work EXACTLY like the Mas7er's, rather, generally instead.
Please comment and leave your opinion below about which ranges work the best and how you may utilize them.
Thank you!
ValueAtTime█ OVERVIEW
This library is a Pine Script® programming tool for accessing historical values in a time series using UNIX timestamps . Its data structure and functions index values by time, allowing scripts to retrieve past values based on absolute timestamps or relative time offsets instead of relying on bar index offsets.
█ CONCEPTS
UNIX timestamps
In Pine Script®, a UNIX timestamp is an integer representing the number of milliseconds elapsed since January 1, 1970, at 00:00:00 UTC (the UNIX Epoch ). The timestamp is a unique, absolute representation of a specific point in time. Unlike a calendar date and time, a UNIX timestamp's meaning does not change relative to any time zone .
This library's functions process series values and corresponding UNIX timestamps in pairs , offering a simplified way to identify values that occur at or near distinct points in time instead of on specific bars.
Storing and retrieving time-value pairs
This library's `Data` type defines the structure for collecting time and value information in pairs. Objects of the `Data` type contain the following two fields:
• `times` – An array of "int" UNIX timestamps for each recorded value.
• `values` – An array of "float" values for each saved timestamp.
Each index in both arrays refers to a specific time-value pair. For instance, the `times` and `values` elements at index 0 represent the first saved timestamp and corresponding value. The library functions that maintain `Data` objects queue up to one time-value pair per bar into the object's arrays, where the saved timestamp represents the bar's opening time .
Because the `times` array contains a distinct UNIX timestamp for each item in the `values` array, it serves as a custom mapping for retrieving saved values. All the library functions that return information from a `Data` object use this simple two-step process to identify a value based on time:
1. Perform a binary search on the `times` array to find the earliest saved timestamp closest to the specified time or offset and get the element's index.
2. Access the element from the `values` array at the retrieved index, returning the stored value corresponding to the found timestamp.
Value search methods
There are several techniques programmers can use to identify historical values from corresponding timestamps. This library's functions include three different search methods to locate and retrieve values based on absolute times or relative time offsets:
Timestamp search
Find the value with the earliest saved timestamp closest to a specified timestamp.
Millisecond offset search
Find the value with the earliest saved timestamp closest to a specified number of milliseconds behind the current bar's opening time. This search method provides a time-based alternative to retrieving historical values at specific bar offsets.
Period offset search
Locate the value with the earliest saved timestamp closest to a defined period offset behind the current bar's opening time. The function calculates the span of the offset based on a period string . The "string" must contain one of the following unit tokens:
• "D" for days
• "W" for weeks
• "M" for months
• "Y" for years
• "YTD" for year-to-date, meaning the time elapsed since the beginning of the bar's opening year in the exchange time zone.
The period string can include a multiplier prefix for all supported units except "YTD" (e.g., "2W" for two weeks).
Note that the precise span covered by the "M", "Y", and "YTD" units varies across time. The "1M" period can cover 28, 29, 30, or 31 days, depending on the bar's opening month and year in the exchange time zone. The "1Y" period covers 365 or 366 days, depending on leap years. The "YTD" period's span changes with each new bar, because it always measures the time from the start of the current bar's opening year.
█ CALCULATIONS AND USE
This library's functions offer a flexible, structured approach to retrieving historical values at or near specific timestamps, millisecond offsets, or period offsets for different analytical needs.
See below for explanations of the exported functions and how to use them.
Retrieving single values
The library includes three functions that retrieve a single stored value using timestamp, millisecond offset, or period offset search methods:
• `valueAtTime()` – Locates the saved value with the earliest timestamp closest to a specified timestamp.
• `valueAtTimeOffset()` – Finds the saved value with the earliest timestamp closest to the specified number of milliseconds behind the current bar's opening time.
• `valueAtPeriodOffset()` – Finds the saved value with the earliest timestamp closest to the period-based offset behind the current bar's opening time.
Each function has two overloads for advanced and simple use cases. The first overload searches for a value in a user-specified `Data` object created by the `collectData()` function (see below). It returns a tuple containing the found value and the corresponding timestamp.
The second overload maintains a `Data` object internally to store and retrieve values for a specified `source` series. This overload returns a tuple containing the historical `source` value, the corresponding timestamp, and the current bar's `source` value, making it helpful for comparing past and present values from requested contexts.
Retrieving multiple values
The library includes the following functions to retrieve values from multiple historical points in time, facilitating calculations and comparisons with values retrieved across several intervals:
• `getDataAtTimes()` – Locates a past `source` value for each item in a `timestamps` array. Each retrieved value's timestamp represents the earliest time closest to one of the specified timestamps.
• `getDataAtTimeOffsets()` – Finds a past `source` value for each item in a `timeOffsets` array. Each retrieved value's timestamp represents the earliest time closest to one of the specified millisecond offsets behind the current bar's opening time.
• `getDataAtPeriodOffsets()` – Finds a past value for each item in a `periods` array. Each retrieved value's timestamp represents the earliest time closest to one of the specified period offsets behind the current bar's opening time.
Each function returns a tuple with arrays containing the found `source` values and their corresponding timestamps. In addition, the tuple includes the current `source` value and the symbol's description, which also makes these functions helpful for multi-interval comparisons using data from requested contexts.
Processing period inputs
When writing scripts that retrieve historical values based on several user-specified period offsets, the most concise approach is to create a single text input that allows users to list each period, then process the "string" list into an array for use in the `getDataAtPeriodOffsets()` function.
This library includes a `getArrayFromString()` function to provide a simple way to process strings containing comma-separated lists of periods. The function splits the specified `str` by its commas and returns an array containing every non-empty item in the list with surrounding whitespaces removed. View the example code to see how we use this function to process the value of a text area input .
Calculating period offset times
Because the exact amount of time covered by a specified period offset can vary, it is often helpful to verify the resulting times when using the `valueAtPeriodOffset()` or `getDataAtPeriodOffsets()` functions to ensure the calculations work as intended for your use case.
The library's `periodToTimestamp()` function calculates an offset timestamp from a given period and reference time. With this function, programmers can verify the time offsets in a period-based data search and use the calculated offset times in additional operations.
For periods with "D" or "W" units, the function calculates the time offset based on the absolute number of milliseconds the period covers (e.g., `86400000` for "1D"). For periods with "M", "Y", or "YTD" units, the function calculates an offset time based on the reference time's calendar date in the exchange time zone.
Collecting data
All the `getDataAt*()` functions, and the second overloads of the `valueAt*()` functions, collect and maintain data internally, meaning scripts do not require a separate `Data` object when using them. However, the first overloads of the `valueAt*()` functions do not collect data, because they retrieve values from a user-specified `Data` object.
For cases where a script requires a separate `Data` object for use with these overloads or other custom routines, this library exports the `collectData()` function. This function queues each bar's `source` value and opening timestamp into a `Data` object and returns the object's ID.
This function is particularly useful when searching for values from a specific series more than once. For instance, instead of using multiple calls to the second overloads of `valueAt*()` functions with the same `source` argument, programmers can call `collectData()` to store each bar's `source` and opening timestamp, then use the returned `Data` object's ID in calls to the first `valueAt*()` overloads to reduce memory usage.
The `collectData()` function and all the functions that collect data internally include two optional parameters for limiting the saved time-value pairs to a sliding window: `timeOffsetLimit` and `timeframeLimit`. When either has a non-na argument, the function restricts the collected data to the maximum number of recent bars covered by the specified millisecond- and timeframe-based intervals.
NOTE : All calls to the functions that collect data for a `source` series can execute up to once per bar or realtime tick, because each stored value requires a unique corresponding timestamp. Therefore, scripts cannot call these functions iteratively within a loop . If a call to these functions executes more than once inside a loop's scope, it causes a runtime error.
█ EXAMPLE CODE
The example code at the end of the script demonstrates one possible use case for this library's functions. The code retrieves historical price data at user-specified period offsets, calculates price returns for each period from the retrieved data, and then populates a table with the results.
The example code's process is as follows:
1. Input a list of periods – The user specifies a comma-separated list of period strings in the script's "Period list" input (e.g., "1W, 1M, 3M, 1Y, YTD"). Each item in the input list represents a period offset from the latest bar's opening time.
2. Process the period list – The example calls `getArrayFromString()` on the first bar to split the input list by its commas and construct an array of period strings.
3. Request historical data – The code uses a call to `getDataAtPeriodOffsets()` as the `expression` argument in a request.security() call to retrieve the closing prices of "1D" bars for each period included in the processed `periods` array.
4. Display information in a table – On the latest bar, the code uses the retrieved data to calculate price returns over each specified period, then populates a two-row table with the results. The cells for each return percentage are color-coded based on the magnitude and direction of the price change. The cells also include tooltips showing the compared daily bar's opening date in the exchange time zone.
█ NOTES
• This library's architecture relies on a user-defined type (UDT) for its data storage format. UDTs are blueprints from which scripts create objects , i.e., composite structures with fields containing independent values or references of any supported type.
• The library functions search through a `Data` object's `times` array using the array.binary_search_leftmost() function, which is more efficient than looping through collected data to identify matching timestamps. Note that this built-in works only for arrays with elements sorted in ascending order .
• Each function that collects data from a `source` series updates the values and times stored in a local `Data` object's arrays. If a single call to these functions were to execute in a loop , it would store multiple values with an identical timestamp, which can cause erroneous search behavior. To prevent looped calls to these functions, the library uses the `checkCall()` helper function in their scopes. This function maintains a counter that increases by one each time it executes on a confirmed bar. If the count exceeds the total number of bars, indicating the call executes more than once in a loop, it raises a runtime error .
• Typically, when requesting higher-timeframe data with request.security() while using barmerge.lookahead_on as the `lookahead` argument, the `expression` argument should be offset with the history-referencing operator to prevent lookahead bias on historical bars. However, the call in this script's example code enables lookahead without offsetting the `expression` because the script displays results only on the last historical bar and all realtime bars, where there is no future data to leak into the past. This call ensures the displayed results use the latest data available from the context on realtime bars.
Look first. Then leap.
█ EXPORTED TYPES
Data
A structure for storing successive timestamps and corresponding values from a dataset.
Fields:
times (array) : An "int" array containing a UNIX timestamp for each value in the `values` array.
values (array) : A "float" array containing values corresponding to the timestamps in the `times` array.
█ EXPORTED FUNCTIONS
getArrayFromString(str)
Splits a "string" into an array of substrings using the comma (`,`) as the delimiter. The function trims surrounding whitespace characters from each substring, and it excludes empty substrings from the result.
Parameters:
str (series string) : The "string" to split into an array based on its commas.
Returns: (array) An array of trimmed substrings from the specified `str`.
periodToTimestamp(period, referenceTime)
Calculates a UNIX timestamp representing the point offset behind a reference time by the amount of time within the specified `period`.
Parameters:
period (series string) : The period string, which determines the time offset of the returned timestamp. The specified argument must contain a unit and an optional multiplier (e.g., "1Y", "3M", "2W", "YTD"). Supported units are:
- "Y" for years.
- "M" for months.
- "W" for weeks.
- "D" for days.
- "YTD" (Year-to-date) for the span from the start of the `referenceTime` value's year in the exchange time zone. An argument with this unit cannot contain a multiplier.
referenceTime (series int) : The millisecond UNIX timestamp from which to calculate the offset time.
Returns: (int) A millisecond UNIX timestamp representing the offset time point behind the `referenceTime`.
collectData(source, timeOffsetLimit, timeframeLimit)
Collects `source` and `time` data successively across bars. The function stores the information within a `Data` object for use in other exported functions/methods, such as `valueAtTimeOffset()` and `valueAtPeriodOffset()`. Any call to this function cannot execute more than once per bar or realtime tick.
Parameters:
source (series float) : The source series to collect. The function stores each value in the series with an associated timestamp representing its corresponding bar's opening time.
timeOffsetLimit (simple int) : Optional. A time offset (range) in milliseconds. If specified, the function limits the collected data to the maximum number of bars covered by the range, with a minimum of one bar. If the call includes a non-empty `timeframeLimit` value, the function limits the data using the largest number of bars covered by the two ranges. The default is `na`.
timeframeLimit (simple string) : Optional. A valid timeframe string. If specified and not empty, the function limits the collected data to the maximum number of bars covered by the timeframe, with a minimum of one bar. If the call includes a non-na `timeOffsetLimit` value, the function limits the data using the largest number of bars covered by the two ranges. The default is `na`.
Returns: (Data) A `Data` object containing collected `source` values and corresponding timestamps over the allowed time range.
method valueAtTime(data, timestamp)
(Overload 1 of 2) Retrieves value and time data from a `Data` object's fields at the index of the earliest timestamp closest to the specified `timestamp`. Callable as a method or a function.
Parameters:
data (series Data) : The `Data` object containing the collected time and value data.
timestamp (series int) : The millisecond UNIX timestamp to search. The function returns data for the earliest saved timestamp that is closest to the value.
Returns: ( ) A tuple containing the following data from the `Data` object:
- The stored value corresponding to the identified timestamp ("float").
- The earliest saved timestamp that is closest to the specified `timestamp` ("int").
valueAtTime(source, timestamp, timeOffsetLimit, timeframeLimit)
(Overload 2 of 2) Retrieves `source` and time information for the earliest bar whose opening timestamp is closest to the specified `timestamp`. Any call to this function cannot execute more than once per bar or realtime tick.
Parameters:
source (series float) : The source series to analyze. The function stores each value in the series with an associated timestamp representing its corresponding bar's opening time.
timestamp (series int) : The millisecond UNIX timestamp to search. The function returns data for the earliest bar whose timestamp is closest to the value.
timeOffsetLimit (simple int) : Optional. A time offset (range) in milliseconds. If specified, the function limits the collected data to the maximum number of bars covered by the range, with a minimum of one bar. If the call includes a non-empty `timeframeLimit` value, the function limits the data using the largest number of bars covered by the two ranges. The default is `na`.
timeframeLimit (simple string) : (simple string) Optional. A valid timeframe string. If specified and not empty, the function limits the collected data to the maximum number of bars covered by the timeframe, with a minimum of one bar. If the call includes a non-na `timeOffsetLimit` value, the function limits the data using the largest number of bars covered by the two ranges. The default is `na`.
Returns: ( ) A tuple containing the following data:
- The `source` value corresponding to the identified timestamp ("float").
- The earliest bar's timestamp that is closest to the specified `timestamp` ("int").
- The current bar's `source` value ("float").
method valueAtTimeOffset(data, timeOffset)
(Overload 1 of 2) Retrieves value and time data from a `Data` object's fields at the index of the earliest saved timestamp closest to `timeOffset` milliseconds behind the current bar's opening time. Callable as a method or a function.
Parameters:
data (series Data) : The `Data` object containing the collected time and value data.
timeOffset (series int) : The millisecond offset behind the bar's opening time. The function returns data for the earliest saved timestamp that is closest to the calculated offset time.
Returns: ( ) A tuple containing the following data from the `Data` object:
- The stored value corresponding to the identified timestamp ("float").
- The earliest saved timestamp that is closest to `timeOffset` milliseconds before the current bar's opening time ("int").
valueAtTimeOffset(source, timeOffset, timeOffsetLimit, timeframeLimit)
(Overload 2 of 2) Retrieves `source` and time information for the earliest bar whose opening timestamp is closest to `timeOffset` milliseconds behind the current bar's opening time. Any call to this function cannot execute more than once per bar or realtime tick.
Parameters:
source (series float) : The source series to analyze. The function stores each value in the series with an associated timestamp representing its corresponding bar's opening time.
timeOffset (series int) : The millisecond offset behind the bar's opening time. The function returns data for the earliest bar's timestamp that is closest to the calculated offset time.
timeOffsetLimit (simple int) : Optional. A time offset (range) in milliseconds. If specified, the function limits the collected data to the maximum number of bars covered by the range, with a minimum of one bar. If the call includes a non-empty `timeframeLimit` value, the function limits the data using the largest number of bars covered by the two ranges. The default is `na`.
timeframeLimit (simple string) : Optional. A valid timeframe string. If specified and not empty, the function limits the collected data to the maximum number of bars covered by the timeframe, with a minimum of one bar. If the call includes a non-na `timeOffsetLimit` value, the function limits the data using the largest number of bars covered by the two ranges. The default is `na`.
Returns: ( ) A tuple containing the following data:
- The `source` value corresponding to the identified timestamp ("float").
- The earliest bar's timestamp that is closest to `timeOffset` milliseconds before the current bar's opening time ("int").
- The current bar's `source` value ("float").
method valueAtPeriodOffset(data, period)
(Overload 1 of 2) Retrieves value and time data from a `Data` object's fields at the index of the earliest timestamp closest to a calculated offset behind the current bar's opening time. The calculated offset represents the amount of time covered by the specified `period`. Callable as a method or a function.
Parameters:
data (series Data) : The `Data` object containing the collected time and value data.
period (series string) : The period string, which determines the calculated time offset. The specified argument must contain a unit and an optional multiplier (e.g., "1Y", "3M", "2W", "YTD"). Supported units are:
- "Y" for years.
- "M" for months.
- "W" for weeks.
- "D" for days.
- "YTD" (Year-to-date) for the span from the start of the current bar's year in the exchange time zone. An argument with this unit cannot contain a multiplier.
Returns: ( ) A tuple containing the following data from the `Data` object:
- The stored value corresponding to the identified timestamp ("float").
- The earliest saved timestamp that is closest to the calculated offset behind the bar's opening time ("int").
valueAtPeriodOffset(source, period, timeOffsetLimit, timeframeLimit)
(Overload 2 of 2) Retrieves `source` and time information for the earliest bar whose opening timestamp is closest to a calculated offset behind the current bar's opening time. The calculated offset represents the amount of time covered by the specified `period`. Any call to this function cannot execute more than once per bar or realtime tick.
Parameters:
source (series float) : The source series to analyze. The function stores each value in the series with an associated timestamp representing its corresponding bar's opening time.
period (series string) : The period string, which determines the calculated time offset. The specified argument must contain a unit and an optional multiplier (e.g., "1Y", "3M", "2W", "YTD"). Supported units are:
- "Y" for years.
- "M" for months.
- "W" for weeks.
- "D" for days.
- "YTD" (Year-to-date) for the span from the start of the current bar's year in the exchange time zone. An argument with this unit cannot contain a multiplier.
timeOffsetLimit (simple int) : Optional. A time offset (range) in milliseconds. If specified, the function limits the collected data to the maximum number of bars covered by the range, with a minimum of one bar. If the call includes a non-empty `timeframeLimit` value, the function limits the data using the largest number of bars covered by the two ranges. The default is `na`.
timeframeLimit (simple string) : Optional. A valid timeframe string. If specified and not empty, the function limits the collected data to the maximum number of bars covered by the timeframe, with a minimum of one bar. If the call includes a non-na `timeOffsetLimit` value, the function limits the data using the largest number of bars covered by the two ranges. The default is `na`.
Returns: ( ) A tuple containing the following data:
- The `source` value corresponding to the identified timestamp ("float").
- The earliest bar's timestamp that is closest to the calculated offset behind the current bar's opening time ("int").
- The current bar's `source` value ("float").
getDataAtTimes(timestamps, source, timeOffsetLimit, timeframeLimit)
Retrieves `source` and time information for each bar whose opening timestamp is the earliest one closest to one of the UNIX timestamps specified in the `timestamps` array. Any call to this function cannot execute more than once per bar or realtime tick.
Parameters:
timestamps (array) : An array of "int" values representing UNIX timestamps. The function retrieves `source` and time data for each element in this array.
source (series float) : The source series to analyze. The function stores each value in the series with an associated timestamp representing its corresponding bar's opening time.
timeOffsetLimit (simple int) : Optional. A time offset (range) in milliseconds. If specified, the function limits the collected data to the maximum number of bars covered by the range, with a minimum of one bar. If the call includes a non-empty `timeframeLimit` value, the function limits the data using the largest number of bars covered by the two ranges. The default is `na`.
timeframeLimit (simple string) : Optional. A valid timeframe string. If specified and not empty, the function limits the collected data to the maximum number of bars covered by the timeframe, with a minimum of one bar. If the call includes a non-na `timeOffsetLimit` value, the function limits the data using the largest number of bars covered by the two ranges. The default is `na`.
Returns: ( ) A tuple of the following data:
- An array containing a `source` value for each identified timestamp (array).
- An array containing an identified timestamp for each item in the `timestamps` array (array).
- The current bar's `source` value ("float").
- The symbol's description from `syminfo.description` ("string").
getDataAtTimeOffsets(timeOffsets, source, timeOffsetLimit, timeframeLimit)
Retrieves `source` and time information for each bar whose opening timestamp is the earliest one closest to one of the time offsets specified in the `timeOffsets` array. Each offset in the array represents the absolute number of milliseconds behind the current bar's opening time. Any call to this function cannot execute more than once per bar or realtime tick.
Parameters:
timeOffsets (array) : An array of "int" values representing the millisecond time offsets used in the search. The function retrieves `source` and time data for each element in this array. For example, the array ` ` specifies that the function returns data for the timestamps closest to one day and one week behind the current bar's opening time.
source (float) : (series float) The source series to analyze. The function stores each value in the series with an associated timestamp representing its corresponding bar's opening time.
timeOffsetLimit (simple int) : Optional. A time offset (range) in milliseconds. If specified, the function limits the collected data to the maximum number of bars covered by the range, with a minimum of one bar. If the call includes a non-empty `timeframeLimit` value, the function limits the data using the largest number of bars covered by the two ranges. The default is `na`.
timeframeLimit (simple string) : Optional. A valid timeframe string. If specified and not empty, the function limits the collected data to the maximum number of bars covered by the timeframe, with a minimum of one bar. If the call includes a non-na `timeOffsetLimit` value, the function limits the data using the largest number of bars covered by the two ranges. The default is `na`.
Returns: ( ) A tuple of the following data:
- An array containing a `source` value for each identified timestamp (array).
- An array containing an identified timestamp for each offset specified in the `timeOffsets` array (array).
- The current bar's `source` value ("float").
- The symbol's description from `syminfo.description` ("string").
getDataAtPeriodOffsets(periods, source, timeOffsetLimit, timeframeLimit)
Retrieves `source` and time information for each bar whose opening timestamp is the earliest one closest to a calculated offset behind the current bar's opening time. Each calculated offset represents the amount of time covered by a period specified in the `periods` array. Any call to this function cannot execute more than once per bar or realtime tick.
Parameters:
periods (array) : An array of period strings, which determines the time offsets used in the search. The function retrieves `source` and time data for each element in this array. For example, the array ` ` specifies that the function returns data for the timestamps closest to one day, week, and month behind the current bar's opening time. Each "string" in the array must contain a unit and an optional multiplier. Supported units are:
- "Y" for years.
- "M" for months.
- "W" for weeks.
- "D" for days.
- "YTD" (Year-to-date) for the span from the start of the current bar's year in the exchange time zone. An argument with this unit cannot contain a multiplier.
source (float) : (series float) The source series to analyze. The function stores each value in the series with an associated timestamp representing its corresponding bar's opening time.
timeOffsetLimit (simple int) : Optional. A time offset (range) in milliseconds. If specified, the function limits the collected data to the maximum number of bars covered by the range, with a minimum of one bar. If the call includes a non-empty `timeframeLimit` value, the function limits the data using the largest number of bars covered by the two ranges. The default is `na`.
timeframeLimit (simple string) : Optional. A valid timeframe string. If specified and not empty, the function limits the collected data to the maximum number of bars covered by the timeframe, with a minimum of one bar. If the call includes a non-na `timeOffsetLimit` value, the function limits the data using the largest number of bars covered by the two ranges. The default is `na`.
Returns: ( ) A tuple of the following data:
- An array containing a `source` value for each identified timestamp (array).
- An array containing an identified timestamp for each period specified in the `periods` array (array).
- The current bar's `source` value ("float").
- The symbol's description from `syminfo.description` ("string").
Smart Money Concept [TradingFinder] Major OB + FVG + Liquidity🔵 Introduction
"Smart Money" refers to funds under the control of institutional investors, central banks, funds, market makers, and other financial entities. Ordinary people recognize investments made by those who have a deep understanding of market performance and possess information typically inaccessible to regular investors as "Smart Money".
Consequently, when market movements often diverge from expectations, traders identify the footprints of smart money. For example, when a classic pattern forms in the market, traders take short positions. However, the market might move upward instead. They attribute this contradiction to smart money and seek to capitalize on such inconsistencies in their trades.
The "Smart Money Concept" (SMC) is one of the primary styles of technical analysis that falls under the subset of "Price Action". Price action encompasses various subcategories, with one of the most significant being "Supply and Demand", in which SMC is categorized.
The SMC method aims to identify trading opportunities by emphasizing the impact of large traders (Smart Money) on the market, offering specific patterns, techniques, and trading strategies.
🟣 Key Terms of Smart Money Concept (SMC)
• Market Structure (Trend)
• Change of Character (ChoCh)
• Break of Structure (BoS)
• Order Blocks (Supply and Demand)
• Imbalance (IMB)
• Inefficiency (IFC)
• Fair Value Gap (FVG)
• Liquidity
• Premium and Discount
🔵 How Does the "Smart Money Concept Indicator" Work?
🟣 Market Structure
a. Accumulation
b. Market-Up
c. Distribution
d. Market-Down
a) Accumulation Phase : During the accumulation period, typically following a downtrend, smart money enters the market without significantly affecting the pricing trend.
b) Market-Up Phase : In this phase, the price of an asset moves upward from the accumulation range and begins to rise. Usually, the buying by retail investors is the main driver of this trend, and due to positive market sentiment, it continues.
c) Distribution Phase : The distribution phase, unlike the accumulation stage, occurs after an uptrend. In this phase, smart money attempts to exit the market without causing significant price fluctuations.
d) Market-Down Phase : In this stage, the price of an asset moves downward from the distribution phase, initiating a prolonged downtrend. Smart money liquidates all its positions by creating selling pressure, trapping latecomer investors.
The result of these four phases in the market becomes the market trend.
Types of Trends in Financial Markets :
a. Up-Trend
b. Down Trend
c. Range (No Trend)
a) Up-Trend : The market breaks consecutive highs.
b) Down Trend : The market breaks consecutive lows.
c) No Trend or Range : The market oscillates within a range without breaking either highs or lows.
🟣 Change of Character (ChoCh)
The "ChoCh" or "Change of Character" pattern indicates an initial change in order flow in financial markets. This structural change occurs when a major pivot in the opposite direction of the market trend fails. It signals a potential change in the market trend and can serve as a signal for short-term or long-term trend changes in a trading symbol.
🟣 Break of Structure (BoS)
The "BoS" or "Break of Structure" pattern indicates the continuation of the trend in financial markets. This structure forms when, in an uptrend, the price breaks its ceiling or, in a downtrend, the price breaks its floor.
🟣 Order Blocks (Supply and Demand)
Order blocks consist of supply and demand areas where the likelihood of price reversal is higher. There are six order blocks in this indicator, categorized based on their origin and formation reasons.
a. Demand Main Zone, "ChoCh" Origin.
b. Demand Sub Zone, "ChoCh" Origin.
c. Demand All Zone, "BoS" Origin.
d. Supply Main Zone, "ChoCh" Origin.
e. Supply Sub Zone, "ChoCh" Origin.
f. Supply All Zone, "BoS" Origin.
🟣 FVG | Inefficiency | Imbalance
These three terms are almost synonymous. They describe the presence of gaps between consecutive candle shadows. This inefficiency occurs when the market moves rapidly. Primarily, imbalances and these rapid movements stem from the entry of smart money and the imbalance between buyer and seller power. Therefore, identifying these movements is crucial for traders.
These areas are significant because prices often return to fill these gaps or even before they occur to fill price gaps.
🟣 Liquidity
Liquidity zones are areas where there is a likelihood of congestion of stop-loss orders. Liquidity is considered the driving force of the entire market, and market makers may manipulate the market using these zones. However, in many cases, this does not happen because there is insufficient liquidity in some areas.
Types of Liquidity in Financial Markets :
a. Trend Lines
b. Double Tops | Double Bottoms
c. Triple Tops | Triple Bottoms
d. Support Lines | Resistance Lines
All four types of liquidity in this indicator are automatically identified.
🟣 Premium and Discount
Premium and discount zones can assist traders in making better decisions. For instance, they may sell positions in expensive ranges and buy in cheaper ranges. The closer the price is to the major resistance, the more expensive it is, and the closer it is to the major support, the cheaper it is.
🔵 How to Use
🟣 Change of Character (ChoCh) and Break of Structure (BoS)
This indicator detects "ChoCh" and "BoS" in both Minor and Major states. You can turn on the display of these lines by referring to the last part of the settings.
🟣 Order Blocks (Supply and Demand)
Order blocks are Zones where the probability of price reversal is higher. In demand Zones you can buy opportunities and in supply Zones you can check sell opportunities.
The "Refinement" feature allows you to adjust the width of the order block according to your strategy. There are two modes, "Aggressive" and "Defensive," in the "Order Block Refine". The difference between "Aggressive" and "Defensive" lies in the width of the order block.
For risk-averse traders, the "Defensive" mode is suitable as it provides a lower loss limit and a greater reward-to-risk ratio. For risk-taking traders, the "Aggressive" mode is more appropriate. These traders prefer to enter trades at higher prices, and this mode, which has a wider order block width, is more suitable for this group of individuals.
🟣 Fair Value Gap (FVG) | Imbalance (IMB) | Inefficiency (IFC)
In order to identify the "fair value gap" on the chart, it must be analyzed candle by candle. In this process, it is important to pay attention to candles with a large size, and a candle and a candle should be examined before that.
Candles before and after this central candle should have long shadows and their bodies should not overlap with the central candle body. The distance between the shadows of the first and third candles is known as the FVG range.
These areas work in two ways :
• Supply and demand area : In this case, the price reacts to these areas and the trend is reversed.
• Liquidity zone : In this scenario, the price "fills" the zone and then reaches the order block.
Important note : In most cases, the FVG zone of very small width acts as a supply and demand zone, while the zone of significant width acts as a liquidity zone and absorbs price.
When the FVG filter is activated, the FVG regions are filtered based on the specified algorithm.
FVG filter types include the following :
1. Very Aggressive Mode : In addition to the initial condition, an additional condition is considered. For bullish FVG, the maximum price of the last candle must be greater than the maximum price of the middle candle.
Similarly, for a bearish FVG, the minimum price of the last candle must be lower than the minimum price of the middle candle. This mode removes the minimum number of FVGs.
2. Aggressive : In addition to the very aggressive condition, the size of the middle candle is also considered. The size of the center candle should not be small and therefore more FVGs are removed in this case.
3. Defensive : In addition to the conditions of the very aggressive mode, this mode also considers the size of the middle pile, which should be relatively large and make up the majority of the body.
Also, to identify bullish FVGs, the second and third candles must be positive, while for bearish FVGs, the second and third candles must be negative. This mode filters out a significant number of FVGs and keeps only those of good quality.
4. Very Defensive : In addition to the conditions of the defensive mode, in this mode the first and third candles should not be very small-bodied doji candles. This mode filters out most FVGs and only the best quality ones remain.
🟣 Liquidity
These levels are where traders intend to exit their trades. "Market makers" or smart money usually accumulate or distribute their trading positions near these levels, where many retail traders have placed their "stop loss" orders. When liquidity is collected from these losses, the price often reverses.
A "Stop hunt" is a move designed to offset liquidity generated by established stop losses. Banks often use major news events to trigger stop hunts and capture liquidity released into the market. For example, if they intend to execute heavy buy orders, they encourage others to sell through stop-hots.
Consequently, if there is liquidity in the market before reaching the order block area, the validity of that order block is higher. Conversely, if the liquidity is close to the order block, that is, the price reaches the order block before reaching the liquidity limit, the validity of that order block is lower.
🟣 Alert
With the new alert functionality in this indicator, you won't miss any important trading signals. Alerts are activated when the price hits the last order block.
1. It is possible to set alerts for each "symbol" and "time frame". The system will automatically detect both and include them in the warning message.
2. Each alert provides the exact date and time it was triggered. This helps you measure the timeliness of the signal and evaluate its relevance.
3. Alerts include target order block price ranges. The "Proximal" level represents the initial price level strike, while the "Distal" level represents the maximum price gap in the block. These details are included in the warning message.
4. You can customize the alert name through the "Alert Name" entry.
5. Create custom messages for "long" and "short" alerts to be sent with notifications.
🔵 Setting
a. Pivot Period of Order Blocks Detector :
Using this parameter, you can set the zigzag period that is formed based on the pivots.
b. Order Blocks Validity Period (Bar) :
You can set the validity period of each Order Block based on the number of candles that have passed since the origin of the Order Block.
c. Demand Main Zone, "ChoCh" Origin :
You can control the display or not display as well as the color of Demand Main Zone, "ChoCh" Origin.
d. Demand Sub Zone, "ChoCh" Origin :
You can control the display or not display as well as the color of Demand Sub Zone, "ChoCh" Origin.
e. Demand All Zone, "BoS" Origin :
You can control the display or not display as well as the color of Demand All Zone, "BoS" Origin.
f. Supply Main Zone, "ChoCh" Origin :
You can control the display or not display as well as the color of Supply Main Zone, "ChoCh" Origin.
g. Supply Sub Zone, "ChoCh" Origin :
You can control the display or not display as well as the color of Supply Sub Zone, "ChoCh" Origin.
h. Supply All Zone, "BoS" Origin :
You can control the display or not display as well as the color of Supply All Zone, "BoS" Origin.
i. Refine Demand Main : You can choose to be refined or not and also the type of refining.
j. Refine Demand Sub : You can choose to be refined or not and also the type of refining.
k. Refine Demand BoS : You can choose to be refined or not and also the type of refining.
l. Refine Supply Main : You can choose to be refined or not and also the type of refining.
m. Refine Supply Sub : You can choose to be refined or not and also the type of refining.
n. Refine Supply BoS : You can choose to be refined or not and also the type of refining.
o. Show Demand FVG : You can choose to show or not show Demand FVG.
p. Show Supply FVG : You can choose to show or not show Supply FVG
q. FVG Filter : You can choose whether FVG is filtered or not. Also specify the type of filter you want to use.
r. Show Statics High Liquidity Line : Show or not show Statics High Liquidity Line.
s. Show Statics Low Liquidity Line : Show or not show Statics Low Liquidity Line.
t. Show Dynamics High Liquidity Line : Show or not show Dynamics High Liquidity Line.
u. Show Dynamics Low Liquidity Line : Show or not show Dynamics Low Liquidity Line.
v. Statics Period Pivot :
Using this parameter, you can set the Swing period that is formed based on Static Liquidity Lines.
w. Dynamics Period Pivot :
Using this parameter, you can set the Swing period that is formed based Dynamics Liquidity Lines.
x. Statics Liquidity Line Sensitivity :
is a number between 0 and 0.4. Increasing this number decreases the sensitivity of the "Statics Liquidity Line Detection" function and increases the number of lines identified. The default value is 0.3.
y. Dynamics Liquidity Line Sensitivity :
is a number between 0.4 and 1.95. Increasing this number increases the sensitivity of the "Dynamics Liquidity Line Detection" function and decreases the number of lines identified. The default value is 1.
z. Alerts Name : You can customize the alert name using this input and set it to your desired name.
aa. Alert Demand Main Mitigation :
If you want to receive the alert about Demand Main 's mitigation after setting the alerts, leave this tick on. Otherwise, turn it off.
bb. Alert Demand Sub Mitigation :
If you want to receive the alert about Demand Sub's mitigation after setting the alerts, leave this tick on. Otherwise, turn it off.
cc. Alert Demand BoS Mitigation :
If you want to receive the alert about Demand BoS's mitigation after setting the alerts, leave this tick on. Otherwise, turn it off.
dd. Alert Supply Main Mitigation :
If you want to receive the alert about Supply Main's mitigation after setting the alerts, leave this tick on. Otherwise, turn it off.
ee. Alert Supply Sub Mitigation :
If you want to receive the alert about Supply Sub's mitigation after setting the alerts, leave this tick on. Otherwise, turn it off.
ff. Alert Supply BoS Mitigation :
If you want to receive the alert about Supply BoS's mitigation after setting the alerts, leave this tick on. Otherwise, turn it off.
gg. Message Frequency :
This parameter, represented as a string, determines the frequency of announcements. Options include: 'All' (triggers the alert every time the function is called), 'Once Per Bar' (triggers the alert only on the first call within the bar), and 'Once Per Bar Close' (activates the alert only during the final script execution of the real-time bar upon closure). The default setting is 'Once per Bar'.
hh. Show Alert time by Time Zone :
The date, hour, and minute displayed in alert messages can be configured to reflect any chosen time zone. For instance, if you prefer London time, you should input 'UTC+1'. By default, this input is configured to the 'UTC' time zone.
ii. Display More Info : The 'Display More Info' option provides details regarding the price range of the order blocks (Zone Price), along with the date, hour, and minute. If you prefer not to include this information in the alert message, you should set it to 'Off'.
You also have access to display or not to display, choose the Style and Color of all the lines below :
a. Major Bullish "BoS" Lines
b. Major Bearish "BoS" Lines
c. Minor Bullish "BoS" Lines
d. Minor Bearish "BoS" Lines
e. Major Bullish "ChoCh" Lines
f. Major Bearish "ChoCh" Lines
g. Minor Bullish "ChoCh" Lines
h. Minor Bearish "ChoCh" Lines
i. Last Major Support Line
j. Last Major Resistance Line
k. Last Minor Support Line
l. Last Minor Resistance Line
Volume Profile Histogram [SS]I usually (and by usually, I mean the past year xD) release a significant indicator as my Christmas gift to the community on Christmas Eve. Last year, it was the Z-Score buy and sell signal; this year, it's something a little more conventional. So here is this year’s gift—hope you like it! 🎁
Seems like everyone has their take on Volume Profiles (aka SVP or VSP). I decided to create one, and in true Steversteves fashion, you can expect to find all the goodies that come with most of my stuff, including a volume profile presented in a bell-curve/histogram style (chart above) and statistical frequency tables showing the cases by ranges:
And it wouldn't be a true Steversteves indicator without some kind of ATR thing:
So, what does it do?
At the end of the day, it is a form of an SVP indicator. However, it is meant to operate on a larger scale, sorting volume in a traditional bell-curve style. In addition to displaying volume, it breaks down buying vs. selling volume. Selling volume is classified as such when the open is greater than close, while buying is when close is greater than open. This breakdown allows you to see the distribution, by price range, of where selling and buying occur.
This permits the indicator to provide 2 Points of Control (POCs). A POC is defined as an area of high volume activity. Because buying and selling volumes are broken down into two, we can identify areas with high selling and areas with high buying. Sometimes they coincide, sometimes they differ.
If we look at SQQQ, for example:
We can see that the bearish point of control is one point below the bullish POC. This is interesting because it essentially shows where people may be "panic selling" or setting their stop-outs. If SQQQ drops below 18.8, then it's likely to trigger panic selling, as indicated by the histogram.
Conversely, we can observe that traders tend to position long between $18 and $24. The POC is noted in the stats table and also displayed on the chart. Bullish POC is shown in purple, bearish in yellow. These, of course, can be toggled off.
The Frequency Table:
The frequency table shows how many observations were obtained in each price range. The histogram illustrates the cumulative volume traded, while the frequency simply counts how many cases occurred over the lookback period.
ATR Range Analytics by Volume:
The indicator also has the ability to display range analytics by volume. When you toggle on the range analytics by volume option, a range chart will appear:
www.tradingview.com
The range chart goes from the minimum recorded volume to the maximum recorded volume in the period, showing the average range and direction associated with this volume. This is crucial to pay attention to because not all stocks behave the same way.
For example, in the chart above (AMD), we can see that low volume produces a general bearish bias, and high volume produces a general bullish bias. However, if we look at the range analytics for SPY:
Low volume has the inverse effect. Low volume is associated with a more bullish bias, and high volume indicates a more bearish bias. In the ATR chart, the threshold volume to transition from bullish bias to bearish bias is approximately > 78,607,268 traded shares.
The Stats Table:
The stats table can be toggled on or off. It simply displays the POCs and the time range for the VSP. The default time range is 1 trading year (252 days), assuming you are on the daily timeframe. However, you can use this on any timeframe.
The percentages displayed in the histogram is the cumulative percent of buying and selling volume independently. So when you see the percentage on the selling histogram, its the percent of cumulative selling only. Same for the buying.
And that's the indicator! I hope you enjoy it. Let me know your thoughts. I hope you all have safe holidays, a Merry Christmas for you North Americans, and a Happy Christmas for you UKers, and whatever else you celebrate/care about and do! Safe trades, everyone, and enjoy your holidays! 🎁🎄🎄🎄⭐⭐⭐ 🕎 🕎 🕎
chrono_utilsLibrary "chrono_utils"
Collection of objects and common functions that are related to datetime windows session days and time
ranges. The main purpose of this library is to handle time-related functionality and make it easy to reason about a
future bar checking if it will be part of a predefined session and/or inside a datetime window. All existing session
functionality I found in the documentation e.g. "not na(time(timeframe, session, timezone))" are not suitable for
strategy scripts, since the execution of the orders is delayed by one bar, due to the script execution happening at
the bar close. Moreover, a history operator with a negative value that looks forward is not allowed in any pinescript
expression. So, a prediction for the next bar using the bars_back argument of "time()"" and "time_close()" was
necessary. Thus, I created this library to overcome this small but very important limitation. In the meantime, I
added useful functionality to handle session-based behavior. An interesting utility that emerged from this
development is the data anomaly detection where a comparison between the prediction and the actual value is happening.
If those two values are different then a data inconsistency happened between the prediction bar and the actual bar
(probably due to a holiday, half session day, a timezone change etc..)
exTimezone(timezone)
exTimezone - Convert extended timezone to timezone string
Parameters:
timezone (simple string) : - The timezone or a special string
Returns: string representing the timezone
nameOfDay(day)
nameOfDay - Convert the day id into a short nameOfDay
Parameters:
day (int) : - The day id to convert
Returns: - The short name of the day
today()
today - Get the day id of this day
Returns: - The day id
nthDayAfter(day, n)
nthDayAfter - Get the day id of n days after the given day
Parameters:
day (int) : - The day id of the reference day
n (int) : - The number of days to go forward
Returns: - The day id of the day that is n days after the reference day
nextDayAfter(day)
nextDayAfter - Get the day id of next day after the given day
Parameters:
day (int) : - The day id of the reference day
Returns: - The day id of the next day after the reference day
nthDayBefore(day, n)
nthDayBefore - Get the day id of n days before the given day
Parameters:
day (int) : - The day id of the reference day
n (int) : - The number of days to go forward
Returns: - The day id of the day that is n days before the reference day
prevDayBefore(day)
prevDayBefore - Get the day id of previous day before the given day
Parameters:
day (int) : - The day id of the reference day
Returns: - The day id of the previous day before the reference day
tomorrow()
tomorrow - Get the day id of the next day
Returns: - The next day day id
normalize(num, min, max)
normalizeHour - Check if number is inthe range of
Parameters:
num (int)
min (int)
max (int)
Returns: - The normalized number
normalizeHour(hourInDay)
normalizeHour - Check if hour is valid and return a noralized hour range from
Parameters:
hourInDay (int)
Returns: - The normalized hour
normalizeMinute(minuteInHour)
normalizeMinute - Check if minute is valid and return a noralized minute from
Parameters:
minuteInHour (int)
Returns: - The normalized minute
monthInMilliseconds(mon)
monthInMilliseconds - Calculate the miliseconds in one bar of the timeframe
Parameters:
mon (int) : - The month of reference to get the miliseconds
Returns: - The number of milliseconds of the month
barInMilliseconds()
barInMilliseconds - Calculate the miliseconds in one bar of the timeframe
Returns: - The number of milliseconds in one bar
method to_string(this)
to_string - Formats the time window into a human-readable string
Namespace types: DateTimeWindow
Parameters:
this (DateTimeWindow) : - The time window object with the from and to datetimes
Returns: - The string of the time window
method to_string(this)
to_string - Formats the session days into a human-readable string with short day names
Namespace types: SessionDays
Parameters:
this (SessionDays) : - The session days object with the day selection
Returns: - The string of the session day short names
method to_string(this)
to_string - Formats the session time into a human-readable string
Namespace types: SessionTime
Parameters:
this (SessionTime) : - The session time object with the hour and minute of the time of the day
Returns: - The string of the session time
method to_string(this)
to_string - Formats the session time into a human-readable string
Namespace types: SessionTimeRange
Parameters:
this (SessionTimeRange) : - The session time range object with the start and end time of the daily session
Returns: - The string of the session time
method to_string(this)
to_string - Formats the session into a human-readable string
Namespace types: Session
Parameters:
this (Session) : - The session object with the day and the time range selection
Returns: - The string of the session
method init(this, fromDateTime, toDateTime)
init - Initialize the time window object from boolean values of each session day
Namespace types: DateTimeWindow
Parameters:
this (DateTimeWindow) : - The time window object that will hold the from and to datetimes
fromDateTime (int) : - The starting datetime of the time window
toDateTime (int) : - The ending datetime of the time window
Returns: - The time window object
method init(this, refTimezone, chTimezone, fromDateTime, toDateTime)
init - Initialize the time window object from boolean values of each session day
Namespace types: DateTimeWindow
Parameters:
this (DateTimeWindow) : - The time window object that will hold the from and to datetimes
refTimezone (simple string) : - The timezone of reference of the 'from' and 'to' dates
chTimezone (simple string) : - The target timezone to convert the 'from' and 'to' dates
fromDateTime (int) : - The starting datetime of the time window
toDateTime (int) : - The ending datetime of the time window
Returns: - The time window object
method init(this, sun, mon, tue, wed, thu, fri, sat)
init - Initialize the session days object from boolean values of each session day
Namespace types: SessionDays
Parameters:
this (SessionDays) : - The session days object that will hold the day selection
sun (bool) : - Is Sunday a trading day?
mon (bool) : - Is Monday a trading day?
tue (bool) : - Is Tuesday a trading day?
wed (bool) : - Is Wednesday a trading day?
thu (bool) : - Is Thursday a trading day?
fri (bool) : - Is Friday a trading day?
sat (bool) : - Is Saturday a trading day?
Returns: - The session days object
method init(this, unixTime)
init - Initialize the object from the hour and minute of the session time in exchange timezone (syminfo.timezone)
Namespace types: SessionTime
Parameters:
this (SessionTime) : - The session time object with the hour and minute of the time of the day
unixTime (int) : - The unix time
Returns: - The session time object
method init(this, hourInDay, minuteInHour)
init - Initialize the object from the hour and minute of the session time in exchange timezone (syminfo.timezone)
Namespace types: SessionTime
Parameters:
this (SessionTime) : - The session time object with the hour and minute of the time of the day
hourInDay (int) : - The hour of the time
minuteInHour (int) : - The minute of the time
Returns: - The session time object
method init(this, hourInDay, minuteInHour, refTimezone)
init - Initialize the object from the hour and minute of the session time
Namespace types: SessionTime
Parameters:
this (SessionTime) : - The session time object with the hour and minute of the time of the day
hourInDay (int) : - The hour of the time
minuteInHour (int) : - The minute of the time
refTimezone (string) : - The timezone of reference of the 'hour' and 'minute'
Returns: - The session time object
method init(this, startTime, endTime)
init - Initialize the object from the start and end session time in exchange timezone (syminfo.timezone)
Namespace types: SessionTimeRange
Parameters:
this (SessionTimeRange) : - The session time range object that will hold the start and end time of the daily session
startTime (SessionTime) : - The time the session begins
endTime (SessionTime) : - The time the session ends
Returns: - The session time range object
method init(this, startTimeHour, startTimeMinute, endTimeHour, endTimeMinute, refTimezone)
init - Initialize the object from the start and end session time
Namespace types: SessionTimeRange
Parameters:
this (SessionTimeRange) : - The session time range object that will hold the start and end time of the daily session
startTimeHour (int) : - The time hour the session begins
startTimeMinute (int) : - The time minute the session begins
endTimeHour (int) : - The time hour the session ends
endTimeMinute (int) : - The time minute the session ends
refTimezone (string)
Returns: - The session time range object
method init(this, days, timeRanges)
init - Initialize the session object from session days and time range
Namespace types: Session
Parameters:
this (Session) : - The session object that will hold the day and the time range selection
days (SessionDays) : - The session days object that defines the days the session is happening
timeRanges (array) : - The array of all the session time ranges during a session day
Returns: - The session object
method init(this, days, timeRanges, names, colors)
init - Initialize the session object from session days and time range
Namespace types: SessionView
Parameters:
this (SessionView) : - The session view object that will hold the session, the names and the color selections
days (SessionDays) : - The session days object that defines the days the session is happening
timeRanges (array) : - The array of all the session time ranges during a session day
names (array) : - The array of the names of the sessions
colors (array) : - The array of the colors of the sessions
Returns: - The session object
method get_size_in_secs(this)
get_size_in_secs - Count the seconds from start to end in the given timeframe
Namespace types: DateTimeWindow
Parameters:
this (DateTimeWindow) : - The time window object with the from and to datetimes
Returns: - The number of seconds inside the time widow for the given timeframe
method get_size_in_secs(this)
get_size_in_secs - Calculate the seconds inside the session
Namespace types: SessionTimeRange
Parameters:
this (SessionTimeRange) : - The session time range object with the start and end time of the daily session
Returns: - The number of seconds inside the session
method get_size_in_bars(this)
get_size_in_bars - Count the bars from start to end in the given timeframe
Namespace types: DateTimeWindow
Parameters:
this (DateTimeWindow) : - The time window object with the from and to datetimes
Returns: - The number of bars inside the time widow for the given timeframe
method get_size_in_bars(this)
get_size_in_bars - Calculate the bars inside the session
Namespace types: SessionTimeRange
Parameters:
this (SessionTimeRange) : - The session time range object with the start and end time of the daily session
Returns: - The number of bars inside the session for the given timeframe
method is_bar_included(this, offset_forward)
is_bar_included - Check if the given bar is between the start and end dates of the window
Namespace types: DateTimeWindow
Parameters:
this (DateTimeWindow) : - The time window object with the from and to datetimes
offset_forward (simple int) : - The number of bars forward. Default is 1
Returns: - Whether the current bar is inside the datetime window
method is_bar_included(this, offset_forward)
is_bar_included - Check if the given bar is inside the session as defined by the input params (what "not na(time(timeframe.period, this.to_sess_string()) )" should return if you could write it
Namespace types: Session
Parameters:
this (Session) : - The session with the day and the time range selection
offset_forward (simple int) : - The bar forward to check if it is between the from and to datetimes. Default is 1
Returns: - Whether the current time is inside the session
method to_sess_string(this)
to_sess_string - Formats the session days into a session string with day ids
Namespace types: SessionDays
Parameters:
this (SessionDays) : - The session days object
Returns: - The string of the session day ids
method to_sess_string(this)
to_sess_string - Formats the session time into a session string
Namespace types: SessionTime
Parameters:
this (SessionTime) : - The session time object with the hour and minute of the time of the day
Returns: - The string of the session time
method to_sess_string(this)
to_sess_string - Formats the session time into a session string
Namespace types: SessionTimeRange
Parameters:
this (SessionTimeRange) : - The session time range object with the start and end time of the daily session
Returns: - The string of the session time
method to_sess_string(this)
to_sess_string - Formats the session into a session string
Namespace types: Session
Parameters:
this (Session) : - The session object with the day and the time range selection
Returns: - The string of the session
method from_sess_string(this, sess)
from_sess_string - Initialize the session days object from the session string
Namespace types: SessionDays
Parameters:
this (SessionDays) : - The session days object that will hold the day selection
sess (string) : - The session string part that represents the days
Returns: - The session days object
method from_sess_string(this, sess)
from_sess_string - Initialize the session time object from the session string in exchange timezone (syminfo.timezone)
Namespace types: SessionTime
Parameters:
this (SessionTime) : - The session time object that will hold the hour and minute of the time
sess (string) : - The session string part that represents the time HHmm
Returns: - The session time object
method from_sess_string(this, sess, refTimezone)
from_sess_string - Initialize the session time object from the session string
Namespace types: SessionTime
Parameters:
this (SessionTime) : - The session time object that will hold the hour and minute of the time
sess (string) : - The session string part that represents the time HHmm
refTimezone (simple string) : - The timezone of reference of the 'hour' and 'minute'
Returns: - The session time object
method from_sess_string(this, sess)
from_sess_string - Initialize the session time range object from the session string in exchange timezone (syminfo.timezone)
Namespace types: SessionTimeRange
Parameters:
this (SessionTimeRange) : - The session time range object that will hold the start and end time of the daily session
sess (string) : - The session string part that represents the time range HHmm-HHmm
Returns: - The session time range object
method from_sess_string(this, sess, refTimezone)
from_sess_string - Initialize the session time range object from the session string
Namespace types: SessionTimeRange
Parameters:
this (SessionTimeRange) : - The session time range object that will hold the start and end time of the daily session
sess (string) : - The session string part that represents the time range HHmm-HHmm
refTimezone (simple string) : - The timezone of reference of the time ranges
Returns: - The session time range object
method from_sess_string(this, sess)
from_sess_string - Initialize the session object from the session string in exchange timezone (syminfo.timezone)
Namespace types: Session
Parameters:
this (Session) : - The session object that will hold the day and the time range selection
sess (string) : - The session string that represents the session HHmm-HHmm,HHmm-HHmm:ddddddd
Returns: - The session time range object
method from_sess_string(this, sess, refTimezone)
from_sess_string - Initialize the session object from the session string
Namespace types: Session
Parameters:
this (Session) : - The session object that will hold the day and the time range selection
sess (string) : - The session string that represents the session HHmm-HHmm,HHmm-HHmm:ddddddd
refTimezone (simple string) : - The timezone of reference of the time ranges
Returns: - The session time range object
method nth_day_after(this, day, n)
nth_day_after - The nth day after the given day that is a session day (true) in the object
Namespace types: SessionDays
Parameters:
this (SessionDays) : - The session days object with the day selection
day (int) : - The day id of the reference day
n (int) : - The number of days after
Returns: - The day id of the nth session day of the week after the given day
method nth_day_before(this, day, n)
nth_day_before - The nth day before the given day that is a session day (true) in the object
Namespace types: SessionDays
Parameters:
this (SessionDays) : - The session days object with the day selection
day (int) : - The day id of the reference day
n (int) : - The number of days after
Returns: - The day id of the nth session day of the week before the given day
method next_day(this)
next_day - The next day that is a session day (true) in the object
Namespace types: SessionDays
Parameters:
this (SessionDays) : - The session days object with the day selection
Returns: - The day id of the next session day of the week
method previous_day(this)
previous_day - The previous day that is session day (true) in the object
Namespace types: SessionDays
Parameters:
this (SessionDays) : - The session days object with the day selection
Returns: - The day id of the previous session day of the week
method get_sec_in_day(this)
get_sec_in_day - Count the seconds since the start of the day this session time represents
Namespace types: SessionTime
Parameters:
this (SessionTime) : - The session time object with the hour and minute of the time of the day
Returns: - The number of seconds passed from the start of the day until that session time
method get_ms_in_day(this)
get_ms_in_day - Count the milliseconds since the start of the day this session time represents
Namespace types: SessionTime
Parameters:
this (SessionTime) : - The session time object with the hour and minute of the time of the day
Returns: - The number of milliseconds passed from the start of the day until that session time
method is_day_included(this, day)
is_day_included - Check if the given day is inside the session days
Namespace types: SessionDays
Parameters:
this (SessionDays) : - The session days object with the day selection
day (int) : - The day to check if it is a trading day
Returns: - Whether the current day is included in the session days
DateTimeWindow
DateTimeWindow - Object that represents a datetime window with a beginning and an end
Fields:
fromDateTime (series int) : - The beginning of the datetime window
toDateTime (series int) : - The end of the datetime window
SessionDays
SessionDays - Object that represent the trading days of the week
Fields:
days (map) : - The map that contains all days of the week and their session flag
SessionTime
SessionTime - Object that represents the time (hour and minutes)
Fields:
hourInDay (series int) : - The hour of the day that ranges from 0 to 24
minuteInHour (series int) : - The minute of the hour that ranges from 0 to 59
minuteInDay (series int) : - The minute of the day that ranges from 0 to 1440. They will be calculated based on hourInDay and minuteInHour when method is called
SessionTimeRange
SessionTimeRange - Object that represents a range that extends from the start to the end time
Fields:
startTime (SessionTime) : - The beginning of the time range
endTime (SessionTime) : - The end of the time range
isOvernight (series bool) : - Whether or not this is an overnight time range
Session
Session - Object that represents a session
Fields:
days (SessionDays) : - The map of the trading days
timeRanges (array) : - The array with all time ranges of the session during the trading days
SessionView
SessionView - Object that visualize a session
Fields:
sess (Session) : - The Session object to be visualized
names (array) : - The names of the session time ranges
colors (array) : - The colors of the session time ranges
chrono_utilsLibrary "chrono_utils"
Collection of objects and common functions that are related to datetime windows session days and time
ranges. The main purpose of this library is to handle time-related functionality and make it easy to reason about a
future bar and see if it is part of a predefined user session and/or inside a datetime window. All existing session
functions I found in the documentation e.g. "not na(time(timeframe, session, timezone))" are not suitable for
strategies, since the execution of the orders is delayed by one bar due to the execution happening at the bar close.
So a prediction for the next bar is necessary. Moreover, a history operator with a negative value is not allowed e.g.
`not na(time(timeframe, session, timezone) )` expression is not valid. Thus, I created this library to overcome
this small but very important limitation. In the meantime, I added useful functionality to handle session-based
behavior. An interesting utility that emerged from this development is data anomaly detection where a comparison
between the prediction and the actual value is happening. If those two values are different then a data inconsistency
happens between the prediction bar and the actual bar (probably due to a holiday or half session day etc..)
exTimezone(timezone)
exTimezone - Convert extended timezone to timezone string
Parameters:
timezone (simple string) : - The timezone or a special string
Returns: string representing the timezone
nameOfDay(day)
nameOfDay - Convert the day id into a short nameOfDay
Parameters:
day (int) : - The day id to convert
Returns: - The short name of the day
today()
today - Get the day id of this day
Returns: - The day id
nthDayAfter(day, n)
nthDayAfter - Get the day id of n days after the given day
Parameters:
day (int) : - The day id of the reference day
n (int) : - The number of days to go forward
Returns: - The day id of the day that is n days after the reference day
nextDayAfter(day)
nextDayAfter - Get the day id of next day after the given day
Parameters:
day (int) : - The day id of the reference day
Returns: - The day id of the next day after the reference day
nthDayBefore(day, n)
nthDayBefore - Get the day id of n days before the given day
Parameters:
day (int) : - The day id of the reference day
n (int) : - The number of days to go forward
Returns: - The day id of the day that is n days before the reference day
prevDayBefore(day)
prevDayBefore - Get the day id of previous day before the given day
Parameters:
day (int) : - The day id of the reference day
Returns: - The day id of the previous day before the reference day
tomorrow()
tomorrow - Get the day id of the next day
Returns: - The next day day id
normalize(num, min, max)
normalizeHour - Check if number is inthe range of
Parameters:
num (int)
min (int)
max (int)
Returns: - The normalized number
normalizeHour(hourInDay)
normalizeHour - Check if hour is valid and return a noralized hour range from
Parameters:
hourInDay (int)
Returns: - The normalized hour
normalizeMinute(minuteInHour)
normalizeMinute - Check if minute is valid and return a noralized minute from
Parameters:
minuteInHour (int)
Returns: - The normalized minute
monthInMilliseconds(mon)
monthInMilliseconds - Calculate the miliseconds in one bar of the timeframe
Parameters:
mon (int) : - The month of reference to get the miliseconds
Returns: - The number of milliseconds of the month
barInMilliseconds()
barInMilliseconds - Calculate the miliseconds in one bar of the timeframe
Returns: - The number of milliseconds in one bar
method init(this, fromDateTime, toDateTime)
init - Initialize the time window object from boolean values of each session day
Namespace types: DateTimeWindow
Parameters:
this (DateTimeWindow) : - The time window object that will hold the from and to datetimes
fromDateTime (int) : - The starting datetime of the time window
toDateTime (int) : - The ending datetime of the time window
Returns: - The time window object
method init(this, refTimezone, chTimezone, fromDateTime, toDateTime)
init - Initialize the time window object from boolean values of each session day
Namespace types: DateTimeWindow
Parameters:
this (DateTimeWindow) : - The time window object that will hold the from and to datetimes
refTimezone (simple string) : - The timezone of reference of the 'from' and 'to' dates
chTimezone (simple string) : - The target timezone to convert the 'from' and 'to' dates
fromDateTime (int) : - The starting datetime of the time window
toDateTime (int) : - The ending datetime of the time window
Returns: - The time window object
method init(this, sun, mon, tue, wed, thu, fri, sat)
init - Initialize the session days object from boolean values of each session day
Namespace types: SessionDays
Parameters:
this (SessionDays) : - The session days object that will hold the day selection
sun (bool) : - Is Sunday a trading day?
mon (bool) : - Is Monday a trading day?
tue (bool) : - Is Tuesday a trading day?
wed (bool) : - Is Wednesday a trading day?
thu (bool) : - Is Thursday a trading day?
fri (bool) : - Is Friday a trading day?
sat (bool) : - Is Saturday a trading day?
Returns: - The session days objectfrom_chart
method init(this, unixTime)
init - Initialize the object from the hour and minute of the session time in exchange timezone (syminfo.timezone)
Namespace types: SessionTime
Parameters:
this (SessionTime) : - The session time object with the hour and minute of the time of the day
unixTime (int) : - The unix time
Returns: - The session time object
method init(this, hourInDay, minuteInHour)
init - Initialize the object from the hour and minute of the session time in exchange timezone (syminfo.timezone)
Namespace types: SessionTime
Parameters:
this (SessionTime) : - The session time object with the hour and minute of the time of the day
hourInDay (int) : - The hour of the time
minuteInHour (int) : - The minute of the time
Returns: - The session time object
method init(this, hourInDay, minuteInHour, refTimezone)
init - Initialize the object from the hour and minute of the session time
Namespace types: SessionTime
Parameters:
this (SessionTime) : - The session time object with the hour and minute of the time of the day
hourInDay (int) : - The hour of the time
minuteInHour (int) : - The minute of the time
refTimezone (string) : - The timezone of reference of the 'hour' and 'minute'
Returns: - The session time object
method init(this, startTime, endTime)
init - Initialize the object from the start and end session time in exchange timezone (syminfo.timezone)
Namespace types: SessionTimeRange
Parameters:
this (SessionTimeRange) : - The session time range object that will hold the start and end time of the daily session
startTime (SessionTime) : - The time the session begins
endTime (SessionTime) : - The time the session ends
Returns: - The session time range object
method init(this, startTimeHour, startTimeMinute, endTimeHour, endTimeMinute, refTimezone)
init - Initialize the object from the start and end session time
Namespace types: SessionTimeRange
Parameters:
this (SessionTimeRange) : - The session time range object that will hold the start and end time of the daily session
startTimeHour (int) : - The time hour the session begins
startTimeMinute (int) : - The time minute the session begins
endTimeHour (int) : - The time hour the session ends
endTimeMinute (int) : - The time minute the session ends
refTimezone (string)
Returns: - The session time range object
method init(this, days, timeRanges)
init - Initialize the user session object from session days and time range
Namespace types: UserSession
Parameters:
this (UserSession) : - The user-defined session object that will hold the day and the time range selection
days (SessionDays) : - The session days object that defines the days the session is happening
timeRanges (SessionTimeRange ) : - The array of all the session time ranges during a session day
Returns: - The user session object
method to_string(this)
to_string - Formats the time window into a human-readable string
Namespace types: DateTimeWindow
Parameters:
this (DateTimeWindow) : - The time window object with the from and to datetimes
Returns: - The string of the time window
method to_string(this)
to_string - Formats the session days into a human-readable string with short day names
Namespace types: SessionDays
Parameters:
this (SessionDays) : - The session days object with the day selection
Returns: - The string of the session day short names
method to_string(this)
to_string - Formats the session time into a human-readable string
Namespace types: SessionTime
Parameters:
this (SessionTime) : - The session time object with the hour and minute of the time of the day
Returns: - The string of the session time
method to_string(this)
to_string - Formats the session time into a human-readable string
Namespace types: SessionTimeRange
Parameters:
this (SessionTimeRange) : - The session time range object with the start and end time of the daily session
Returns: - The string of the session time
method to_string(this)
to_string - Formats the user session into a human-readable string
Namespace types: UserSession
Parameters:
this (UserSession) : - The user-defined session object with the day and the time range selection
Returns: - The string of the user session
method to_string(this)
to_string - Formats the bar into a human-readable string
Namespace types: Bar
Parameters:
this (Bar) : - The bar object with the open and close times
Returns: - The string of the bar times
method to_string(this)
to_string - Formats the chart session into a human-readable string
Namespace types: ChartSession
Parameters:
this (ChartSession) : - The chart session object that contains the days and the time range shown in the chart
Returns: - The string of the chart session
method get_size_in_secs(this)
get_size_in_secs - Count the seconds from start to end in the given timeframe
Namespace types: DateTimeWindow
Parameters:
this (DateTimeWindow) : - The time window object with the from and to datetimes
Returns: - The number of seconds inside the time widow for the given timeframe
method get_size_in_secs(this)
get_size_in_secs - Calculate the seconds inside the session
Namespace types: SessionTimeRange
Parameters:
this (SessionTimeRange) : - The session time range object with the start and end time of the daily session
Returns: - The number of seconds inside the session
method get_size_in_bars(this)
get_size_in_bars - Count the bars from start to end in the given timeframe
Namespace types: DateTimeWindow
Parameters:
this (DateTimeWindow) : - The time window object with the from and to datetimes
Returns: - The number of bars inside the time widow for the given timeframe
method get_size_in_bars(this)
get_size_in_bars - Calculate the bars inside the session
Namespace types: SessionTimeRange
Parameters:
this (SessionTimeRange) : - The session time range object with the start and end time of the daily session
Returns: - The number of bars inside the session for the given timeframe
method from_chart(this)
from_chart - Initialize the session days object from the chart
Namespace types: SessionDays
Parameters:
this (SessionDays) : - The session days object that will hold the day selection
Returns: - The user session object
method from_chart(this)
from_chart - Initialize the session time range object from the chart
Namespace types: SessionTimeRange
Parameters:
this (SessionTimeRange) : - The session time range object that will hold the start and end time of the daily session
Returns: - The session time range object
method from_chart(this)
from_chart - Initialize the session object from the chart
Namespace types: ChartSession
Parameters:
this (ChartSession) : - The chart session object that will hold the days and the time range shown in the chart
Returns: - The chart session object
method to_sess_string(this)
to_sess_string - Formats the session days into a session string with day ids
Namespace types: SessionDays
Parameters:
this (SessionDays) : - The session days object
Returns: - The string of the session day ids
method to_sess_string(this)
to_sess_string - Formats the session time into a session string
Namespace types: SessionTime
Parameters:
this (SessionTime) : - The session time object with the hour and minute of the time of the day
Returns: - The string of the session time
method to_sess_string(this)
to_sess_string - Formats the session time into a session string
Namespace types: SessionTimeRange
Parameters:
this (SessionTimeRange) : - The session time range object with the start and end time of the daily session
Returns: - The string of the session time
method to_sess_string(this)
to_sess_string - Formats the user session into a session string
Namespace types: UserSession
Parameters:
this (UserSession) : - The user-defined session object with the day and the time range selection
Returns: - The string of the user session
method to_sess_string(this)
to_sess_string - Formats the chart session into a session string
Namespace types: ChartSession
Parameters:
this (ChartSession) : - The chart session object that contains the days and the time range shown in the chart
Returns: - The string of the chart session
method from_sess_string(this, sess)
from_sess_string - Initialize the session days object from the session string
Namespace types: SessionDays
Parameters:
this (SessionDays) : - The session days object that will hold the day selection
sess (string) : - The session string part that represents the days
Returns: - The session days object
method from_sess_string(this, sess)
from_sess_string - Initialize the session time object from the session string in exchange timezone (syminfo.timezone)
Namespace types: SessionTime
Parameters:
this (SessionTime) : - The session time object that will hold the hour and minute of the time
sess (string) : - The session string part that represents the time HHmm
Returns: - The session time object
method from_sess_string(this, sess, refTimezone)
from_sess_string - Initialize the session time object from the session string
Namespace types: SessionTime
Parameters:
this (SessionTime) : - The session time object that will hold the hour and minute of the time
sess (string) : - The session string part that represents the time HHmm
refTimezone (simple string) : - The timezone of reference of the 'hour' and 'minute'
Returns: - The session time object
method from_sess_string(this, sess)
from_sess_string - Initialize the session time range object from the session string in exchange timezone (syminfo.timezone)
Namespace types: SessionTimeRange
Parameters:
this (SessionTimeRange) : - The session time range object that will hold the start and end time of the daily session
sess (string) : - The session string part that represents the time range HHmm-HHmm
Returns: - The session time range object
method from_sess_string(this, sess, refTimezone)
from_sess_string - Initialize the session time range object from the session string
Namespace types: SessionTimeRange
Parameters:
this (SessionTimeRange) : - The session time range object that will hold the start and end time of the daily session
sess (string) : - The session string part that represents the time range HHmm-HHmm
refTimezone (simple string) : - The timezone of reference of the time ranges
Returns: - The session time range object
method from_sess_string(this, sess)
from_sess_string - Initialize the user session object from the session string in exchange timezone (syminfo.timezone)
Namespace types: UserSession
Parameters:
this (UserSession) : - The user-defined session object that will hold the day and the time range selection
sess (string) : - The session string that represents the user session HHmm-HHmm,HHmm-HHmm:ddddddd
Returns: - The session time range object
method from_sess_string(this, sess, refTimezone)
from_sess_string - Initialize the user session object from the session string
Namespace types: UserSession
Parameters:
this (UserSession) : - The user-defined session object that will hold the day and the time range selection
sess (string) : - The session string that represents the user session HHmm-HHmm,HHmm-HHmm:ddddddd
refTimezone (simple string) : - The timezone of reference of the time ranges
Returns: - The session time range object
method nth_day_after(this, day, n)
nth_day_after - The nth day after the given day that is a session day (true) in the object
Namespace types: SessionDays
Parameters:
this (SessionDays) : - The session days object with the day selection
day (int) : - The day id of the reference day
n (int) : - The number of days after
Returns: - The day id of the nth session day of the week after the given day
method nth_day_before(this, day, n)
nth_day_before - The nth day before the given day that is a session day (true) in the object
Namespace types: SessionDays
Parameters:
this (SessionDays) : - The session days object with the day selection
day (int) : - The day id of the reference day
n (int) : - The number of days after
Returns: - The day id of the nth session day of the week before the given day
method next_day(this)
next_day - The next day that is a session day (true) in the object
Namespace types: SessionDays
Parameters:
this (SessionDays) : - The session days object with the day selection
Returns: - The day id of the next session day of the week
method previous_day(this)
previous_day - The previous day that is session day (true) in the object
Namespace types: SessionDays
Parameters:
this (SessionDays) : - The session days object with the day selection
Returns: - The day id of the previous session day of the week
method get_sec_in_day(this)
get_sec_in_day - Count the seconds since the start of the day this session time represents
Namespace types: SessionTime
Parameters:
this (SessionTime) : - The session time object with the hour and minute of the time of the day
Returns: - The number of seconds passed from the start of the day until that session time
method get_ms_in_day(this)
get_ms_in_day - Count the milliseconds since the start of the day this session time represents
Namespace types: SessionTime
Parameters:
this (SessionTime) : - The session time object with the hour and minute of the time of the day
Returns: - The number of milliseconds passed from the start of the day until that session time
method eq(this, other)
eq - Compare two bars
Namespace types: Bar
Parameters:
this (Bar) : - The bar object with the open and close times
other (Bar) : - The bar object to compare with
Returns: - Whether this bar is equal to the other one
method get_open_time(this)
get_open_time - The open time object
Namespace types: Bar
Parameters:
this (Bar) : - The bar object with the open and close times
Returns: - The open time object
method get_close_time(this)
get_close_time - The close time object
Namespace types: Bar
Parameters:
this (Bar) : - The bar object with the open and close times
Returns: - The close time object
method get_time_range(this)
get_time_range - Get the time range of the bar
Namespace types: Bar
Parameters:
this (Bar) : - The bar object with the open and close times
Returns: - The time range that the bar is in
getBarNow()
getBarNow - Get the current bar object with time and time_close timestamps
Returns: - The current bar
getFixedBarNow()
getFixedBarNow - Get the current bar with fixed width defined by the timeframe. Note: There are case like SPX 15min timeframe where the last session bar is only 10min. This will return a bar of 15 minutes
Returns: - The current bar
method is_in_window(this, win)
is_in_window - Check if the given bar is between the start and end dates of the window
Namespace types: Bar
Parameters:
this (Bar) : - The bar to check if it is between the from and to datetimes of the window
win (DateTimeWindow) : - The time window object with the from and to datetimes
Returns: - Whether the current bar is inside the datetime window
method is_in_timerange(this, rng)
is_in_timerange - Check if the given bar is inside the session time range
Namespace types: Bar
Parameters:
this (Bar) : - The bar to check if it is between the from and to datetimes
rng (SessionTimeRange) : - The session time range object with the start and end time of the daily session
Returns: - Whether the bar is inside the session time range and if this part of the next trading day
method is_in_days(this, days)
is_in_days - Check if the given bar is inside the session days
Namespace types: Bar
Parameters:
this (Bar) : - The bar to check if its day is a trading day
days (SessionDays) : - The session days object with the day selection
Returns: - Whether the current bar day is inside the session
method is_in_session(this, sess)
is_in_session - Check if the given bar is inside the session as defined by the input params (what "not na(time(timeframe.period, this.to_sess_string()) )" should return if you could write it
Namespace types: Bar
Parameters:
this (Bar) : - The bar to check if it is between the from and to datetimes
sess (UserSession) : - The user-defined session object with the day and the time range selection
Returns: - Whether the current time is inside the session
method next_bar(this, offsetBars)
next_bar - Predicts the next bars open and close time based on the charts session
Namespace types: ChartSession
Parameters:
this (ChartSession) : - The chart session object that contains the days and the time range shown in the chart
offsetBars (simple int) : - The number of bars forward
Returns: - Whether the current time is inside the session
DateTimeWindow
DateTimeWindow - Object that represents a datetime window with a beginning and an end
Fields:
fromDateTime (series int) : - The beginning of the datetime window
toDateTime (series int) : - The end of the datetime window
SessionDays
SessionDays - Object that represent the trading days of the week
Fields:
days (map) : - The map that contains all days of the week and their session flag
SessionTime
SessionTime - Object that represents the time (hour and minutes)
Fields:
hourInDay (series int) : - The hour of the day that ranges from 0 to 24
minuteInHour (series int) : - The minute of the hour that ranges from 0 to 59
minuteInDay (series int) : - The minute of the day that ranges from 0 to 1440. They will be calculated based on hourInDay and minuteInHour when method is called
SessionTimeRange
SessionTimeRange - Object that represents a range that extends from the start to the end time
Fields:
startTime (SessionTime) : - The beginning of the time range
endTime (SessionTime) : - The end of the time range
isOvernight (series bool) : - Whether or not this is an overnight time range
UserSession
UserSession - Object that represents a user-defined session
Fields:
days (SessionDays) : - The map of the user-defined trading days
timeRanges (SessionTimeRange ) : - The array with all time ranges of the user-defined session during the trading days
Bar
Bar - Object that represents the bars' open and close times
Fields:
openUnixTime (series int) : - The open time of the bar
closeUnixTime (series int) : - The close time of the bar
chartDayOfWeek (series int)
ChartSession
ChartSession - Object that represents the default session that is shown in the chart
Fields:
days (SessionDays) : - A map with the trading days shown in the chart
timeRange (SessionTimeRange) : - The time range of the session during a trading day
isFinalized (series bool)
ICT Concepts [LuxAlgo]The ICT Concepts indicator regroups core concepts highlighted by trader and educator "The Inner Circle Trader" (ICT) into an all-in-one toolkit. Features include Market Structure (MSS & BOS), Order Blocks, Imbalances, Buyside/Sellside Liquidity, Displacements, ICT Killzones, and New Week/Day Opening Gaps.
🔶 SETTINGS
🔹 Mode
When Present is selected, only data of the latest 500 bars are used/visualized, except for NWOG/NDOG
🔹 Market Structure
Enable/disable Market Structure.
Length: will set the lookback period/sensitivity.
In Present Mode only the latest Market Structure trend will be shown, while in Historical Mode, previous trends will be shown as well:
You can toggle MSS/BOS separately and change the colors:
🔹 Displacement
Enable/disable Displacement.
🔹 Volume Imbalance
Enable/disable Volume Imbalance.
# Visible VI's: sets the amount of visible Volume Imbalances (max 100), color setting is placed at the side.
🔹 Order Blocks
Enable/disable Order Blocks.
Swing Lookback: Lookback period used for the detection of the swing points used to create order blocks.
Show Last Bullish OB: Number of the most recent bullish order/breaker blocks to display on the chart.
Show Last Bearish OB: Number of the most recent bearish order/breaker blocks to display on the chart.
Color settings.
Show Historical Polarity Changes: Allows users to see labels indicating where a swing high/low previously occurred within a breaker block.
Use Candle Body: Allows users to use candle bodies as order block areas instead of the full candle range.
Change in Order Blocks style:
🔹 Liquidity
Enable/disable Liquidity.
Margin: sets the sensitivity, 2 points are fairly equal when:
'point 1' < 'point 2' + (10 bar Average True Range / (10 / margin)) and
'point 1' > 'point 2' - (10 bar Average True Range / (10 / margin))
# Visible Liq. boxes: sets the amount of visible Liquidity boxes (max 50), this amount is for Sellside and Buyside boxes separately.
Colour settings.
Change in Liquidity style:
🔹 Fair Value Gaps
Enable/disable FVG's.
Balance Price Range: this is the overlap of latest bullish and bearish Fair Value Gaps.
By disabling Balance Price Range only FVGs will be shown.
Options: Choose whether you wish to see FVG or Implied Fair Value Gaps (this will impact Balance Price Range as well)
# Visible FVG's: sets the amount of visible FVG's (max 20, in the same direction).
Color settings.
Change in FVG style:
🔹 NWOG/NDOG
Enable/disable NWOG; color settings; amount of NWOG shown (max 50).
Enable/disable NDOG ; color settings; amount of NDOG shown (max 50).
🔹 Fibonacci
This tool connects the 2 most recent bullish/bearish (if applicable) features of your choice, provided they are enabled.
3 examples (FVG, BPR, OB):
Extend lines -> Enabled (example OB):
🔹 Killzones
Enable/disable all or the ones you need.
Time settings are coded in the corresponding time zones.
🔶 USAGE
By default, the indicator displays each feature relevant to the most recent price variations in order to avoid clutter on the chart & to provide a very similar experience to how a user would contruct ICT Concepts by hand.
Users can use the historical mode in the settings to see historical market structure/imbalances. The ICT Concepts indicator has various use cases, below we outline many examples of how a trader could find usage of the features together.
In the above image we can see price took out Sellside liquidity, filled two bearish FVGs, a market structure shift, which then led to a clean retest of a bullish FVG as a clean setup to target the order block above.
Price then fills the OB which creates a breaker level as seen in yellow.
Broken OBs can be useful for a trader using the ICT Concepts indicator as it marks a level where orders have now been filled, indicating a solidified level that has proved itself as an area of liquidity. In the image above we can see a trade setup using a broken bearish OB as a potential entry level.
We can see the New Week Opening Gap (NWOG) above was an optimal level to target considering price may tend to fill / react off of these levels according to ICT.
In the next image above, we have another example of various use cases where the ICT Concepts indicator hypothetically allow traders to find key levels & find optimal entry points using market structure.
In the image above we can see a bearish Market Structure Shift (MSS) is confirmed, indicating a potential trade setup for targeting the Balanced Price Range imbalance (BPR) below with a stop loss above the buyside liquidity.
Although what we are demonstrating here is a hindsight example, it shows the potential usage this toolkit gives you for creating trading plans based on ICT Concepts.
Same chart but playing out the history further we can see directly after price came down to the Sellside liquidity & swept below it...
Then by enabling IFVGs in the settings, we can see the IFVG retests alongside the Sellside & Buyside liquidity acting in confluence.
Which allows us to see a great bullish structure in the market with various key levels for potential entries.
Here we can see a potential bullish setup as price has taken out a previous Sellside liquidity zone and is now retesting a NWOG + Volume Imbalance.
Users also have the option to display Fibonacci retracements based on market structure, order blocks, and imbalance areas, which can help place limit/stop orders more effectively as well as finding optimal points of interest beyond what the primary ICT Concepts features can generate for a trader.
In the above image we can see the Fibonacci extension was selected to be based on the NWOG giving us some upside levels above the buyside liquidity.
🔶 DETAILS
Each feature within the ICT Concepts indicator is described in the sub sections below.
🔹 Market Structure
Market structure labels are constructed from price breaking a prior swing point. This allows a user to determine the current market trend based on the price action.
There are two types of Market Structure labels included:
Market Structure Shift (MSS)
Break Of Structure (BOS)
A MSS occurs when price breaks a swing low in an uptrend or a swing high in a downtrend, highlighting a potential reversal. This is often labeled as "CHoCH", but ICT specifies it as MSS.
On the other hand, BOS labels occur when price breaks a swing high in an uptrend or a swing low in a downtrend. The occurrence of these particular swing points is caused by retracements (inducements) that highlights liquidity hunting in lower timeframes.
🔹 Order Blocks
More significant market participants (institutions) with the ability of placing large orders in the market will generally place a sequence of individual trades spread out in time. This is referred as executing what is called a "meta-order".
Order blocks highlight the area where potential meta-orders are executed. Bullish order blocks are located near local bottoms in an uptrend while bearish order blocks are located near local tops in a downtrend.
When price mitigates (breaks out) an order block, a breaker block is confirmed. We can eventually expect price to trade back to this breaker block offering a new trade opportunity.
🔹 Buyside & Sellside Liquidity
Buyside / Sellside liquidity levels highlight price levels where market participants might place limit/stop orders.
Buyside liquidity levels will regroup the stoploss orders of short traders as well as limit orders of long traders, while Sellside liquidity levels will regroup the stoploss orders of long traders as well as limit orders of short traders.
These levels can play different roles. More informed market participants might view these levels as source of liquidity, and once liquidity over a specific level is reduced it will be found in another area.
🔹 Imbalances
Imbalances highlight disparities between the bid/ask, these can also be defined as inefficiencies, which would suggest that not all available information is reflected by the price and would as such provide potential trading opportunities.
It is common for price to "rebalance" and seek to come back to a previous imbalance area.
ICT highlights multiple imbalance formations:
Fair Value Gaps: A three candle formation where the candle shadows adjacent to the central candle do not overlap, this highlights a gap area.
Implied Fair Value Gaps: Unlike the fair value gap the implied fair value gap has candle shadows adjacent to the central candle overlapping. The gap area is constructed from the average between the respective shadow and the nearest extremity of their candle body.
Balanced Price Range: Balanced price ranges occur when a fair value gap overlaps a previous fair value gap, with the overlapping area resulting in the imbalance area.
Volume Imbalance: Volume imbalances highlight gaps between the opening price and closing price with existing trading activity (the low/high overlap the previous high/low).
Opening Gap: Unlike volume imbalances opening gaps highlight areas with no trading activity. The low/high does not reach previous high/low, highlighting a "void" area.
🔹 Displacement
Displacements are scenarios where price forms successive candles of the same sentiment (bullish/bearish) with large bodies and short shadows.
These can more technically be identified by positive auto correlation (a close to open change is more likely to be followed by a change of the same sign) as well as volatility clustering (large changes are followed by large changes).
Displacements can be the cause for the formation of imbalances as well as market structure, these can be caused by the full execution of a meta order.
🔹 Kill Zones
Killzones represent different time intervals that aims at offering optimal trade entries. Killzones include:
- New York Killzone (7:9 ET)
- London Open Killzone (2:5 ET)
- London Close Killzone (10:12 ET)
- Asian Killzone (20:00 ET)
🔶 Conclusion & Supplementary Material
This script aims to emulate how a trader would draw each of the covered features on their chart in the most precise representation to how it's actually taught by ICT directly.
There are many parallels between ICT Concepts and Smart Money Concepts that we released in 2022 which has a more general & simpler usage:
ICT Concepts, however, is more specifically aligned toward the community's interpretation of how to analyze price 'based on ICT', rather than displaying features to have a more classic interpretation for a technical analyst.
London Breakout Tracker - Box Style📊 London Breakout Tracker (Pine Script v6)
This script is designed to track the Asian session range and identify breakout opportunities when the London session begins. It highlights high-probability trade setups and helps avoid fakeouts or overly wide ranges.
🧱 1. Session Time Definitions (Adjusted for Kenyan Time)
The Asian session is defined as:
3:00 AM to 11:00 AM (Kenyan Time)
🔐 2. Asian Session High & Low
During the Asian session:
The script tracks the highest high and lowest low to define the range.
These are stored in variables: asianHigh and asianLow.
🧊 3. Box Drawing for the Asian Range
Once the Asian session ends:
A visual box is drawn around the session using box.new().
This box spans from the session start to end bars and from the high to low.
It helps visually see the range price must break out from.
🚨 4. Breakout Signals
After the Asian session:
A Long Breakout signal is generated if:
The candle closes above the Asian High.
A Short Breakout signal is generated if:
The candle closes below the Asian Low.
This corresponds to 00:00 to 08:00 UTC
These are shown with:
✅ Green up label for long breakouts
❌ Red down label for short breakouts
🧯 5. Fakeout Detection
If price breaks out but closes back inside the Asian range, it’s marked as a Fakeout:
Long Fakeout: Price breaks above high, then closes back below.
Short Fakeout: Price breaks below low, then closes back above.
These are marked with orange X-crosses above or below candles.
⚠️ 6. Wide Range Filter
If the Asian session range is too wide (e.g. > 40 pips), a gray background is drawn.
This warns you not to trade that day since breakouts from wide ranges are unreliable.
📣 7. Alert Conditions
The script can trigger alerts in TradingView when:
🔔 A Long or Short Breakout occurs
⚠️ A Fakeout is detected
You can set these up via the TradingView alert system.
🎯 Overall Purpose:
The script helps you:
Clearly see the Asian session range
Identify breakout opportunities at the London open
Avoid trading during fakeouts or wide-range sessions
Get alerted when breakout/fakeout conditions occur
Low Liquidity Zones [PhenLabs]📊 Low Liquidity Zones
Version: PineScript™ v6
📌 Description
Low Liquidity Zones identifies and highlights periods of unusually low trading volume on your chart, marking areas where price movement occurred with minimal participation. These zones often represent potential support and resistance levels that may be more susceptible to price breakouts or reversals when revisited with higher volume.
Unlike traditional volume analysis tools that focus on high volume spikes, this indicator specializes in detecting low liquidity areas where price moved with minimal resistance. Each zone displays its volume delta, providing insight into buying vs. selling pressure during these thin liquidity periods. This combination of low volume detection and delta analysis helps traders identify potential price inefficiencies and weak structures in the market.
🚀 Points of Innovation
• Identifies low liquidity zones that most volume indicators overlook but which often become significant technical levels
• Displays volume delta within each zone, showing net buying/selling pressure during low liquidity periods
• Dynamically adjusts to different timeframes, allowing analysis across multiple time horizons
• Filters zones by maximum size percentage to focus only on precise price levels
• Maintains historical zones until they expire based on your lookback settings, creating a cumulative map of potential support/resistance areas
🔧 Core Components
• Low Volume Detection: Identifies candles where volume falls below a specified threshold relative to recent average volume, highlighting potential liquidity gaps.
• Volume Delta Analysis: Calculates and displays the net buying/selling pressure within each low liquidity zone, providing insight into the directional bias during low participation periods.
• Dynamic Timeframe Adjustment: Automatically scales analysis periods to match your selected timeframe preference, ensuring consistent identification of low liquidity zones regardless of chart settings.
• Zone Management System: Creates, tracks, and expires low liquidity zones based on your configured settings, maintaining visual clarity on the chart.
🔥 Key Features
• Low Volume Identification: Automatically detects and highlights candles where volume falls below your specified threshold compared to the moving average.
• Volume Delta Visualization: Shows the net volume delta within each zone, providing insight into whether buyers or sellers were dominant despite the low overall volume.
• Flexible Timeframe Analysis: Analyze low liquidity zones across multiple predefined timeframes or use a custom lookback period specific to your trading style.
• Zone Size Filtering: Filters out excessively large zones to focus only on precise price levels, improving signal quality.
• Automatic Zone Expiration: Older zones are automatically removed after your specified lookback period to maintain a clean, relevant chart display.
🎨 Visualization
• Volume Delta Labels: Each zone displays its volume delta with “+” or “-” prefix and K/M suffix for easy interpretation, showing the strength and direction of pressure during the low volume period.
• Persistent Historical Mapping: Zones remain visible for your specified lookback period, creating a cumulative map of potential support and resistance levels forming under low liquidity conditions.
📖 Usage Guidelines
Analysis Timeframe
Default: 1D
Range/Options: 15M, 1HR, 3HR, 4HR, 8HR, 16HR, 1D, 3D, 5D, 1W, Custom
Description: Determines the historical period to analyze for low liquidity zones. Shorter timeframes provide more recent data while longer timeframes offer a more comprehensive view of significant zones. Use Custom option with the setting below for precise control.
Custom Period (Bars)
Default: 1000
Range: 1+
Description: Number of bars to analyze when using Custom timeframe option. Higher values show more historical zones but may impact performance.
Volume Analysis
Volume Threshold Divisor
Default: 0.5
Range: 0.1-1.0
Description: Maximum volume relative to average to identify low volume zones. Example: 0.5 means volume must be below 50% of the average to qualify as low volume. Lower values create more selective zones while higher values identify more zones.
Volume MA Length
Default: 15
Range: 1+
Description: Period length for volume moving average calculation. Shorter periods make the indicator more responsive to recent volume changes, while longer periods provide a more stable baseline.
Zone Settings
Zone Fill Color
Default: #2196F3 (80% transparency)
Description: Color and transparency of the low liquidity zones. Choose colors that stand out against your chart background without obscuring price action.
Maximum Zone Size %
Default: 0.5
Range: 0.1+
Description: Maximum allowed height of a zone as percentage of price. Larger zones are filtered out. Lower values create more precise zones focusing on tight price ranges.
Display Options
Show Volume Delta
Default: true
Description: Toggles the display of volume delta within each zone. Enabling this provides additional insight into buying vs. selling pressure during low volume periods.
Delta Text Position
Default: Right
Options: Left, Center, Right
Description: Controls the horizontal alignment of the delta text within zones. Adjust based on your chart layout for optimal readability.
✅ Best Use Cases
• Identifying potential support and resistance levels that formed during periods of thin liquidity
• Spotting price inefficiencies where larger players may have moved price with minimal volume
• Finding low-volume consolidation areas that may serve as breakout or reversal zones when revisited
• Locating potential stop-hunting zones where price moved on minimal participation
• Complementing traditional support/resistance analysis with volume context
⚠️ Limitations
• Requires volume data to function; will not work on symbols where the data provider doesn’t supply volume information
• Low volume zones don’t guarantee future support/resistance - they simply highlight potential areas of interest
• Works best on liquid instruments where volume data has meaningful fluctuations
• Historical analysis is limited by the maximum allowed box count (500) in TradingView
• Volume delta in some markets may not perfectly reflect buying vs. selling pressure due to data limitations
💡 What Makes This Unique
• Focus on Low Volume: Unlike some indicators that highlight high volume events particularly like our very own TLZ indicator, this tool specifically identifies potentially significant price zones that formed with minimal participation.
• Delta + Low Volume Integration: Combines volume delta analysis with low volume detection to reveal directional bias during thin liquidity periods.
• Flexible Lookback System: The dynamic timeframe system allows analysis across any timeframe while maintaining consistent zone identification criteria.
• Support/Resistance Zone Generation: Automatically builds a visual map of potential technical levels based on volume behavior rather than just price patterns.
🔬 How It Works
1. Volume Baseline Calculation:
The indicator calculates a moving average of volume over your specified period to establish a baseline for normal market participation. This adaptive baseline accounts for natural volume fluctuations across different market conditions.
2. Low Volume Detection:
Each candle’s volume is compared to the moving average and flagged when it falls below your threshold divisor. The indicator also filters zones by maximum size to ensure only precise price levels are highlighted.
3. Volume Delta Integration:
For each identified low volume candle, the indicator retrieves the volume delta from a lower timeframe. This delta value is formatted with appropriate scaling (K/M) and displayed within the zone.
4. Zone Management:
New zones are created and tracked in a dynamic array, with each zone extending rightward until it expires. The system automatically removes expired zones based on your lookback period to maintain a clean chart.
💡 Note:
Low liquidity zones often represent areas where price moved with minimal participation, which can indicate potential market inefficiencies. These zones frequently become important support/resistance levels when revisited, especially if approached with higher volume. Consider using this indicator alongside traditional technical analysis tools for comprehensive market context. For best results, experiment with different volume threshold settings based on the specific instrument’s typical volume patterns.
Price Imbalance as Consecutive Levels of AveragesOverview
The Price Imbalance as Consecutive Levels of Averages indicator is an advanced technical analysis tool designed to identify and visualize price imbalances in financial markets. Unlike traditional moving average (MA) indicators that update continuously with each new price bar, this indicator employs moving averages calculated over consecutive, non-overlapping historical windows. This unique approach leverages comparative historical data to provide deeper insights into trend strength and potential reversals, offering traders a more nuanced understanding of market dynamics and reducing the likelihood of false signals or fakeouts.
Key Features
Consecutive Rolling Moving Averages: Utilizes three distinct simple moving averages (SMAs) calculated over consecutive, non-overlapping windows to capture different historical segments of price data.
Dynamic Color-Coded Visualization: SMA lines change color and style based on the relationship between the averages, highlighting both extreme and normal market conditions.
Median and Secondary Median Lines: Provides additional layers of price distribution insight during normal trend conditions through the plotting of primary and secondary median lines.
Fakeout Prevention: Filters out short-term volatility and sharp price movements by requiring consistent historical alignment of multiple moving averages.
Customizable Parameters: Offers flexibility to adjust SMA window lengths and line extensions to align with various trading strategies and timeframes.
Real-Time Updates with Historical Context: Continuously recalculates and updates SMA lines based on comparative historical windows, ensuring that the indicator reflects both current and past market conditions.
Inputs & Settings
Rolling Window Lengths:
Window 1 Length (Most Recent) Bars: Number of bars used to calculate the most recent SMA. (Default: 5, Range: 2–300)
Window 2 Length (Preceding) Bars: Number of bars for the second SMA, shifted by Window 1. (Default: 8, Range: 2–300)
Window 3 Length (Third Rolling) Bars: Number of bars for the third SMA, shifted by the combined lengths of Window 1 and Window 2. (Default: 13, Range: 2–300)
Horizontal Line Extension:
Horizontal Line Extension (Bars): Determines how far each SMA line extends horizontally on the chart. (Default: 10 bars, Range: 1–100)
Functionality and Theory
1. Calculating Consecutive Simple Moving Averages (SMAs):
The indicator calculates three SMAs, each based on distinct and consecutive historical windows of price data. This approach contrasts with traditional MAs that continuously update with each new price bar, offering a static view of past trends rather than an ongoing one.
Mean1 (SMA1): Calculated over the most recent Window 1 Length bars. Represents the short-term trend.
Mean1=∑i=1N1CloseiN1
Mean1=N1∑i=1N1Closei
Where N1N1 is the length of Window 1.
Mean2 (SMA2): Calculated over the preceding Window 2 Length bars, shifted back by Window 1 Length bars. Represents the medium-term trend.
\text{Mean2} = \frac{\sum_{i=1}^{N_2} \text{Close}_{i + N_1}}}{N_2}
Where N2N2 is the length of Window 2.
Mean3 (SMA3): Calculated over the third rolling Window 3 Length bars, shifted back by the combined lengths of Window 1 and Window 2 bars. Represents the long-term trend.
\text{Mean3} = \frac{\sum_{i=1}^{N_3} \text{Close}_{i + N_1 + N_2}}}{N_3}
Where N3N3 is the length of Window 3.
2. Determining Market Conditions:
The relationship between the three SMAs categorizes the market condition into either extreme or normal states, enabling traders to quickly assess trend strength and potential reversals.
Extreme Bullish:
Mean3Mean2>Mean1
Mean3>Mean2>Mean1
Indicates a strong and sustained downward trend. SMA lines are colored purple and styled as dashed lines.
Normal Bullish:
Mean1>Mean2andnot in extreme bullish condition
Indicates a standard upward trend. SMA lines are colored green and styled as solid lines.
Normal Bearish:
Mean1Mean2>Mean1
Mean3>Mean2>Mean1
Normal Bullish:
Mean1>Mean2andnot in Extreme Bullish
Normal Bearish:
Mean1 Mean2 > Mean3
Visualization: All three SMAs are displayed as gold dashed lines.
Median Lines: Not displayed to maintain chart clarity.
Interpretation: Indicates a strong and sustained upward trend. Traders may consider entering long positions, confident in the trend's strength without the distraction of additional lines.
2. Normal Bullish Condition:
SMAs Alignment: Mean1 > Mean2 (not in extreme condition)
Visualization: Mean1 and Mean2 are green solid lines; Mean3 is gray.
Median Lines: A thin blue dotted median line is plotted between Mean1 and Mean2, with two additional thin blue dashed lines as secondary medians.
Interpretation: Confirms an upward trend while providing deeper insights into price distribution. Traders can use the median and secondary median lines to identify optimal entry points and manage risk more effectively.
3. Extreme Bearish Condition:
SMAs Alignment: Mean3 > Mean2 > Mean1
Visualization: All three SMAs are displayed as purple dashed lines.
Median Lines: Not displayed to maintain chart clarity.
Interpretation: Indicates a strong and sustained downward trend. Traders may consider entering short positions, confident in the trend's strength without the distraction of additional lines.
4. Normal Bearish Condition:
SMAs Alignment: Mean1 < Mean2 (not in extreme condition)
Visualization: Mean1 and Mean2 are red solid lines; Mean3 is gray.
Median Lines: A thin blue dotted median line is plotted between Mean1 and Mean2, with two additional thin blue dashed lines as secondary medians.
Interpretation: Confirms a downward trend while providing deeper insights into price distribution. Traders can use the median and secondary median lines to identify optimal entry points and manage risk more effectively.
Customization and Flexibility
The Price Imbalance as Consecutive Levels of Averages indicator is highly adaptable, allowing traders to tailor it to their specific trading styles and market conditions through adjustable parameters:
SMA Window Lengths: Modify the lengths of Window 1, Window 2, and Window 3 to capture different historical trend segments, whether focusing on short-term fluctuations or long-term movements.
Line Extension: Adjust the horizontal extension of SMA and median lines to align with different trading horizons and chart preferences.
Color and Style Preferences: While default colors and styles are optimized for clarity, traders can customize these elements to match their personal chart aesthetics and enhance visual differentiation.
This flexibility ensures that the indicator remains versatile and applicable across various markets, asset classes, and trading strategies, providing valuable insights tailored to individual trading needs.
Conclusion
The Price Imbalance as Consecutive Levels of Averages indicator offers a comprehensive and innovative approach to analyzing price trends and imbalances within financial markets. By utilizing three consecutive, non-overlapping SMAs and incorporating median lines during normal trend conditions, the indicator provides clear and actionable insights into trend strength and price distribution. Its unique design leverages comparative historical data, distinguishing it from traditional moving averages and enhancing its utility in identifying genuine market movements while minimizing false signals. This dynamic and customizable tool empowers traders to refine their technical analysis, optimize their trading strategies, and navigate the markets with greater confidence and precision.
Real-Time HTF Volume Footprint [BigBeluga]Real-time HTF Volume Footprint Profile is designed to provide a comprehensive view of higher timeframe volume profiles on your current chart. It overlays critical volume information from larger timeframes (like daily, weekly, or monthly) onto lower timeframe charts, helping you spot significant levels where volume is concentrated, acting as potential support or resistance.
🔵 Key Features:
HTF High and Low Zones: The indicator highlights the high and low of the chosen higher timeframe with clear zones, marking them with boxes. These zones help you see the broader market structure at a glance.
Volume Profile within HTF Range: Each higher timeframe range displays a volume profile, showing the distribution of volume at each price level. The most-traded price is highlighted in blue, known as the Point of Control (POC), indicating the price level with the highest activity.
Dynamic POC Option: Activate Dynamic POC to observe how the Point of Control shifts over time, giving insight into changing market interests and potential price direction.
Timeframe Flexibility: Select from daily, weekly, and monthly ranges (and more) to overlay their footprint profiles on your lower timeframe chart. This helps you tailor the indicator to the trading horizon that suits your strategy.
Info Table: Table shows a traders which timeframe is selected with last high and low of the selected timeframe
Visual Clarity with Custom Colors: The indicator uses subtle fills and distinct colors to ensure volume profile data integrates seamlessly into your chart without overwhelming other indicators or price data.
🔵 When to Use:
The HTF Volume Footprint Profile is essential for traders who want to bridge the gap between high-timeframe and intraday analysis. By visualizing HTF volume distribution on lower timeframes, this tool helps you:
Spot potential liquidity zones where price might react.
Identify support and resistance levels within HTF ranges.
Monitor PoC shifts that indicate changes in market behavior.
Track how current price aligns with significant volume clusters, providing a clear edge for volume-based strategies.
This indicator empowers traders to analyze lower timeframes with the context of higher timeframe volume profiles, providing a solid basis for identifying critical support and resistance levels shaped by large volume clusters. Whether you’re looking to spot liquidity zones or align your trades with broader market trends, HTF Volume Footprint Profile equips you with a strategic view.
Historical High/Lows Statistical Analysis(More Timeframe interval options coming in the future)
Indicator Description
The Hourly and Weekly High/Low (H/L) Analysis indicator provides a powerful tool for tracking the most frequent high and low points during different periods, specifically on an hourly basis and a weekly basis, broken down by the days of the week (DOTW). This indicator is particularly useful for traders seeking to understand historical behavior and patterns of high/low occurrences across both hourly intervals and weekly days, helping them make more informed decisions based on historical data.
With its customizable options, this indicator is versatile and applicable to a variety of trading strategies, ranging from intraday to swing trading. It is designed to meet the needs of both novice and experienced traders.
Key Features
Hourly High/Low Analysis:
Tracks and displays the frequency of hourly high and low occurrences across a user-defined date range.
Enables traders to identify which hours of the day are historically more likely to set highs or lows, offering valuable insights into intraday price action.
Customizable options for:
Hourly session start and end times.
22-hour session support for futures traders.
Hourly label formatting (e.g., 12-hour or 24-hour format).
Table position, size, and design flexibility.
Weekly High/Low Analysis by Day of the Week (DOTW):
Captures weekly high and low occurrences for each day of the week.
Allows traders to evaluate which days are most likely to produce highs or lows during the week, providing insights into weekly price movement tendencies.
Displays the aggregated counts of highs and lows for each day in a clean, customizable table format.
Options for hiding specific days (e.g., weekends) and customizing table appearance.
User-Friendly Table Display:
Both hourly and weekly data are displayed in separate tables, ensuring clarity and non-interference.
Tables can be positioned on the chart according to user preferences and are designed to be visually appealing yet highly informative.
Customizable Date Range:
Users can specify a start and end date for the analysis, allowing them to focus on specific periods of interest.
Possible Uses
Intraday Traders (Hourly Analysis):
Analyze hourly price action to determine which hours are more likely to produce highs or lows.
Identify intraday trading opportunities during statistically significant time intervals.
Use hourly insights to time entries and exits more effectively.
Swing Traders (Weekly DOTW Analysis):
Evaluate weekly price patterns by identifying which days of the week are more likely to set highs or lows.
Plan trades around days that historically exhibit strong movements or price reversals.
Futures and Forex Traders:
Use the 22-hour session feature to exclude the CME break or other session-specific gaps from analysis.
Combine hourly and DOTW insights to optimize strategies for continuous markets.
Data-Driven Trading Strategies:
Use historical high/low data to test and refine trading strategies.
Quantify market tendencies and evaluate whether observed patterns align with your strategy's assumptions.
How the Indicator Works
Hourly H/L Analysis:
The indicator calculates the highest and lowest prices for each hour in the specified date range.
Each hourly high and low occurrence is recorded and aggregated into a table, with counts displayed for all 24 hours.
Users can toggle the visibility of empty cells (hours with no high/low occurrences) and adjust the table's design to suit their preferences.
Supports both 12-hour (AM/PM) and 24-hour formats.
Weekly H/L DOTW Analysis:
The indicator tracks the highest and lowest prices for each day of the week during the user-specified date range.
Highs and lows are identified for the entire week, and the specific days when they occur are recorded.
Counts for each day are aggregated and displayed in a table, with a "Totals" column summarizing the overall occurrences.
The analysis resets weekly, ensuring accurate tracking of high/low days.
Code Breakdown:
Data Aggregation:
The script uses arrays to store counts of high/low occurrences for both hourly and weekly intervals.
Daily data is fetched using the request.security() function, ensuring consistent results regardless of the chart's timeframe.
Weekly Reset Mechanism:
Weekly high/low values are reset at the start of a new week (Monday) to ensure accurate weekly tracking.
A processing flag ensures that weekly data is counted only once at the end of the week (Sunday).
Table Visualization:
Tables are created using the table.new() function, with customizable styles and positions.
Header rows, data rows, and totals are dynamically populated based on the aggregated data.
User Inputs:
Customization options include text colors, background colors, table positioning, label formatting, and date ranges.
Code Explanation
The script is structured into two main sections:
Hourly H/L Analysis:
This section captures and aggregates high/low occurrences for each hour of the day.
The logic is session-aware, allowing users to define custom session times (e.g., 22-hour futures sessions).
Data is displayed in a clean table format with hourly labels.
Weekly H/L DOTW Analysis:
This section tracks weekly highs and lows by day of the week.
Highs and lows are identified for each week, and counts are updated only once per week to prevent duplication.
A user-friendly table displays the counts for each day of the week, along with totals.
Both sections are completely independent of each other to avoid interference. This ensures that enabling or disabling one section does not impact the functionality of the other.
Customization Options
For Hourly Analysis:
Toggle hourly table visibility.
Choose session start and end times.
Select hourly label format (12-hour or 24-hour).
Customize table appearance (colors, position, text size).
For Weekly DOTW Analysis:
Toggle DOTW table visibility.
Choose which days to include (e.g., hide weekends).
Customize table appearance (colors, position, text size).
Select values format (percentages or occurrences).
Conclusion
The Hourly and Weekly H/L Analysis indicator is a versatile tool designed to empower traders with data-driven insights into intraday and weekly market tendencies. Its highly customizable design ensures compatibility with various trading styles and instruments, making it an essential addition to any trader's toolkit.
With its focus on accuracy, clarity, and customization, this indicator adheres to TradingView's guidelines, ensuring a robust and valuable user experience.
TASC 2023.09 The Weekly Factor█ OVERVIEW
TASC's September 2023 edition of Traders' Tips features an article written by Andrea Unger titled “The Weekly Factor", discussing the application of price patterns as filters for trade entries. This script implements a sample trading strategy presented in the article for demonstration purposes only. It explores how the strategy's equity curve might benefit from filtering trade entries using a specific price pattern.
█ CONCEPTS
Pattern filters represent valuable tools that assess current market conditions based on price movements and determine when those conditions become more favorable for trade entries.
The filter used and tested in this article is a metric called the "weekly factor", which measures the price range over the last five trading days and compares it to the open of the session five days ago and the close of the session one day ago (i.e., the "body" of the five-day period). When the five-day body is small compared to the five-day range, this could indicate "indecision" or "compression", potentially followed by a price expansion. Thus, the weekly factor metric can help identify areas in the market where a period of compression might signal a potential breakout.
This script demonstrates the use of the weekly factor for a sample intraday trading strategy (intended for educational and exploratory purposes only). In this strategy, the entry signal is triggered when a 15-minute bar breaks out of the previous day's high-low range, and the position is closed at the end of the day.
█ CALCULATIONS
The script uses two timeframes:
• The strategy entries are processed on the 15-minute timeframe.
• The weekly factor is obtained from the daily timeframe using the request.security function and the following formula:
math.abs(open - close ) < RangeFilter * (ta.highest(5) - ta.lowest(5) )
Here, RangeFilter is an input that can be optimized to find the favorable ratio between the five-day body and the five-day range. Smaller RangeFilter values will lead to fewer trade entries. A RangeFilter value of 1 is equivalent to turning off the filtering altogether.
Weekly Open (Current Week Only)📘 Indicator Name: Weekly Open (Current Week Only)
📝 Description:
This indicator plots a horizontal line representing the weekly open price, visible only during the current trading week. At the beginning of each new week (based on TradingView’s weekly time segmentation), the indicator captures the open price of the first candle and draws a constant line across the chart until the week ends. Once the new week begins, the line resets and updates with the new weekly open.
🎯 How to Use – ICT Concepts Integration (Weekly Profile):
This tool is designed to complement ICT (Inner Circle Trader) trading strategies, particularly within the weekly profile framework, by offering a clear and persistent visual of the weekly open, which is a critical reference point in ICT’s market structure theory.
✅ Use Cases:
Directional Bias:
According to ICT concepts, price trading above the weekly open suggests a bullish bias for the week, while trading below it implies bearish conditions.
Traders can use the weekly open line to align their intraweek trades with higher timeframe directional bias.
Dealing Ranges:
Weekly open helps frame the weekly dealing range, especially when combined with other levels like weekly high/low or previous week’s range.
It allows traders to identify potential liquidity pools or areas where price may seek to rebalance.
Mean Reversion Entries:
Price often reverts to or reacts from the weekly open. Traders may use this as a target or entry level, particularly during Monday/Tuesday setups.
Works well in conjunction with concepts like OTE (Optimal Trade Entry) and Judas Swings.
Risk Management:
Acts as a clean and visual anchor to structure stop losses or take-profits based on weekly bias shifts.
Enhanced Volume Profile█ OVERVIEW
The Enhanced Volume Profile (EVP) is an indicator designed to plot a volume profile on the chart based on either the visible chart range or a fixed lookback period. The script helps analyze the distribution of volume at different price levels over time, providing insights into areas of high trading activity and potential support/resistance zones.
█ KEY FEATURES
1. Visible Chart Range vs. Fixed Lookback Depth
Visible Chart Range
- Default analysis mode
- Calculates profile based on visible portion of the chart
- Dynamically updates with chart view changes
Fixed Lookback Depth
- Optional alternative to visible range
- Uses specified number of bars (10-3000)
- Provides consistent analysis depth
- Independent of chart view
2. Custom Resolution
Auto-Resolution Mode
Automatically selects timeframes based on chart's current timeframe:
≤ 1 minute: Uses 1-minute resolution
≤ 5 minutes: Uses 1-minute resolution
≤ 15 minutes: Uses 5-minute resolution
≤ 1 hour: Uses 5-minute resolution
≤ 4 hours: Uses 15-minute resolution
≤ 12 hours: Uses 15-minute resolution
≤ 1 day: Uses 1-hour resolution
≤ 3 days: Uses 2-hours resolution
≤ 1 week: Uses 4-hours resolution
Custom Resolution Override
Optional override of auto-resolution system
Provides control over data granularity
Must be lower than or equal to chart's timeframe
Falls back to auto-resolution if validation fails
3. Volume Profile Resolution
Adjustable number of points (10-400)
Controls profile granularity
Higher resolution provides more detail
Balance between precision and performance
4. Point of Control (PoC)
Identifies price level with highest traded volume
Optional display with customizable appearance
Adjustable line thickness (1-30)
Configurable color
5. Value Area (VA)
Shows price range of majority trading volume
Adjustable coverage (5-95%), default is 68%
Customizable boundary lines
Configurable lines color and thickness (1-20)
█ INPUT PARAMETERS
Lookback Settings
Use Visible Chart Range
- Default: true
- Calculates profile based on visible bars
- Ideal for focused analysis
Fixed Lookback Bars
- Range: 10-3000
- Default: 200
- Used when visible range is disabled
Resolution Settings
Enable Custom Resolution
- Default: false
- Overrides auto-resolution
Custom Resolution
- Default: 1-minute
- Changes automatically when "Enable Custom Resolution" is disabled
Volume Profile Appearance
Profile Resolution
- Range: 10-400
- Default: 200
- Controls detail level
Profile Width Scale
- Range: 1-50
- Default: 15
- Adjusts profile width
Right Offset
- Range: 0-500
- Default: 20
- Controls spacing from price bars
Profile Fill Color
- Default: #5D606B (70% transparency)
Point of Control Settings
Show Point of Control
- Default: true
- Toggles PoC visibility
PoC Line Thickness
- Range: 1-30
- Default: 1
PoC Line Color
- Default: Red
Value Area Settings
Show Value Area
- Default: true
- Toggles VA lines
Value Area Coverage
- Range: 5-95%
- Default: 68%
Value Area Line Color
- Default: Blue
Value Area Line Thickness
- Range: 1-20
- Default: 1
█ TECHNICAL IMPLEMENTATION DETAILS
Exceeding Bars Management
The script dynamically adjusts the number of bars used in the volume profile calculation based on the selected timeframe and the maximum allowed bars (max_bars_back).
If the total number of bars exceeds the predefined threshold (6000 bars), the script reduces the lookback period (lookback_bars) by trimming some of the historical data, ensuring the chart does not become overloaded with data.
The adjustment is made based on the ratio of bars per candle (bars_per_candle), ensuring that the volume profile remains computationally efficient while maintaining its relevance.
█ EXAMPLE USE CASES
1. Visible Range Mode
For analyzing a recent trend and focusing on only the visible part of the chart, enabling the "Use Visible Chart Range" option calculates the profile based on the current view, without considering historical data outside the visible area.
2. Fixed Lookback Depth
For analyzing a specific period in the past (e.g., the last 200 bars), disabling the visible range and setting a fixed lookback depth of 200 bars ensures the profile always considers the last 200 bars, regardless of the visible range.
3. Custom Resolution
If there’s a need for greater control over the timeframe used for volume profile calculations (e.g., using a 5-minute resolution on a 15-minute chart), enabling custom resolution and setting the desired timeframe provides this control.
HAPPY TRADING ✌️
FT SessionsFT Sessions
Overview
The FT Sessions is a highly customizable and powerful indicator designed for intraday traders who focus on session-based analysis. This script visually highlights global market sessions—Asia, Frankfurt, London, and New York (AM & PM)—on the chart, making it easier to track session ranges and analyze intraday price movements.
Key Features
Customizable Session Times and Colors:
Define your own session times and assign unique colors for better visibility.
Session Range Visualization:
Displays high and low ranges for each session.
Optional transparent range areas with outlines for clarity.
Configurable session range labels for enhanced readability.
Flexible Timezone Settings:
Choose a UTC offset or sync with the exchange's timezone.
User-Friendly Customization:
Compact settings for easier adjustments.
Enable or disable specific sessions to focus on relevant market activity.
How This Script Differs from LuxAlgo
This script draws inspiration from LuxAlgo's session tracking concept but has been developed with significant modifications and unique features:
Built from Scratch in Pine Script v5:
Fully optimized for Pine Script’s latest version, improving performance and functionality.
Expanded Session Range Features:
Five unique sessions (Asia, Frankfurt, London, New York AM, New York PM) with customizable ranges, colors, and labels.
Real-time updating of session ranges for improved intraday analysis.
4H Timeframe Optimization:
Automatically notifies users if applied to an unsupported timeframe, ensuring session accuracy.
Highly Configurable Input Options:
Advanced timezone handling and compact session management settings.
Unique Coding Structure:
Designed to maximize efficiency and minimize resource usage on TradingView.
While LuxAlgo focuses on session concepts, this script brings a fresh, customizable approach specifically tailored for intraday traders seeking precision in tracking session activity.
How It Works
The indicator tracks price movements within each session.
Highlights the high and low range of each session directly on the chart.
Updates session ranges in real-time to reflect evolving market conditions.
Practical Applications
Intraday Trading: Plan trades based on major market session ranges.
Breakout Strategies: Use session high and low levels to identify potential breakouts.
Session-Specific Patterns: Spot consolidations and reversals within session activity.
Important Notes
Optimized for the 4H timeframe. If applied to another timeframe, a notification will appear.
Best used in combination with other tools (e.g., volume or trend indicators) for a complete trading strategy.
Credits
This script draws inspiration from LuxAlgo's open-source session-tracking methodology. However, it introduces substantial improvements and unique features that set it apart. Full credit is given to LuxAlgo for their original open-source concept.
Disclaimer
This script is for informational and educational purposes only. Always test on a demo account before applying to live markets.
Custom ATR with Paranormal Bar FilterCustom ATR with Paranormal Bar Filter
Description:
This indicator calculates a custom ATR (Average True Range) by filtering out bars with unusually large or small price ranges. It helps provide a more accurate measure of market volatility by ignoring outliers.
How it works:
True Range Calculation:
The price range for each bar is calculated.
Bars with ranges much larger or smaller than typical are excluded.
Filtered ATR:
The ATR is calculated using only the bars that pass the filter.
Current Bar Progress:
Measures how much the current bar has moved compared to the filtered ATR, based on the difference between its opening and closing prices.
Display:
A line represents the filtered ATR.
A table shows the filtered ATR, the current bar's range, and its progress relative to the ATR.
Input Settings:
ATR Period: Number of bars used to calculate the ATR.
Filter Window: Number of recent bars used to determine the typical range.
Filter Threshold: Sensitivity of the filter. A higher value allows more bars to pass.
How to Use:
Monitor Volatility:
Use the filtered ATR to understand market volatility while ignoring unusual price movements.
Track Current Bar Progress:
See how much of the ATR the current bar has completed.
Adjust Filter Settings:
Fine-tune the filter to match your trading timeframe and strategy.
This indicator is designed for traders who want to track market volatility without being misled by extreme outlier bars.
RSI 30-50-70 moving averageDescription:
The RSI 30-50-70 Moving Average indicator plots three distinct moving averages based on different RSI ranges (30%, 50%, and 70%). Each moving average corresponds to different market conditions and provides potential entry and exit signals. Here's how it works:
• RSI_30 Range (25%-35%): The moving average of closing prices when the RSI is between 25% and 35%, representing potential oversold conditions.
• RSI_50 Range (45%-55%): The moving average of closing prices when the RSI is between 45% and 55%, providing a balanced perspective for trend-following strategies.
• RSI_70 Range (65%-75%): The moving average of closing prices when the RSI is between 65% and 75%, representing potential overbought conditions.
This indicator offers flexibility, as users can adjust key parameters such as RSI ranges, periods, and time frames to fine-tune the signals for their trading strategies.
How it Works:
Like traditional moving averages, the RSI 30-50-70 Moving Averages can highlight dynamic levels of support and resistance. They offer additional insight by focusing on specific RSI ranges, providing early signals for trend reversals or continuation. The default settings can be used across various assets but should be optimized via backtesting.
Default Settings:
• RSI_30: 25% to 35% (Oversold Zone, yellow line)
• RSI_50: 45% to 55% (Neutral/Trend Zone, green line)
• RSI_70: 65% to 75% (Overbought Zone, red line)
• RSI Period: 14
Buy Conditions:
• Use the 5- or 15-minute time frame.
• Wait for the price to move below the RSI_30 line, indicating potential oversold conditions.
• Enter a buy order when the price closes above the RSI_30 line, signaling a recovery from the oversold zone.
• For a more conservative approach, use the RSI_50 line as the buy signal to confirm a trend reversal.
• Important: Before entering, ensure that the RSI_30 moving average has flattened or started to level off, signaling that the oversold momentum has slowed.
Sell Conditions:
• Use the 5- or 15-minute time frame.
• Wait for the price to close above the RSI_70 line, indicating potential overbought conditions.
• Enter a sell order when the price closes below the RSI_70 line, signaling a decline from the overbought zone.
• Important: Similar to buying, wait for the RSI_70 moving average to flatten or level off before selling, indicating the overbought conditions are stalling.
Key Features:
1. Dynamic Range Customization: The indicator allows users to modify the RSI ranges and periods, tailoring the moving averages to fit different market conditions or asset classes.
2. Trend-Following and Reversal Signals: The RSI 30-50-70 moving averages provide both reversal and trend-following signals, making it a versatile tool for short-term traders.
3. Visual Representation of Market Strength: By plotting moving averages based on RSI levels, traders can visually interpret the market’s strength and potential turning points.
4. Risk Management: The built-in flexibility allows traders to choose lower-risk entries by adjusting which RSI level (e.g., RSI_30 vs. RSI_50) they rely on for signals.
Practical Use:
Different assets respond uniquely to RSI-based moving averages, so it's recommended to backtest and adjust ranges for specific instruments. For example, volatile assets may require wider RSI ranges, while more stable assets could benefit from tighter ranges.
Checking for Buy conditions:
1st: Wait for current price to go below the RSI_30 (yellow line)
2nd: Wait and observe for bullish divergence
3rd: RSI_30 has flattened indicating potential gain of momentum after a bullish divergence.
4th: Enter a buy order when the price closed above the RSI_30, preferably when a green candle appeared.
ICT Market Structure Screener (Zeiierman)█ Overview
The ICT Market Structure Screener (Zeiierman) is designed to identify and display key market structure levels and patterns based on Smart Money Concepts. It highlights bullish and bearish structures, premium and discount levels, and generates alerts for significant market structure changes, making it a valuable tool for traders looking to understand institutional trading behaviors and market trends. A key feature of this indicator is its screener function, which allows traders to monitor multiple symbols simultaneously. This feature provides a consolidated view of the market structure for various assets, making it easier to identify trading opportunities across a diverse portfolio.
█ How It Works
The ICT Market Structure Screener operates by identifying high and low pivot points within a specified period, then analyzing these pivots to determine changes in market structure. The indicator tracks price movements and categorizes them into bullish or bearish structures, indicating potential trend reversals or continuations. By plotting premium and discount levels, it helps traders identify overbought and oversold conditions. The indicator also provides real-time updates and alerts for significant changes in the market structure.
█ Terminology
ChoCH (Change of Character): Indicates a potential reversal in market direction. It is identified when the price breaks a significant high or low, suggesting a shift from a bullish to bearish trend or vice versa.
SMS (Smart Money Shift): Represents the transition phase in market structure where smart money begins accumulating or distributing assets. It typically follows a BMS and indicates the start of a new trend.
BMS (Bullish/Bearish Market Structure): Confirms the trend direction. Bullish Market Structure (BMS) confirms an uptrend, while Bearish Market Structure (BMS) confirms a downtrend. It is characterized by a series of higher highs and higher lows (bullish) or lower highs and lower lows (bearish).
Premium: A zone where the price is considered overbought. It is calculated as the upper range of the current market structure and indicates a potential area for selling or shorting.
Mid Range: The midpoint between the high and low of the market structure. It often acts as a support or resistance level, helping traders identify potential reversal or continuation points.
Discount: A zone where the price is considered oversold. It is calculated as the lower range of the current market structure and indicates a potential area for buying or going long.
█ How to Use
The ICT Market Structure Screener allows traders to follow smart money moves in the market more effectively. By identifying key market levels and monitoring bullish and bearish structures, traders can easily spot trend changes and strong trends. The indicator's premium and discount levels help identify overbought and oversold conditions, providing valuable entry and exit points. Alerts for ChoCH, SMS, and BMS keep traders informed about significant market changes, enabling real-time adjustments to trading strategies.
The screener functionality is particularly valuable for monitoring multiple markets simultaneously. The screener table displays critical information such as current price, trend direction, signal type, and premium/discount levels for each symbol. This makes it easier to track the market structure of various assets at a glance and quickly identify trading opportunities across different markets.
Example Strategies:
⚪ Trend Following: Use the indicator to identify the current market trend (bullish or bearish) and trade in the direction of the trend. Enter trades on pullbacks to premium (for shorts) or discount (for longs) levels.
⚪ Reversal Trading: Look for ChoCH signals to identify potential trend reversals. Enter trades when the price breaks a significant high or low and confirms a change in market structure, or wait for a retest of the nearest Orderblock that was formed.
⚪ Support and Resistance: Utilize the mid-range, premium, and discount levels as support and resistance zones. Enter trades when the price approaches these levels and shows signs of reversal or continuation.
⚪ Multi-Symbol Analysis: Use the screener table to monitor multiple symbols and quickly assess their market structure. This helps in diversifying trading opportunities and managing a portfolio of assets efficiently.
█ Settings
Period: The pivot period for calculating the structure. Increasing the period captures broader trends, making the structure more representative of long-term movements. Decreasing the period focuses on shorter-term trends, increasing sensitivity.
Response: Enabling this option uses the response period instead of the pivot period, providing more flexibility in capturing short-term or long-term structures. The period for the response, which determines the structure's sensitivity. Increasing the response period smoothens the structure, making it less reactive to short-term fluctuations. Decreasing the response period makes the structure more responsive to short-term changes.
Structure Display: Choose between displaying the active range or the previous range. 'Active Range' shows real-time premium, discount, and mid-range levels based on the current structure. 'Previous Range' displays past ranges, useful for analyzing historical support/resistance levels.
Ticker Symbols: List of symbols to include in the screener. Enabling the option includes the symbol in the screener, allowing the user to track its structure. Disabling it excludes the symbol from the screener, reducing the number of tracked symbols.
-----------------
Disclaimer
The information contained in my Scripts/Indicators/Ideas/Algos/Systems does not constitute financial advice or a solicitation to buy or sell any securities of any type. I will not accept liability for any loss or damage, including without limitation any loss of profit, which may arise directly or indirectly from the use of or reliance on such information.
All investments involve risk, and the past performance of a security, industry, sector, market, financial product, trading strategy, backtest, or individual's trading does not guarantee future results or returns. Investors are fully responsible for any investment decisions they make. Such decisions should be based solely on an evaluation of their financial circumstances, investment objectives, risk tolerance, and liquidity needs.
My Scripts/Indicators/Ideas/Algos/Systems are only for educational purposes!
Stock WatchOverview
Watch list are very common in trading, but most of them simply provide the means of tracking a list of symbols and their current price. Then, you click through the list and perform some additional analysis individually from a chart setup. What this indicator is designed to do is provide a watch list that employs a high/low price range analysis in a table view across multiple time ranges for a much faster analysis of the symbols you are watching.
Discussion
The concept of this Stock Watch indicator is best understood when you think in terms of a 52 Week Range indication on many financial web sites. Taken a given symbol, what is the high and the low over a 52 week range and then determine where current price is within that range from a percentage perspective between 0% and 100%.
With this concept in mind, let's see how this Stock Watch indicator is meant to benefit.
There are four different H/L ranges relative to the chart's setting and a Scope property. Let's use a three month (3M) chart as our example and set the indicator's Scope = 4. A 3M chart provides three months of data in a single candle, now when we set the Scope = 4 we are stating that 1X is going to look over four candles for the high/low range.
The Scope property is used to determine how many candles it is to scan to determine the high/low range for the corresponding 1X, 3X, 5X and 10X periods. This is how different time ranges are put into perspective. Using a 3M chart with Scope = 4 would represent the following time windows:
- 1X = 3M * 4 is a 12 Months or 1 Year High/Low Range
- 3X = 3M * 4 * 3 is a 36 Months or 3 Years High/Low Range
- 5X = 3M * 4 * 5 is a 60 Months or 5 Years High/Low Range
- 10X = 3M * 4 * 10 is a 120 Months or 10 Years High/Low Range.
With these calculations, the indicator then determines where current price is within each of these High/Low ranges from a percentage perspective between 0% and 100%.
Once the 0% to 100% value is calculated, it then will shade the value according to a color gradient from red to green (or any other two colors you set the indictor to). This color shading really helps to interpret current price quickly.
The greater power to this range and color shading comes when you are able to see where price is according to price history across the multiple time windows. In this example, there is quick analysis across 1 Year, 3 Year, 5 Year and 10 Year windows.
Now let's further improve this quick analysis over 15 different stocks for which the indicator allows you to watch up to at any one time.
For value traders this is huge, because we're always looking for the bargains and we wait for price to be in the value range. Using this indicator helps to instantly see if price has entered a value range before we decide to do further analysis with other charting and fundamental tools.
The Code
The heart of all this is really very simple as you can see in the following code snippet. We're simply looking for the highest high and lowest low across the different scopes and calculating the percentage of the range where current price is for each symbol being watched.
scope = baseScope
watch1X = math.round(((watchClose - ta.lowest(watchLow, scope)) / (ta.highest(watchHigh, scope) - ta.lowest(watchLow, scope))) * 100, 0)
table.cell(tblWatch, columnId, 2, str.format("{0, number, #}%", watch1X), text_size = size.small, text_color = colorText, bgcolor = getBackColor(watch1X))
//3X Lookback
scope := baseScope * 3
watch3X = math.round(((watchClose - ta.lowest(watchLow, scope)) / (ta.highest(watchHigh, scope) - ta.lowest(watchLow, scope))) * 100, 0)
table.cell(tblWatch, columnId, 3, str.format("{0, number, #}%", watch3X), text_size = size.small, text_color = colorText, bgcolor = getBackColor(watch3X))
Conclusion
The example I've laid out here are for large time windows, because I'm a long term investor. However, keep in mind that this can work on any chart setting, you just need to remember that your chart's time period and scope work together to determine what 1X, 3X, 5X and 10X represent.
Let me try and give you one last scenario on this. Consider your chart is set for a 60 minute chart, meaning each candle represents 60 minutes of time and you set the Stock Watch indicator to a scope = 4. These settings would now represent the following and you would be watching up to 15 different stocks across these windows at one time.
1X = 60 minutes * 4 is 240 minutes or 4 hours of time.
3X = 60 minutes * 4 * 3 = 720 minutes or 12 hours of time.
5X = 60 minutes * 4 * 5 = 1200 minutes or 20 hours of time.
10X = 60 minutes * 4 * 10 = 2400 minutes or 40 hours of time.
I hope you find value in my contribution to the cause of trading, and if you have any comments or critiques, I would love to here from you in the comments.
ICT Seek & Destroy Profile [TFO]The goal of this indicator is to anticipate potentially "choppy" New York trading sessions, based on what price does during the Asia and London trading sessions. Based on some user-defined success criteria, we can also track how successful these warnings are.
Many Inner Circle Trader (ICT) students have noted that choppy New York sessions are often preceded by erratic London sessions which take both the high and low of the Asian range.
When this criteria is true and warnings are enabled, a table will automatically populate with a custom warning message for the duration of the NY session, indicating to the user that it could be a choppy trading day.
We can measure and track the success rate of these warnings via the following success criteria:
- NY stays within London range
- NY exceeds London high and low
- NY closes within London range
- NY range is too small
The first three criteria should be self explanatory - the NY range either stays within the London high & low, exceeds them both, or closes within them.
The last criteria is a measure of the New York range compared to a user defined standard deviation of all historical ranges (for the number of sessions that the current chart can load). The default value of 1.5 would imply that a "successful" S&D day could be if the NY range (from high to low) was less than or equal to 1.5 standard deviations of all past ranges.
All these options can be toggled on/off as well, for those that only want to consider certain success criteria and not others. When any of the selected success criteria are true, that essentially indicates that the current session's warning was successful.
CPR_Previous Day Ranges_Initial BalanceHello Traders,
This script best works on Indian Index (Tested on BANKNIFTY & NIFTY)
This indicator can be used only for day trading (intraday: ex: 5min, 15min Timeframes) on indices.
This script helps to plot
1. Central Pivot Range(CPR)
2. Previous Day Ranges (PDH & PDL)
3. Initial Balance(IB)
brief description of indicators:
1. CPR: Central Pivot Range --> This indicator helps to identify key price points to set up trades. CPR is beneficial for intraday trading.
2.Previous Day Ranges: These ranges will help to understand the current day market.
PDH: Previous Day High value on current day
PDL: Previous Day Low value on current day
3.Initial Balance(IB):This indicator will help in day trading. IB will plot current day first 1hr high, low & mid values.
Disclaimer: This indicator can be used as refrence only. This has been tested on Banknifty and Nifty indices on day trading 5 minutes and 15 minutes timeframe. Understand yourself to knowledge of different trading methods.