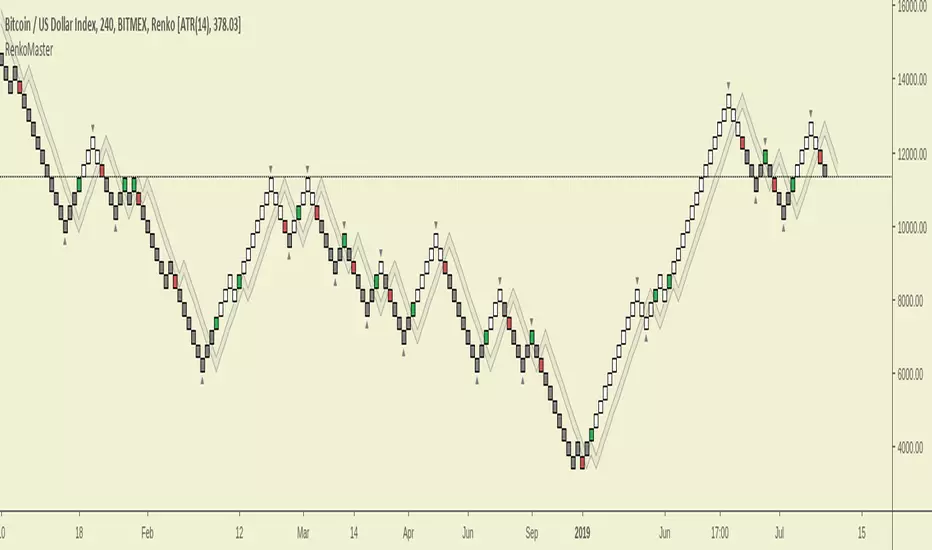
RenkoMasterRenkoMaster is a variant of our popular TrendMaster Script with adjusted parameters. It can be used to provide confluence when determining Renko entries and exits.
Setting Up The Indicator
After purchase, open the TradingView indicator library. Under the Invite-Only Scripts section, you will see RenkoMaster. Add it to your chart. Next, you must customise your theme settings to allow RenkoMaster to take over control of your candle colours. You can find a complete set-up tutorial on our website.
Candle Colours
By default, RenkoMaster will colour your candles in black and white. White candles indicate an uptrend in an asset and the candles will not change colour until the trend has reversed and a counter-trend signal has been printed. Black candles indicate a downtrend, they will remain black until a counter-trend long signal candle has been printed.
Signal candles
A signal candle is printed when the price of an asset closes above or below the moving average cloud and the medium term trend moving average. By requiring two criteria for a single candle to print we will see a drastic reduction in the number of false signals.
The RenkoMaster entry technique further reduces the likelihood of false entries. To enter a trade we do not buy the signal block immediately. Instead, we treat the signal block as an indication that a trend change is possible. We want to see confirmation of this trend before making an entry. To enter we place a pending order a few ticks above or below the high or low of the signal block. By doing this we only enter a trade when the asset has shown a continuation in the direction of the suggested trend change.
Our Story
Founded in 2018 by IchimokuScholar and C00kie, TrendMaster is a team that produces technical analysis indicators with an emphasis on simplicity and noise reduction. We support a large community with educational content, automated market scanners and mentoring in our private chat rooms. We produce technical analysis indicators geared primarily towards the emerging Cryptocurrency asset class. We provide educational material to assist trader development and host a large online trend following community. All of our products are designed to help traders distinguish relevant information from background noise. Our indicators encourage disciplined trade management to maximise the opportunity captured while minimising losses.
IchimokuScholar
IchimokuScholar – In 2017 I retired from a career in higher education to focus on Trading. I like to trade long term trends, focusing primarily on continuation setups. I am dedicated to sharing my knowledge of trading and take great pleasure in simplifying technical analysis for newer traders.
C00kie
I started trading crypto in 2017 and immediately started coding a bunch of tools to improve my quality of life. Some definitely worked out better than others. Like to trade the higher timeframes and drawing horizontal lines on charts. I am also pretty much obligated to like cookies.
Cari dalam skrip untuk "renko"
Renko CandlesticksRenko charts are awesome . They reduce noise by only painting a brick on the chart when price moves by a specified amount up/down. When the price reverses, it must go twice the specified amount before a brick is painted. Time is not a factor, just price movement. Sometimes however, you want the pros of a renko chart, but on a regular candlestick chart. This indicator attempts to do just that.
A band is placed around price action showing the upper and lower bounds of what would be the current renko brick. The band only goes up/down when the price action itself moves up/down by the amount you specify. There are several ways of specifying the amount:
Fixed Price Amount: As the name says, you enter the brick size amount, i.e. the amount the price has to move before being in a new brick.
% of Price: This method will calculate the amount the price has to move as a percentage of the price itself. This way as price goes up/down, your brick size will adjust accordingly. Recommended values would be around 1% or less.
% of ATR: This option will make the brick size a percentage of the Average True Range. You can specify the ATR time frame to be different from your current time frame as well as the ATR length. For instance you could be on a 10 minute chart but specify the ATR to be daily with a length of 3 and a percentage amount of 15. This would make your brick size 15% of the Average True Range for the last 3 days. Recommended values are 10 to 20%.
Use this indicator on any time frame, even the 1 minute as the renko bands span the price action the same way on any time frame easily letting you know whether or not the price has moved appreciably, regardless of how much time has passed.
You can also set alerts easily, simply set the alert to crossing and choose “Renko Candlesticks” instead of “Value”. You will then see the options for the renko upper and lower bounds.
Tested on Bitcoin with the following values:
Fixed Price Amount: 30 ($30)
% of Price: 0.45 (if Bitcoin is $7000 then the brick size would be $31.50)
% of ATR: 15%, ATR Time Frame: 1D, ATR Length: 3 (3 days)

Renkonator 5000 [IND]Renko scalping indicator based off Vdub Renko SniperVX1 v1. Major addition is requiring confluence of MACD signal for opening position + alerts for entering long/short positions.
Important: use Traditional setting with Renko. Box Size and timeframe are the two most important settings to optimize for.
Suggestions:
Pair Box Size Timeframe
EURCAD 0.0001 240m
BTCUSD 1 240m
ETHUSD 0.1-1.0 240m

[RS]Renko Overlay V0Renko Overlay:
tf: Timeframe to use.
mode: ATR or Traditional .
modeValue: can be whole number for ATR mode (ex:.15) or floating point value for Traditional (ex:.0.12345) .
showOverlay: Display renko bars.
showBarColors: Display Bar Colors.
showMa: display Renko based ma.
MA_length: moving average length.
note: should use with scale series only toggled on, so it doesnt strech.

Renko AccelerationRenko is a very useful charting method for analyzing stock movement. It does a great job of filtering out all the excess noise so that all we're left with is pure price action. But, what about time? Time is a fundamental part of chart analysis and we are only seeing part of the picture. After all, shouldn't we take a very different approach to trading signals from a block that renders in 2 seconds as opposed to a block that renders in 30 minutes?
This indicator provides the best of both worlds, enabling us to correlate the passing of time with price movement and clearly see when squeezes and breakouts occur.
As the indicator turns up to green we can see that volatility is on the move and the market is accelerating (breakout), and as it turns down to red the market is stagnating (squeeze). There is also an alternate 'Precise' view which renders the exact time per block for more granular analysis.

RenkoNow you can plot a "Renko" chart on any timeframe for free! As with my previous algorithm, you can plot the "Linear Break" chart on any timeframe for free!
I again decided to help TradingView programmers and wrote code that converts a standard candles / bars to a "Renko" chart. The built-in renko() and security() functions for constructing a "Renko" chart are working wrong. Do not try to write strategies based on the built-in renko() function! The developers write in the manual: "Please note that you cannot plot Renko bricks from Pine script exactly as they look. You can only get a series of numbers similar to OHLC values for Renko bars and use them in your algorithms". However, it is possible to build a "Renko" chart exactly like the "Renko" chart built into TradingView. Personally, I had enough Pine Script functionality.
For a complete understanding of how such a chart is built, you can read to Steve Nison's book "BEYOND JAPANESE CANDLES" and see the instructions for creating a "Renko" chart:
Rule 1: one white brick (or series) is built when the price rises above the base price by a fixed threshold value or more.
Rule 2: one black brick (or series) is built when the price falls below the base price by a fixed threshold or more.
Rule 3: if the rise or fall of the price is less than the minimum fixed value, then new bricks are not drawn.
Rule 4: if today's closing price is higher than the maximum of the last brick (white or black) by a threshold or more, move to the column to the right and build one or more white bricks of equal height. A new brick begins with the maximum of the previous brick.
Rule 5: if today's closing price is below the minimum of the last brick (white or black) by a threshold or more, move to the column to the right and build one or more black bricks of equal height. A new brick begins with the minimum of the previous brick.
Rule 6: if the price is below the maximum or above the minimum, then new bricks are not drawn on the chart.
So my algorithm can to plot Traditional Renko with a fixed box size. I want to note that such a "Renko" chart is slightly different from the "Renko" chart built into TradingView, because as a base price I use (by default) close of first candle. How the developers of TradingView calculate the base price I don’t know. Personally, I do as written in the book of Steve Neeson.
The algorithm is very complicated and I do not want to explain it in detail. I will explain very briefly. The first part of the get_renko () function — // creating lists — creates two lists that record how many green bricks should be and how many red bricks. The second part of the get_renko () function — // creating open and close series — creates open and close series to plot bricks. So, this is a white box - study it!
As you understand, one green candle can create a condition under which it will be necessary to plot, for example, 10 green bricks. So the smaller the box size you make, the smaller the portion of the chart you will see.
I stuffed all the logic into a wrapper in the form of the get_renko() function, which returns a tuple of OHLC values. And these series with the help of the plotcandle() annotation can be converted to the "Renko" chart. I also want to note that with a large number of candles on the chart, outrages about the buffer size uncertainty are heard from the TradingView blackbox. Because of it, in the annotation study() set the value of the max_bars_back parameter.
In general, use this script (for example, to write strategies)!

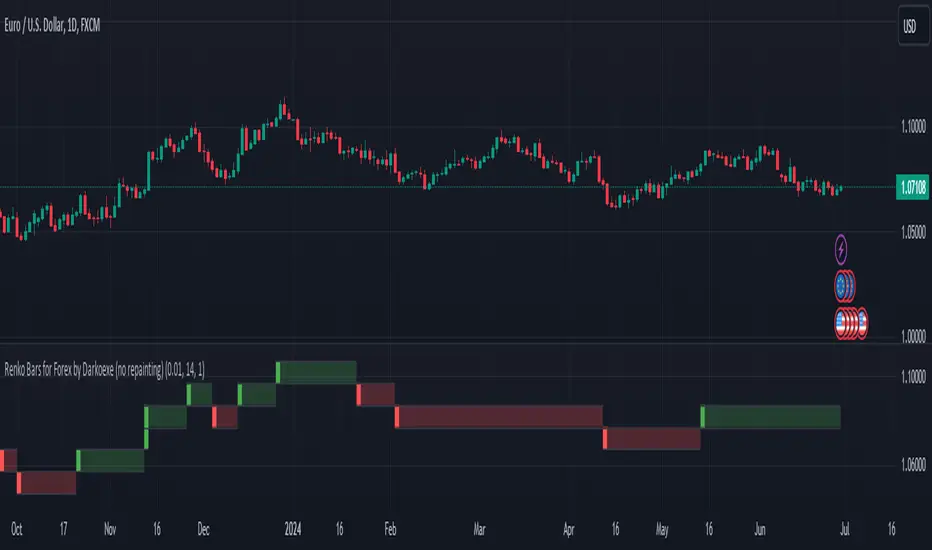
Renko Bars for Forex by Darkoexe (no repainting)This indicator achieves plotting Renko bars with no repainting by resetting the open of the first Renko bar every market open after the FOREX market close. The indicator displays Renko bars for a timeframe chart which means multiple Renko bars can appear in the same timeframe as a single chart candle. This is because Renko bars aren't time bound, they are formed based on price movement. Whenever multiple Renko bars would appear in the timeframe of a single chart candle, the Renko bars will be displayed in a stacked manner meaning the Renko bars will be stacked on top of each other. If the Renko bars stacked are green, the top Renko bar close is the Renko close price of the timeframe. Whenever there's no Renko price movement for a specific candles timeframe, there will be a shadow of the color of the previous Renko bar displayed. These shadows can go on for a while if there's no significant price movement or if the Renko brick size input parameter is set too high.
There's 2 ways to calculate the size of each Renko bar. The first way (the default way) uses a fixed fixed brick size where you can choose the size of each brick. The second way uses a dynamic brick size which just uses the ATR with whatever length you would like to determine the brick size for each Renko bar. The dynamic option also has a factor input which would be multiplied with the calculated ATR to determine the brick size. To use the dynamic option, just check the box in the inputs section labeled "Dynamic Renko Box Size (uses the ATR for renko box size)".
Enjoy!!!
Renko Overlay RibbonThis script has been moved to protected from this location
due to mishandling on multiple trading platforms. Since I have proprietary strategies built on this code, it has caused me to make it protected. This is not an Invite Only script anyone can use it, however the source code is no longer visible.
All calculations are performed against calculated Renko bricks form a price chart. The engine that drives this script is complex, but robust. It attempts to garner the order of nested Renko bricks inside a time candle when multiple bricks are produced. I call these "volatile bricks". In a normal Renko chart where tick data is used, this would be displayed as rapid brick production on the screen.
It is important to choose an appropriate time frame when in Traditional mode. Setting the ribbon to 1 pip on EURUSD using a Day chart is not wise, because there is no way to know just how many 1 pip bricks were produced and in which up/down sequence. ATR mode is different because the bricks are constantly changing in size, adapting to the current ATR of the chart time interval.
Please view these old videos taken from the original page for questions on why this indicator was created in the first place:
My strategy built on this indicator can be found here:
Multiple indicators based on renko bricks on time charts can be found here (they also work on renko charts in Trading View). These are special scripts that use this indicator as the engine to generate indicators "as if" you were operating on a Renko chart.
PM for questions, enjoy.

Renko Bar ChangeI realized it's not in the TV Library so I think it's mandatory to add.
If you wish to access and use for yourself contact me - I reply on Average in less than 4 hours on a 60 day period.
---
Renko Bar Change Indicator Documentation:
Renko Parameters:
Set Box Size either via ATR or your own Float-Value after choosing the correct Renko Style-Option.
Both Renko Style Options are self-explanatory.
Alerts and Plots:
1) Green arrow visualizing a green Renko bar after a red Renko bar
2) Red arrow visualizing a red Renko bar after a green Renko bar
3) Alert for green Renko Bar after red Renko Bar
4) Alert for red Renko Bar after green Renko Bar

Renko + CandlesThis indicator has been designed to show you both candle chart and Renko chart in one place.
I think most of you are familiar with candle chart which is working with the time and price movements but Renko chart is based on price differences and is not related to the "time" parameter.
so if you see a Renko brick is appear up(or down) to the previous brick it means that a certain and fixed price movement has been occurred (which mostly calculate by ATR). and also this indicator works in any time frame.
Remember because we want both charts we have time parameter in this indicator, and if the price doesn't move up or down a certain percentage from previous bars, it will plot a renko bar beside the previous one.
you can use this indicator to see if the price moves up or down.
Or you can determine the important support and resistances with much less noises.
it can be used as a confirmation for you to keep your positions or exit.
go ahead and discover it...
If you have any questions, don't hesitate! ask in the comments section below.

Morpheus Renko Chart Overlay by ZekisRenko is very useful in many strategies, but Tradingview does not support original Renko charts, where time is 0 and the single variable is the price action
This script can overlay the normal Candles Chart with Renko bricks and behaves like an original Renko brick formula
This is a simple way of looking at a Renko Chart inside a normal Candles Chart
You need to adjust the value manualy, like in Traditional Renko
If a price goes up by that value, new brick is formed with green color, vice versa for the down side
I filled bricks with red and green for a better view
Added Long and Short signs
Added alerts
(Original script wrote by Richard Santos and modified by Ni6HTH4wK)
Enjoy!
@Zekis

Renko Candles & Trend System [racer8]Brief:
Renko Candles & Trend System (RCTS) allows traders to have a renko chart alongside their main chart.
This is an off-chart version of my previous indicator called "Renko Dots" with an extra component (SMA).
A true masterpiece, I'm very proud of it. I put a lot of work into it 😝
RCTS has 3 parameters:
Renko Method - Traditional or ATR. These are 2 different ways to calculate Renko.
Renko Length - Length controls traditional Renko bar's fixed price range or controls the ATR period.
SMA Length - Simple moving average of all Renko values.
Signals:
Renko can be either green candle (bullish), red candle (bearish), or dots (neutral).
When Renko is above sma, go long.
When Renko is below sma, go short.
Fire icon (🔥) indicates that Renko crossed sma.
You may change this icon to pretty much any icon you like by copying & pasting any emoji/icon off the internet into the emoji parameter.
Here's a link to save you time: getemoji.com
Or here's a quick list of some icons to copy & paste into the emoji parameter:
Smileys 😄️ 😉 🥰 😝 😎
Gestures 👌 ✌️ 🤟 👍 👊 🙏
Animals 🐱 🦊 🐻 🐼 🐮 🐷
Other 😈 👺 🤡 💀 👽 🤖 🎃 ❤️ 💛 💙
***(This is a hand-picked list I made including only my favorites)
What is a Renko chart?
A Renko chart is a special chart that modifies a regular price chart's information about the close price and transforms it into Renko values that are plotted as Renko boxes on a chart. These boxes typically have a fixed range, say 10 pips for example. Or 1 ATR.
For more information on Renko charts : www.investopedia.com
Just for fun, I've included the following features:
- A heart emoji in the short title (💙)
- A heart made out of @s in the script's code
- A nice quote in the script's code
Have fun.
Hit the like button!
Stay safe.
Enjoy and happy halloween guys & girls 😉

Renko Dynamic Index ZonesThe goal of this indicator is to plot the Dynamic Index, Signal, and Histogram values "as if" the chart is a true price action based Renko chart. It can be used on a time series chart or Renko series chart. The Dynamic Index is derived from the raw price action of a time-based chart, where the historic and live price values are clustered into Renko bricks. The Renko brick production algorithm is entirely backed by Renko Overlay Ribbon and thoroughly tested. The Dynamic Index gets its inspiration from the Commodity Channel Index.
The algorithm takes into account rapid brick production within a single time candle and adjusts accordingly. The output may vary slightly between different chart time frames for the same indicator settings, but this is due to the lack of price fluctuation visibility that can occur in higher chart time frames. If the brick tick size is low, an appropriate chart interval should be selected that maximizes the amount of price volatility visible to the indicator. A bad setting would be something like a 1 tick EURUSD Renko setting on an H4 or Day chart, there simply is no way to derive the exact and ordered price fluctuations in a single candle, 1 pip at a time. A more appropriate chart time frame would be 1-5 minutes for this selected Renko brick size.
The difference between this indicator and the companion Renko Dynamic Index oscillator can be understood in the following video. The indicator plots the current Dynamic Index - Signal cross and Dynamic Index - Zero cross thresholds on the chart so that you know exactly where the most important crossing values are at all times. These can be used as a dynamic stop or a dynamic entry location for trades. The overbought and oversold dynamic zones are also plotted on the chart.
If you are interested in the RSI-RENKO DIVINE™ Strategy please have a look here:
Contact me in Trading View or telegram for more information and access instructions.

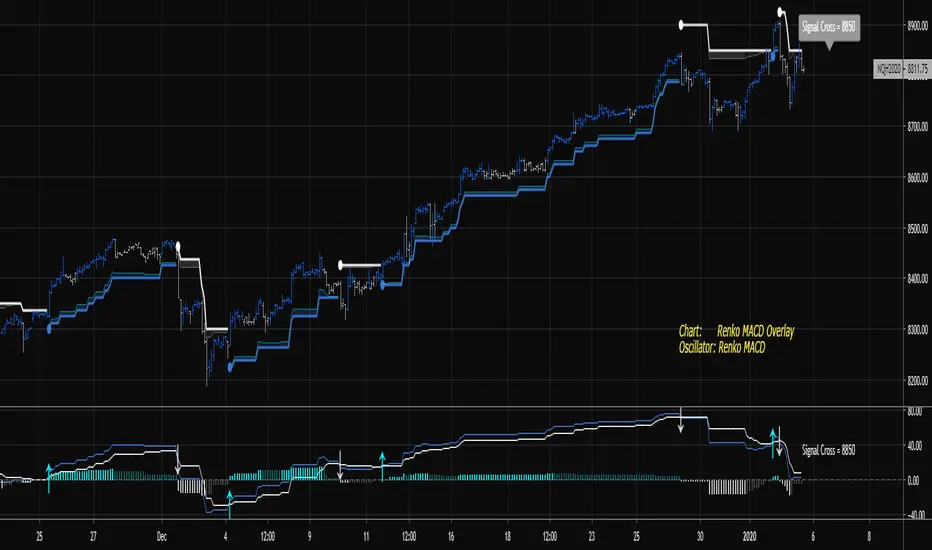
Renko MACD TrendThe goal of this indicator is to plot the MACD, Signal, and Histogram values "as if" the chart is a true price action based Renko chart. It can be used on a time series chart or Renko series chart. The MACD is derived from the raw price action of a time-based chart, where the historic and live price is clustered into Renko bricks. The Renko brick production algorithm is entirely backed by Renko Overlay Ribbon and thoroughly tested.
The algorithm takes into account rapid brick production within a single time candle and adjusts accordingly. The output may vary slightly between different chart time frames for the same indicator settings, but this is due to the lack of price fluctuation visibility that can occur in higher chart time frames. If the brick tick size is low, an appropriate chart interval should be selected that maximizes the amount of price volatility visible to the indicator. A bad setting would be something like a 1 tick EURUSD Renko setting on an H4 or Day chart, there simply is no way to derive the exact and ordered price fluctuations in a single candle, 1 pip at a time. A more appropriate chart time frame would be 1-5 minutes for this selected Renko brick size.
The difference between this indicator and the companion Renko MACD indicator can be understood in the following video. The indicator plots the current MACD - Signal cross and MACD - Zero cross thresholds on the chart so that you know exactly where the most important crossing values are at all times. This can be used as a dynamic stop or a dynamic entry location for trades.
If you are interested in the RSI-RENKO DIVINE Strategy please have a look here:
Contact me in Trading View or telegram for more information and access instructions.
Telegram: t.me
Daily Edge: www.daily-edge.com
Renko Trend MomentumA momentum indicator that shows bulls vs bears strength of renko brick production. The algorithm takes into account rapid brick production within a single time candle and adjust accordingly. The output may vary slightly between different chart time frames for the same indicator settings, but this is due to the lack of price fluctuation visibility that can occur in higher chart time frames. If the brick tick size is low, an appropriate chart interval should be selected that maximizes the amount of price volatility visible to the indicator.
Plots the normalized rate of new Renko Up Brick production vs new Renko Down Brick production.
Custom crossover threshold to help prevent whipsaws and keep you in the trend.
Shows pending areas when a crossover is imminent.
Custom time-based buffer combined with a crossover to keep you in the trend.
Shows crossover background color changes when the direction of the Renko Trend changes.
Works well with Renko Price Bars Overlay script.

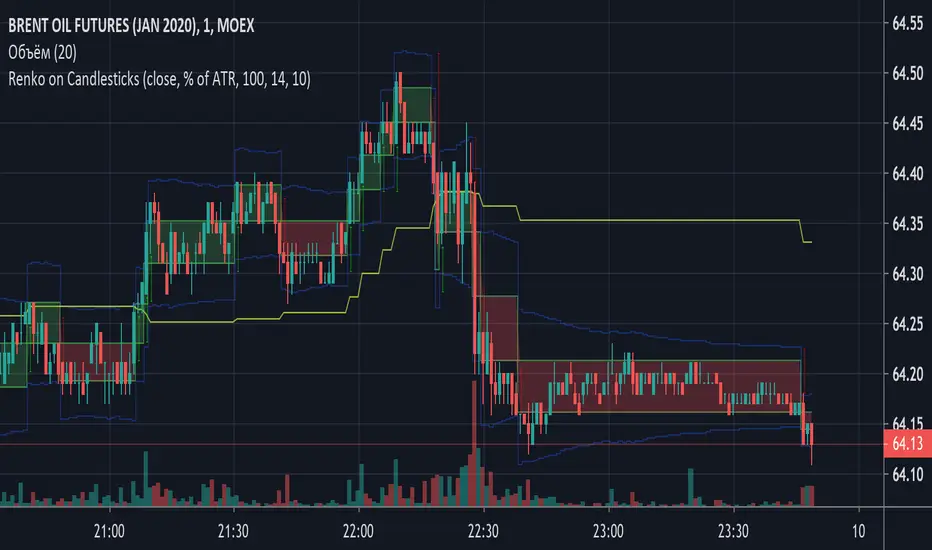
Renko on CandlesticksThis script drowse renkoboxes on top of candlesticks. This script does not repaint and can be used for alerts generation. If you add Renko to the same chart using security function it won't be the same (which seems to be a bug in TV). To check if my implementation is correct you can open Renko in a separate window and check timestamps.
Unlike standard implementation, when you use ATR based Renko bars, every box can have different size! The current ATR is applied after every bar. The standard implementation takes the current ATR value and applies it to the whole chart, so the chart may look totally different when you reload the page.
Renko Candles OverlayHello All,
For long time I got many request for Renko Candles and now here it's, Renko Candles Overlay . I tried to make almost everything optional, so you can play with the options as you want.
Let see the options:
Method: the option for brick scaling method: ATR, ATR/2, ATR/4, Percent, Traditional
- ATR Period: period for Average True Range and it's valid if the method is ATR
- ATR/2 Period: period for Average True Range and it's valid if the method is ATR/2
- ATR/4 Period: period for Average True Range and it's valid if the method is ATR/4
- Traditional: User-defined brick size, it's valid if the method is Traditional
- Percent: Percent of Close price, it's valid if the method is Percent
if the method is not Traditional (fixed brick size) then Brick size is calculated/updated when new bricks added. so The box sizes may be different because of the calculation is dynamic.
Levels & Lines for new Bricks: if you enable this option then the script shows the levels for new brick
Change Bar Color: optionally the script changes the bar color by using direction of the bricks
and some other options for coloring.
The script shows the bricks for visible area, which is approximately 280 candles. so if you change the width and number of the bricks then number of bricks that is shown is adjusted automatically to fit the screen. you can see the examples below:
The script shows the levels to new brick as a line and label:
Because of real-time bar is not confirmed until the candle close, the script shows the bricks as Unconfirmed , and unconfirmed bricks shown in different color:
You can change the width of the bricks (width is 10 in following example):
Optionally candle colors are changde by the direction of the bricks:
If you have any recommendation then please drop a comment under the script ;)
Enjoy!

Renko RSIThe goal of this indicator is to plot the RSI values "as if" the chart is a true price action based Renko chart. It can be used on a time series chart or Renko series chart. The RSI is derived from the raw price action of a time-based chart, where the historic and live price is clustered into Renko bricks. The Renko brick production algorithm is entirely backed by Renko Price Bars Overlay and thoroughly tested.
The algorithm takes into account rapid brick production within a single time candle and adjusts accordingly. The output may vary slightly between different chart time frames for the same indicator settings, but this is due to the lack of price fluctuation visibility that can occur in higher chart time frames. If the brick tick size is low, an appropriate chart interval should be selected that maximizes the amount of price volatility visible to the indicator. A bad setting would be something like a 1 tick EURUSD Renko setting on an H4 chart, there simply is no way to derive the exact and ordered price fluctuations in a single H4 candle, 1 pip at a time. A more appropriate chart time frame would be 1-3 minutes for this selected Renko brick size.
Plots user specified RSI based on Renko bricks. This would be the same (or very close to) the RSI viewed on a normal Renko chart based on price action alone.
Works well with Renko Price Bars Overlay script.
See also: Renko Trend Momentum

Renko MACDThe goal of this indicator is to plot the MACD, Signal, and Histogram values "as if" the chart is a true price action based Renko chart. It can be used on a time series chart or Renko series chart. The MACD is derived from the raw price action of a time-based chart, where the historic and live price is clustered into Renko bricks. The Renko brick production algorithm is entirely backed by Renko Overlay Ribbon and thoroughly tested.
The algorithm takes into account rapid brick production within a single time candle and adjusts accordingly. The output may vary slightly between different chart time frames for the same indicator settings, but this is due to the lack of price fluctuation visibility that can occur in higher chart time frames. If the brick tick size is low, an appropriate chart interval should be selected that maximizes the amount of price volatility visible to the indicator. A bad setting would be something like a 1 tick EURUSD Renko setting on an H4 or Day chart, there simply is no way to derive the exact and ordered price fluctuations in a single candle, 1 pip at a time. A more appropriate chart time frame would be 1-5 minutes for this selected Renko brick size.
Please find the following video introduction helpful for this indicator and the Renko MACD Trend indicator:
If you are interested in the RSI-RENKO DIVINE Strategy please have a look here:
Contact me in Trading View or telegram for more information and access instructions.
Telegram: t.me
Daily Edge: www.daily-edge.com

Renko Weis Wave VolumeA volume bulls vs bears power indicator that is based entirely on Wyckoff Weis Wave Volume trends. This indicator is part of my DIVINE series RENKO indicators that run on an engine capable of extracting Renko brick information from a time series. As with the Renko RSI and Renko Trend Momentum indicators, swapping between Renko and time series type charts(bar, candlestick , heikin ashi) is seamless.
The algorithm uses the cumulative volume sum during the lifetime of a Renko brick formation. It tries hard to dissect and distribute volume when multiple bricks are formed during a single time candle (bar, candlestick , heikin ashi). Both positive and negative volume are plotted simultaneously, so that any instance where multiple bricks are created in a single time candle, positive and negative volume will be shown.
4 color themes as with all of the other DIVINE series indicators and strategies.
Shows ares of accumulation, distribution, capitulation. volatility .
Shows volatile brick locations with counts that indicate the number of nested bricks that were contained in a single time based candle.
Works well with Renko Price Bars Overlay script.
Reference to explanation of volatile brick information tips.
All feature requests are welcome. PM for access.

Renko Simple OverlaySimple Renko Overlay that attempts to deal with the delay present in the Renko function while still using brick size from the Renko function.
