ROC & Momentum FusionROC & Momentum Fusion
(by HabibiTrades ©)
Purpose:
“ROC & Momentum Fusion” combines the Rate of Change (ROC) with a MACD-style signal engine to identify early momentum reversals, confirmed trend shifts, and low-volatility choppy zones.
It’s built for traders who want early momentum detection with the clarity of trend persistence — adaptable to any instrument and timeframe.
⚙️ How It Works
Rate of Change (ROC):
Measures the percentage speed of price change over time, showing the raw momentum strength.
Signal Line (EMA):
A short EMA of the ROC — responds faster to new directional shifts, similar to a MACD signal line.
Histogram:
Displays acceleration and deceleration between the ROC and its signal line.
Persistent Trend States:
When the ROC crosses the signal line or zero, the indicator enters a new momentum regime
(bullish or bearish) and stays in that color until another flip occurs.
Dynamic Choppy Zone:
When ROC momentum fades within the zero buffer zone, the indicator turns orange, signaling a sideways or indecisive market.
🟢 Visual Regimes
Regime Description Color
Bullish Momentum ROC above zero or signal line 🟢 Neon Green
Bearish Momentum ROC below zero or signal line 🔴 Neon Red
Choppy / Neutral ROC hovering within ±threshold range 🟠 Neon Orange
This color system makes it visually effortless to see whether the market is trending, reversing, or consolidating.
🧭 Adaptive Intelligence
The script automatically adjusts to market type and session for consistent accuracy:
Session Adaptive: Adjusts smoothing based on global sessions (Asian, London, New York, Sydney).
Instrument Adaptive: Fine-tunes sensitivity automatically for major assets — NASDAQ (NQ), S&P 500 (ES), Gold (GC), Oil (CL), Bitcoin (BTC).
Volatility Normalization: Optionally divides ROC by its own standard deviation to stabilize noisy assets and maintain consistent scaling.
🔔 Signals & Alerts
Bullish Reversal:
ROC crosses above its signal or zero line — early momentum flip.
Bearish Reversal:
ROC crosses below its signal or zero line — downward momentum flip.
Alerts:
Both reversal conditions include built-in alert triggers for automation and notifications.
🎨 Visual Features
Main ROC Line: Adaptive EMA of ROC, color-coded by trend regime.
Signal Line: Optional white EMA overlay for MACD-style crossovers.
Histogram: Visual burst display of acceleration (green/red).
Reversal Markers: Optional triangles marking exact crossover points.
Threshold Lines: Highlight the zero and buffer zones for visual clarity.
🧩 Best Use Cases
Identify early momentum shifts before price confirms them.
Confirm trend continuation or exhaustion with color persistence.
Detect choppy / low-volatility periods instantly.
Works across all timeframes — from 1-minute scalping to weekly swings.
Combine with structure, EMAs, or volume for confirmation.
⚙️ Recommended Settings
Setting Default Description
ROC Period 6 Core momentum length (lower = faster response).
Signal EMA Length 3 MACD-style responsiveness (lower = more reactive).
Zero Buffer Threshold 0.15 Defines the width of the neutral zone around zero.
Choppy Zone Multiplier 1.0 Expands or tightens the orange zone sensitivity.
These defaults have been optimized through real-market testing to balance responsiveness and smoothness across different asset classes.
⚠️ Notes
The color regime is persistent, meaning once the line turns bullish or bearish, it remains in that state until momentum structurally flips.
The orange zone represents momentum uncertainty and helps avoid false entries in range-bound markets.
Works seamlessly on any timeframe and with any asset.
Cari dalam skrip untuk "roc"
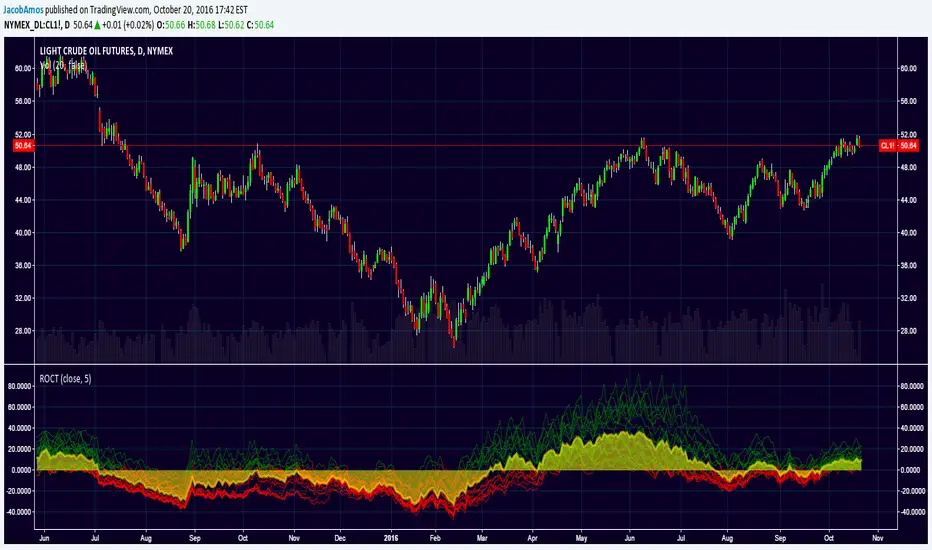
ROC TideAdds some depth to the traditional rate of change (ROC) indicator. Instead of just having one ROC line with a single lookback period, this takes a minimum lookback period, n , and plots 20 ROC lines with lookback periods of n, 2n, 3n, ..., 20n . These lines will appear green when greater than zero, red when less than zero, and yellow when equal to zero by default.
Then it plots the average of those 20 ROC's as a yellow filled area so as to make it easier to see where the balance (or "tide") of the ROC waves are located.
Roc & Atr
Roc & Atr Orders
My indicator, where I compare the 20 bar change percentage with the 14 bar atr band, I hope it will be useful to everyone. the green zones can be interpreted as BUY and the red zone as SELL zone. In graphs with high motion and low atr, the channel narrowing can be interpreted as BUY and the channel opening as SELL.
No indicator shows you the right way ... The best way is your own thoughts

ROC PercentileRate Of Change Percentile calculates the current ROC (user defined length) as a percentile rank.
We use 2 separate arrays, one for all positive ROC values and one for all negative values within a defined lookback period. Then the current ROC value is compared to those arrays to find it's percentile ranking.
For example, a ranking of 75 means the ROC is in the 75th percentile of all POSITIVE ROC values over the lookback period.
A ranking of -80 is in the 80th percentile of all NEGATIVE ROC values over the lookback period.
Most ROC scripts use raw ROC values (or smoothed or otherwise altered), or have stochastic formula applied to them, I've not seen one that displays ROC as percentile ranking of previous positive/negative values.
What is the advantage?
Raw ROC data only gives half the picture. What we want to do is compare the ROC to previous ROC values, to give a sense of scale. Raw ROC values don't give you that context and you can only compare visually, usually limited to the number of bars you can see on your screen.
Using a percentile ranking gives us the context of current Rate of Change relative to the previous Rate of Change over a large lookback period, and not just visually but mathematically.
Why not using a long stochastic ROC? The problem with stochastics in general is that an outlier data point can ruin the data for the rest of the lookback period.
For example, imagine a huge outlier 8% ROC. The 2nd largest ROC is 4% and the 3rd largest is 2%, with all other values below this.
In this example, a stochastic ROC would display the 8% outlier as 100, the 4% as 50, the 2% as 25 and all other data would be squeezed down between 0-25.
Additionally, a value of 60 may have vastly different meaning depending on whether the lookback period contains a large outlier or not.
With a percentile ranking, that 8% outlier would still have a value of 100. But the 4% and 2% would be 99 and 98 respectively (this assumes 100 data points in the series, in reality values will usually be decimals).
This effectively flattens the curve and gives a more consistent and dependable experience, allowing you to more accurately assess the relative importance of the current ROC.
The line of circles is set at the 50 and -50 values for quick comparison.
Values > 50 represent ROC greater than 50% of previous positive ROC values.
Values < -50 represent ROC greater than 50% of previous negative ROC values.

ROC + SMI Auto Adjust
This indicator combines the Rate of Change (ROC) and the Stochastic Momentum Index (SMI) with automatically adjusted parameters for different time frames (short, medium, long). It normalizes the ROC to match the SMI levels, displays the ROC as a histogram and the SMI as lines, highlights overbought/oversold zones and includes a settings table. Ideal for analyzing momentum on different time frames.
Key Features:
Automatic Parameter Adjustment:
The script detects the current chart time frame (e.g. 1-minute, 1-hour, daily) and adjusts the parameters for the ROC and SMI accordingly.
Parameters such as ROC length, SMI length and smoothing periods are optimized for short, medium and long term time frames.
Rate of Change (ROC):
ROC measures the percentage change in price over a specified period.
The script normalizes the ROC values to match the SMI range, making it easier to compare the two indicators on the same scale.
The ROC is displayed as a histogram, where positive values are colored green and negative values are colored red.
Stochastic Momentum Index (SMI):
SMI is a momentum oscillator that identifies overbought and oversold conditions.
The script calculates the SMI and its signal line, plotting them on the chart.
Overbought and oversold levels are displayed as dotted lines for convenience.
SMI and SMI Signal Crossover:
When the main SMI crosses the signal line from below upwards, it may be a buy signal (bullish signal).
When the SMI crosses the signal line from above downwards, it may be a sell signal (bearish signal).
Configurable Inputs:
Users can use the automatically adjusted settings or manually override the parameters (e.g. ROC length, SMI length, smoothing periods).
Overbought and oversold levels for SMI are also configurable.
Parameter Table:
A table is displayed on the chart showing the current parameters (e.g. timeframe, ROC length, SMI length) for transparency and debugging.
The position of the table is configurable (e.g. top left, bottom right).
How it works:
The script first detects the chart timeframe and classifies it as short-term (e.g. 1M, 5M), medium-term (e.g. 1H, 4H) or long-term (e.g. D1, W1).
Based on the timeframe, it sets default values for the ROC and SMI parameters.
ROC and SMI are calculated and normalized so that they can be compared on the same scale.
ROC is displayed as a histogram, while SMI and its signal line are displayed as lines.
Overbought and oversold levels are displayed as horizontal lines.
Use cases:
Trend identification: ROC helps to identify the strength of the trend, while SMI indicates overbought/oversold conditions.
Momentum analysis: The combination of ROC and SMI provides insight into both price momentum and potential reversals.
Time frame flexibility: The auto-adjustment feature makes the script suitable for scalping (short-term), swing trading (medium-term) and long-term investing.

ROC (Rate of Change) Refurbished▮ Introduction
The Rate of Change indicator (ROC) is a momentum oscillator.
It was first introduced in the early 1970s by the American technical analyst Welles Wilder.
It calculates the percentage change in price between periods.
ROC takes the current price and compares it to a price 'n' periods (user defined) ago.
The calculated value is then plotted and fluctuates above and below a Zero Line.
A technical analyst may use ROC for:
- trend identification;
- identifying overbought and oversold conditions.
Even though ROC is an oscillator, it is not bounded to a set range.
The reason for this is that there is no limit to how far a security can advance in price but of course there is a limit to how far it can decline.
If price goes to $0, then it obviously will not decline any further.
Because of this, ROC can sometimes appear to be unbalanced.
(TradingView)
▮ Improvements
The following features were added:
1. Eight moving averages for the indicator;
2. Dynamic Zones;
3. Rules for coloring bars/candles.
▮ Motivation
Averages have been added to improve trend identification.
For finer tuning, you can choose the type of averages.
You can hide them if you don't need them.
The Dynamic Zones has been added to make it easier to identify overbought/oversold regions.
Unlike other oscillators like the RSI for example, the ROC does not have a predetermined range of oscillations.
Therefore, a fixed line that defines an overbought/oversold range becomes unfeasible.
It is in this matter that the Dynamic Zone helps.
It dynamically adjusts as the indicator oscillates.
▮ About Dynamic Zones
'Most indicators use a fixed zone for buy and sell signals.
Here's a concept based on zones that are responsive to the past levels of the indicator.'
The concept of Dynamic Zones was described by Leo Zamansky (Ph.D.) and David Stendahl, in the magazine of Stocks & Commodities V15:7 (306-310).
Basically, a statistical calculation is made to define the extreme levels, delimiting a possible overbought/oversold region.
Given user-defined probabilities, the percentile is calculated using the method of Nearest Rank.
It is calculated by taking the difference between the data point and the number of data points below it, then dividing by the total number of data points in the set.
The result is expressed as a percentage.
This provides a measure of how a particular value compares to other values in a data set, identifying outliers or values that are significantly higher or lower than the rest of the data.
▮ Thanks and Credits
- TradingView: for ROC and Moving Averages
- allanster: for Dynamic Zones

ROC Between SymbolsThis script is a simple Rate Of Change (ROC) closing price comparison between a "compare" symbol and a "base" symbol over a user-specified period (maximum 200).
When the ROC is greater than zero, >0 (positive), the compare symbol is increasing faster than the base symbol -- the compare symbol has positive comparative momentum. Of course, your compare symbol could be flat and your base symbol could be decreasing, but math-wise these scenarios are equivalent and the compare symbol has positive comparative momentum.
When the ROC is less than zero, <0 (negative), the compare symbol has negative comparative momentum. Again, the base symbol could be increasing and the compare symbol could be flat, but math-wise this is the same scenario and the compare symbol has negative comparative momentum.
This ROC comparison tactic was documented and described on YouTube channel "Figuring Out Money" in an interesting study between Bitcoin and Gold prices on a weekly timeframe.
ROC Divergence — SharkCIAThis script helps to identify ROC pivot points and aims to show you when the trend has changed direction.

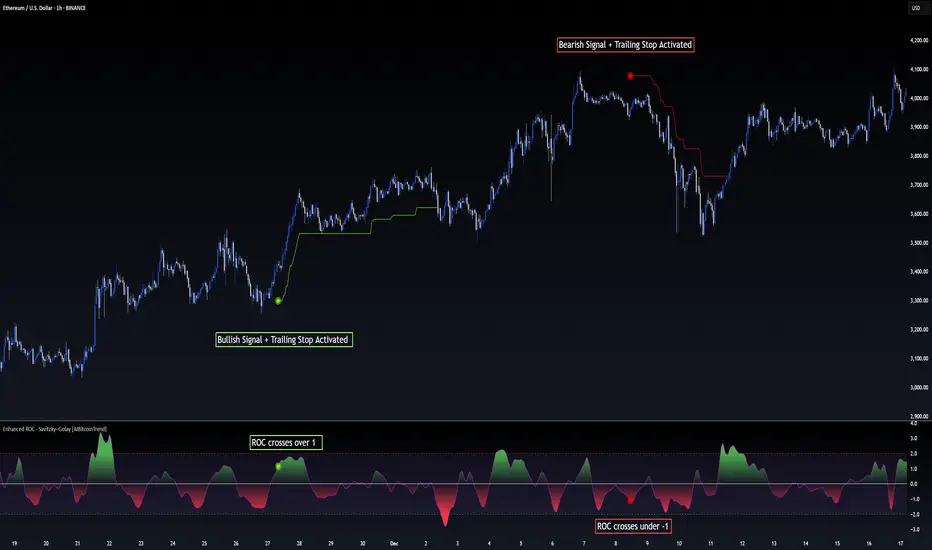
Enhanced ROC - Savitzky–Golay [AIBitcoinTrend]👽 Adaptive ROC - Savitzky–Golay (AIBitcoinTrend)
The Adaptive ROC - Savitzky–Golay redefines traditional Rate of Change (ROC) analysis by integrating Savitzky–Golay smoothing with volatility-adaptive normalization, allowing it to dynamically adjust across different market conditions. Unlike the standard ROC, which reacts rigidly to price changes, this advanced version refines trend signals while maintaining responsiveness to volatility.
Additionally, this indicator features real-time divergence detection and an ATR-based trailing stop system, equipping traders with a powerful toolset for momentum analysis, reversals, and trend-following strategies.
👽 What Makes the Adaptive ROC - Savitzky–Golay Unique?
Unlike conventional ROC indicators, this enhanced version leverages volatility-adjusted scaling and Z-score normalization to improve signal consistency across different timeframes and assets.
✅ Savitzky–Golay Smoothing – Reduces noise while preserving trend structure for clearer signals.
✅ Volatility-Adaptive Normalization – Ensures that overbought and oversold thresholds remain consistent across different markets.
✅ Real-Time Divergence Detection – Identifies early bullish and bearish divergence signals for potential reversals.
✅ Crossovers & ATR-Based Trailing Stops – Implements intelligent trade management with dynamic stop levels.
👽 The Math Behind the Indicator
👾 Savitzky–Golay Smoothing
The indicator applies a Savitzky–Golay filter to the raw ROC data, creating a smoother curve while preserving key inflection points. This technique prevents excessive lag while maintaining the integrity of price movements.
sg_roc = (roc_raw + 3*roc_raw + 5*roc_raw + 7*roc_raw + 5*roc_raw + 3*roc_raw + roc_raw ) / 25
👾 Volatility-Adaptive Scaling
By dynamically adjusting the smoothed ROC using standard deviation, the indicator ensures that momentum readings remain relative to the market’s current volatility.
volatility = ta.stdev(close, rocLength)
dynamicFactor = 1 / (1 + volatility / 100)
advanced_sg_roc = sg_roc * dynamicFactor
👾 Z-Score Normalization
To maintain a stable Overbought/Oversold structure across different markets, the ROC is normalized using a Z-score transformation, ensuring its values remain statistically relevant.
rocMean = ta.wma(advanced_sg_roc, lenZ)
rocStdev = ta.stdev(advanced_sg_roc, lenZ)
zRoc = (advanced_sg_roc - rocMean) / rocStdev
👽 How Traders Can Use This Indicator
👾 Divergence Trading Strategy
Bullish Divergence Setup:
Price makes a lower low, while the ROC forms a higher low.
A buy signal is confirmed when the ROC starts rising.
Bearish Divergence Setup:
Price makes a higher high, while the ROC forms a lower high.
A sell signal is confirmed when the ROC starts declining.
👾 Buy & Sell Signals with Trailing Stop
Bullish Setup:
✅ ROC crosses above the bullish trigger level → Buy Signal.
✅ A bullish trailing stop is placed at Low - (ATR × Multiplier).
✅ Exit if price crosses below the stop.
Bearish Setup:
✅ ROC crosses below the bearish trigger level → Sell Signal.
✅ A bearish trailing stop is placed at High + (ATR × Multiplier).
✅ Exit if price crosses above the stop.
👽 Why It’s Useful for Traders
Savitzky–Golay Filtering – Retains essential trend details while eliminating excessive noise.
Volatility-Adjusted Normalization – Makes overbought/oversold levels universally reliable across markets.
Real-Time Divergence Alerts – Identifies early reversal signals for optimal entries and exits.
ATR-Based Risk Management – Ensures stops dynamically adapt to market conditions.
Works Across Markets & Timeframes - Suitable for stocks, forex, crypto, and futures trading.
👽 Indicator Settings
ROC Period – Defines the number of bars used for ROC calculation.
Smoothing Strength – Adjusts the degree of Savitzky–Golay filtering.
Volatility Scaling – Enables or disables the adaptive volatility factor.
Enable Divergence Analysis – Turns on real-time divergence detection.
Lookback Period – Specifies the pivot detection period for divergences.
Enable Crosses Signals – Activates trade signals based on ROC crossovers.
ATR Multiplier – Controls the sensitivity of the trailing stop.
Disclaimer: This indicator is designed for educational purposes and does not constitute financial advice. Please consult a qualified financial advisor before making investment decisions.
Kalman Filtered ROC & Stochastic with MA SmoothingThe "Smooth ROC & Stochastic with Kalman Filter" indicator is a trend following tool designed to identify trends in the price movement. It combines the Rate of Change (ROC) and Stochastic indicators into a single oscillator, the combination of ROC and Stochastic indicators aims to offer complementary information: ROC measures the speed of price change, while Stochastic identifies overbought and oversold conditions, allowing for a more robust assessment of market trends and potential reversals. The indicator plots green "B" labels to indicate buy signals and blue "S" labels to represent sell signals. Additionally, it displays a white line that reflects the overall trend for buy signals and a blue line for sell signals. The aim of the indicator is to incorporate Kalman and Moving Average (MA) smoothing techniques to reduce noise and enhance the clarity of the signals.
Rationale for using Kalman Filter:
The Kalman Filter is chosen as a smoothing tool in the indicator because it effectively reduces noise and fluctuations. The Kalman Filter is a mathematical algorithm used for estimating and predicting the state of a system based on noisy and incomplete measurements. It combines information from previous states and current measurements to generate an optimal estimate of the true state, while simultaneously minimizing the effects of noise and uncertainty. In the context of the indicator, the Kalman Filter is applied to smooth the input data, which is the source for the Rate of Change (ROC) calculation. By considering the previous smoothed state and the difference between the current measurement and the predicted value, the Kalman Filter dynamically adjusts its estimation to reduce the impact of outliers.
Calculation:
The indicator utilizes a combination of the ROC and the Stochastic indicator. The ROC is smoothed using a Kalman Filter (credit to © Loxx: ), which helps eliminate unwanted fluctuations and improve the signal quality. The Stochastic indicator is calculated with customizable parameters for %K length, %K smoothing, and %D smoothing. The smoothed ROC and Stochastic values are then averaged using the formula ((roc + d) / 2) to create the blended oscillator. MA smoothing is applied to the combined oscillator aiming to further reduce fluctuations and enhance trend visibility. Traders are free to choose their own preferred MA type from 'EMA', 'DEMA', 'TEMA', 'WMA', 'VWMA', 'SMA', 'SMMA', 'HMA', 'LSMA', and 'PEMA' (credit to: © traderharikrishna for this code: ).
Application:
The indicator's buy signals (represented by green "B" labels) indicate potential entry points for buying assets, suggesting a bullish trend. The white line visually represents the trend, helping traders identify and follow the upward momentum. Conversely, the sell signals (blue "S" labels) highlight possible exit points or opportunities for short selling, indicating a bearish trend. The blue line illustrates the bearish movement, aiding in the identification of downward momentum.
The "Smoothed ROC & Stochastic" indicator offers traders a comprehensive view of market trends by combining two powerful oscillators. By incorporating the ROC and Stochastic indicators into a single oscillator, it provides a more holistic perspective on the market's momentum. The use of a Kalman Filter for smoothing helps reduce noise and enhance the accuracy of the signals. Additionally, the indicator allows customization of the smoothing technique through various moving average types. Traders can also utilize the overbought and oversold zones for additional analysis, providing insights into potential market reversals or extreme price conditions. Please note that future performance of any trading strategy is fundamentally unknowable, and past results do not guarantee future performance.

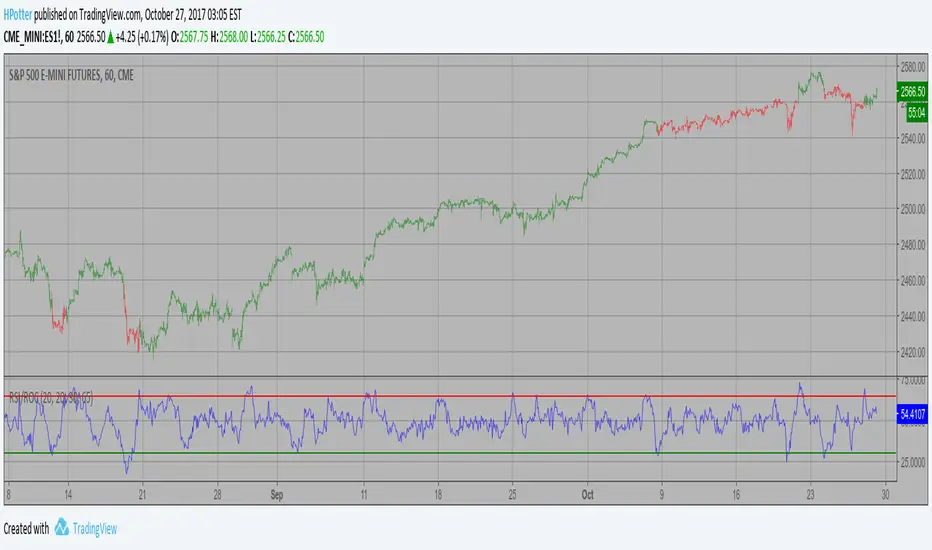
RSI-ROC Momentum AlertThis is the RSI-ROC Momentum Alert trading indicator, designed to help traders identify potential buy and sell signals based on the momentum of price movements.
The indicator is based on two technical indicators: the Rate of Change (ROC) and the Relative Strength Index (RSI). The ROC measures the speed of price changes over a given period, while the RSI measures the strength of price movements. By combining these two indicators, this trading indicator aims to provide a comprehensive view of the market momentum.
An RSI below its oversold level, which shows as a green background, in addition to a ROC crossing above its moving average (turns green) signals a buying opportunity.
An RSI above its overbought level, which shows as a red background, in addition to a ROC crossing below its moving average (turns red) signals a selling opportunity.
Traders can use this indicator to identify potential momentum shifts and adjust their trading strategies accordingly.
The ROC component of the indicator uses a user-defined length parameter to calculate the ROC and a simple moving average (SMA) of the ROC. The color of the ROC line changes to green when it is above the ROC SMA and to red when it is below the ROC SMA. The ROC SMA color changes whether it's above or below a value of 0.
The RSI component of the indicator uses a user-defined length parameter to calculate the RSI, and user-defined RSI Low and RSI High values to identify potential buy and sell signals. When the RSI falls below the RSI Low value, a green background color is applied to the chart to indicate a potential buy signal. Conversely, when the RSI rises above the RSI High value, a red background color is applied to the chart to indicate a potential sell signal.
This indicator is intended to be used on any time frame and any asset, and can be customized at will.

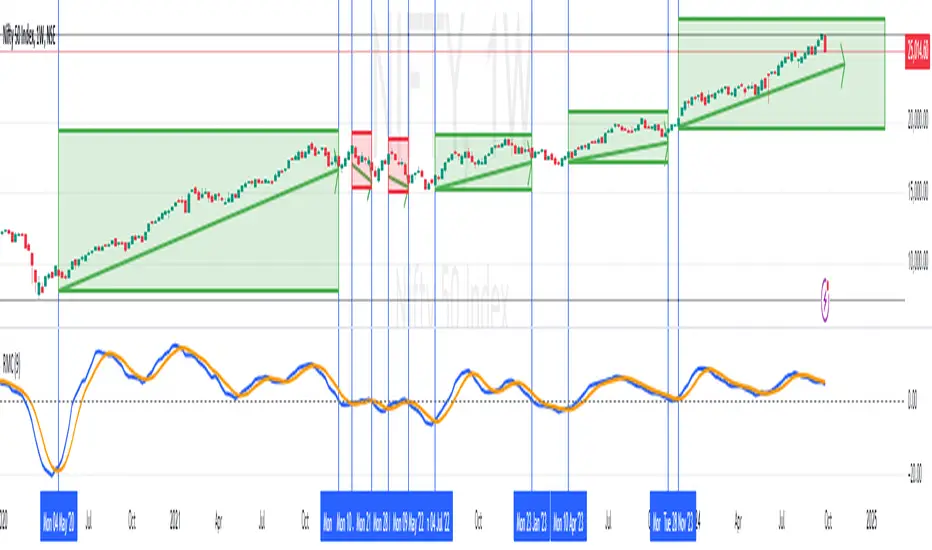
RoC Momentum CycleRoC Momentum Cycles (RMC) is derived from RoC (Rate of Change) indicator.
Motivation behind RMC: Addressing RoC’s Shortcomings
While the Rate of Change (RoC) indicator is a valuable tool for assessing momentum, it has notable limitations that traders must be aware of. One of the primary challenges with the traditional RoC is its sensitivity to price fluctuations, which can lead to false signals in volatile markets. This often results in premature entries or exits, impacting trading performance.
By smoothing out the RoC calculations and focusing on more consistent signal generation (using SMA on smoothed RoC), RMC offers a more consistent representation of price trends.
Momentum Cycles
RMC helps visualize momentum cycles in a much better way compared to RoC.
Long Momentum Cycle : A cross-over of smoothed RoC (blue line) above averaged signal (orange line) below zero marks start of a new potential upside cycle which ends when the blue line comes back to zero line from above.
Short Momentum Cycle : A cross-under of blue line below orange line above zero marks beginning of a potential downside cycle which ends when the blue line comes back to zero from below.
Adaptive Fisherized ROCIntroduction
Hello community, here I applied the Inverse Fisher Transform, Ehlers dominant cycle determination and smoothing methods on a simple Rate of Change (ROC) indicator
You have a lot of options to adjust the indicator.
Usage
The rate of change is most often used to measure the change in a security's price over time.
That's why it is a momentum indicator.
When it is positive, prices are accelerating upward; when negative, downward.
It is useable on every timeframe and could be a potential filter for you your trading system.
IMO it could help you to confirm entries or find exits (e.g. you have a long open, roc goes negative, you exit).
If you use a trend-following strategy, you could maybe look out for red zones in an in uptrend or green zones in a downtrend to confirm your entry on a pullback.
Signals
ROC above 0 => confirms bullish trend
ROC below 0 => confirms bearish trend
ROC hovers near 0 => price is consolidating
Enjoy! 🚀
ROC Convergence IndicatorROC Convergence indicator overlays the 2, 4, 6, 8, 10, 12 period ROC and then plots the mean absolute deviation of the all ROC's. The goal is to identify times when the ROC spread is the lowest. I made this for myself to identify points at which it may be wise to enter into a trend following or volatility breakout system. Inspired by Linda Raschke.

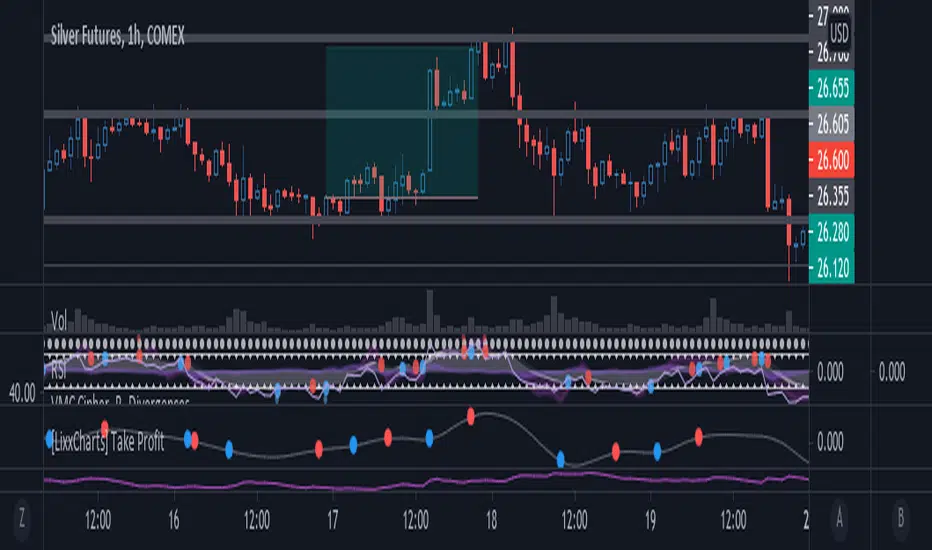
[Lixx] MESA(EMA/SMA) and ROC(ROC/MESA) Take Profit TriggersThis script uses the MESA EMA and SMA as well as the ROC/MESA cross to help find the take profit areas when trading divergences using market cipher or wavetrend. It is inspired by jordanfungs MESA indicator, however this one is different because it is not lagging in the signals.
Hope you enjoy it, and make sure to backtest any strategy before you use it.
GBPNZD ROC RF count strategyCode takes six pairs that are highly correlated to GBPNZD and determines if their ROC's are increasing or decreasing. If a pair has an increasing ROC it is given a 1, if decreasing a -1. The numbers are all added up (this is similar to a count for counting cards in blackjack). If the count goes positive the strategy enters a long position, if negative a short position.
Code is tuned for GBPNZD for 1HR chart. Returns $97 on an initial balance of $100 (if I am reading Tradingview Tester correctly)
*** Should work for GBPJPY, its has the same correlated pairs
Comments welcomed

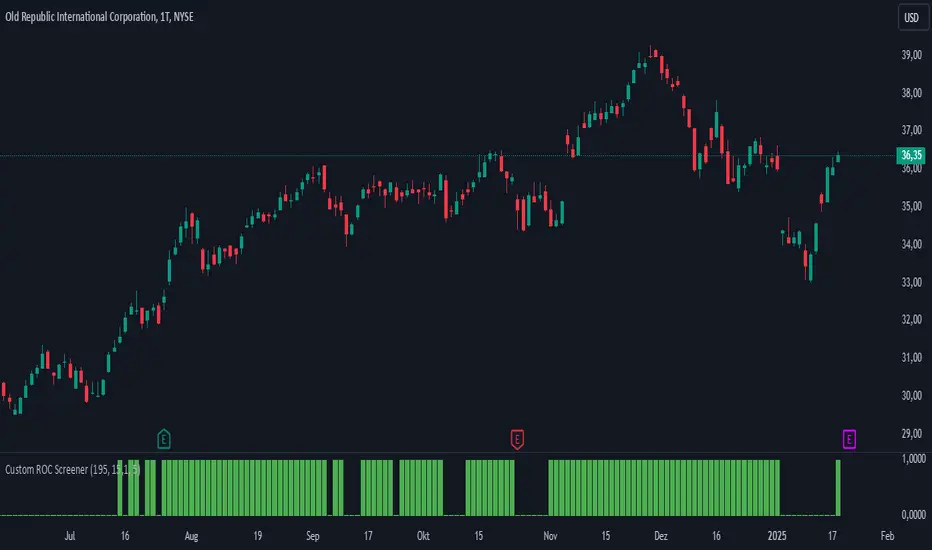
Custom ROCThe Custom ROC allows you to set the length of the ROC. You can also set a reference value and an upward deviation. The sum of the reference value and deviation is shown as a green line.
Combo Backtest 123 Reversal & RSI based on ROC This is combo strategies for get a cumulative signal.
First strategy
This System was created from the Book "How I Tripled My Money In The
Futures Market" by Ulf Jensen, Page 183. This is reverse type of strategies.
The strategy buys at market, if close price is higher than the previous close
during 2 days and the meaning of 9-days Stochastic Slow Oscillator is lower than 50.
The strategy sells at market, if close price is lower than the previous close price
during 2 days and the meaning of 9-days Stochastic Fast Oscillator is higher than 50.
Second strategy
This is the new-age indicator which is version of RSI calculated upon
the Rate-of-change indicator.
The name "Relative Strength Index" is slightly misleading as the RSI
does not compare the relative strength of two securities, but rather
the internal strength of a single security. A more appropriate name
might be "Internal Strength Index." Relative strength charts that compare
two market indices, which are often referred to as Comparative Relative Strength.
And in its turn, the Rate-of-Change ("ROC") indicator displays the difference
between the current price and the price x-time periods ago. The difference can
be displayed in either points or as a percentage. The Momentum indicator displays
the same information, but expresses it as a ratio.
WARNING:
- For purpose educate only
- This script to change bars colors.

GMS: TSI Indicator (ROC)This is based on the original TSI Indicator that's already built in.
The PC is originally taken as the change between the current price - the previous price. I substituted that with Rate of Change. Using a 1 period ROC it's quite similar to the TSI Indicator and increasing the length results in a smoother TSI.
I hope it helps,
Andre
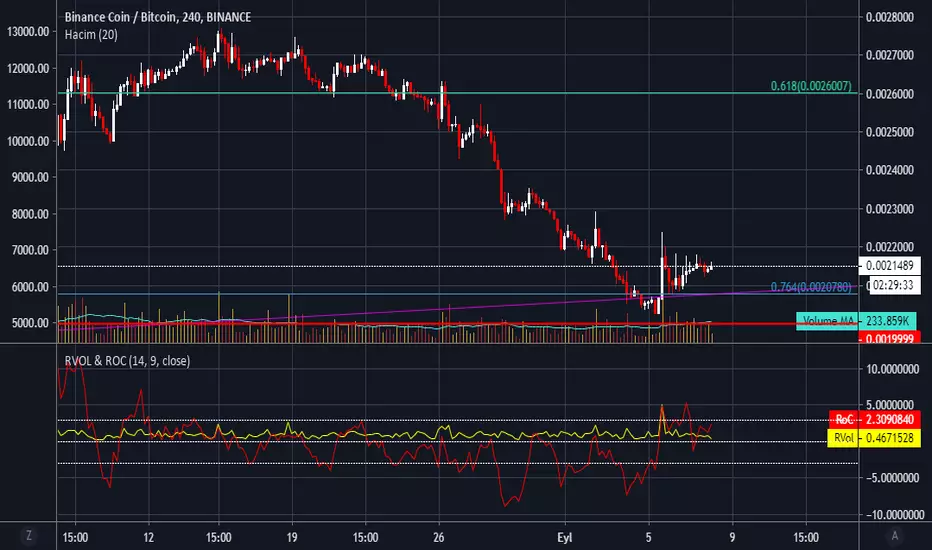
RVol & RoC - Relative Volume & Rate of Change by haciyatmazRelative Volume ( RVol ) is a critical measure of volume flows. It measures current volume in relation to the "usual" volume for this time of the day.
Rate of Change ( RoC ) is a momentum-based technical indicator that measures the percentage change in price between the current price and the price a certain number of periods ago.
RSI based on ROC Backtest This is the new-age indicator which is version of RSI calculated upon
the Rate-of-change indicator.
The name "Relative Strength Index" is slightly misleading as the RSI
does not compare the relative strength of two securities, but rather
the internal strength of a single security. A more appropriate name
might be "Internal Strength Index." Relative strength charts that compare
two market indices, which are often referred to as Comparative Relative Strength.
And in its turn, the Rate-of-Change ("ROC") indicator displays the difference
between the current price and the price x-time periods ago. The difference can
be displayed in either points or as a percentage. The Momentum indicator displays
the same information, but expresses it as a ratio.
You can change long to short in the Input Settings
WARNING:
- For purpose educate only
- This script to change bars colors.
RSI based on ROC Strategy This is the new-age indicator which is version of RSI calculated upon
the Rate-of-change indicator.
The name "Relative Strength Index" is slightly misleading as the RSI
does not compare the relative strength of two securities, but rather
the internal strength of a single security. A more appropriate name
might be "Internal Strength Index." Relative strength charts that compare
two market indices, which are often referred to as Comparative Relative Strength.
And in its turn, the Rate-of-Change ("ROC") indicator displays the difference
between the current price and the price x-time periods ago. The difference can
be displayed in either points or as a percentage. The Momentum indicator displays
the same information, but expresses it as a ratio.
WARNING:
- This script to change bars colors.