Forex strength meterCalculates the strength of a particular currency taking into account it's rate of change (% price change in a period) in all correlated and anti-correlated pairs. For instance, when looking for USD strength we will add ROC for USDCAD, USDCHF and USDJPY while subtract AUDUSD, EURUSD, GBPUSD and NZDUSD.
After ROC step, one can smooth the result using EMA, or MACD.
As the script needs to fetch values from multiple currencies it isn't the fastest one, but it gets its job done.
Important: Only major currencies (AUD, CAD, CHF, EUR, GBP, JPY, NZD and USD) are considered.
Cari dalam skrip untuk "roc"

Fat Tony's Composite Momentum + ROC (v0.4)Fat Tony's Composite Momentum + ROC (v0.4)
Option guy settings and indicators

BK AK-Scope🔭 Introducing BK AK-Scope — Target Locked. Signal Acquired. 🔭
After building five precision weapons for traders, I’m proud to unveil the sixth.
BK AK-Scope — the eye of the arsenal.
This is not just an indicator. It’s an intelligence system for volatility, signal clarity, and rate-of-change dynamics — forged for elite vision in any market terrain.
🧠 Why “Scope”? And Why “AK”?
Every shooter knows: you can’t hit what you can’t see.
The Scope brings range, clarity, and target distinction. It filters motion from noise. Purpose from panic.
“AK” continues to honor the man who trained my sight — my mentor, A.K.
His discipline taught me to wait for alignment. To move with reason, not emotion.
His vision lives in every code line here.
🔬 What Is BK AK-Scope?
A Triple-Tier TSI Correlation Engine, fused with adaptive opacity logic, a volatility scoring system, and real-time signal clarity. It’s momentum dissected — by speed, depth, and rate of change.
Built to serve traders who:
Need visual hierarchy between fast, mid, and slow TSI responses.
Want adaptive fills that pulse with volatility — not static zones.
Require a volatility scoring overlay that reads the battlefield in real time.
⚙️ Core Systems: How BK AK-Scope Works
✅ Fast/Mid/Slow TSI →
Three layers of correlation: like scopes with zoom levels.
You track micro moves, mid swings, and macro flow simultaneously.
✅ Rate-of-Change Adaptive Opacity →
Momentum fills fade or flash based on speed — giving you movement density at a glance.
Bull vs. Bear zones adapt to strength. You feel the market’s pulse.
✅ Volatility Score Intelligence →
Custom algorithm measuring:
Range expansion
Rate-of-change differentials
ATR dynamics
Standard deviation pressure
All combined into a score from 0–100 with live icons:
🔥 = Extreme Heat (70+)
🧊 = Cold Zone (<30)
⚠️ = ROC Warning
• = Neutral drift
✅ Auto-Detect Volatility Modes →
Scalp = <15min
Swing = intraday/hourly
Macro = daily/weekly
Or override manually with total control.
🎯 How To Use BK AK-Scope
🔹 Trend Continuation → When all three TSI layers align in direction + volatility score climbs, ride with the trend.
🔹 Early Reversals → Opposing TSI + rapid opacity change + volatility shift = sniper reversal zone.
🔹 Consolidation Filter → Neutral fills + score < 30 = stay out, wait for signal surge.
🔹 Signal Confluence → Pair with:
• Gann fans or angles
• Fib time/price clusters
• Elliott Wave structure
• Harmonics or divergence
To isolate entry perfection.
🛡️ Why This Indicator Changes the Game
It's not just momentum. It’s TSI with depth hierarchy.
It’s not just color. It’s real-time strength visualization.
It’s not just volatility. It’s rate-weighted market intelligence.
This is market optics for the advanced trader — built for vision, clarity, and discipline.
🙏 Final Thoughts
🔹 In honor of A.K., my mentor. The man who taught me to see what others miss.
🔹 Inspired by the power of vision — because execution without clarity is chaos.
🔹 Powered by faith — because Gd alone gives sight beyond the visible.
“He gives sight to the blind and wisdom to the humble.” — Psalms 146
Every tool I build is a prayer in code — that it helps someone trade with clarity, integrity, and precision.
⚡ Zoom In. Focus Deep. Trade Clean.
BK AK-Scope — Lock on the target. See what others don’t.
🔫 Clarity is power. 🔫
Gd bless. 🙏

ES vs Bond ROCThis Pine Script plots the Relative Rate of Change (ROC) between the S&P 500 E-mini Futures (ES) and 30-Year Treasury Bond Futures (ZB) over a specified period. It helps identify when equities are overperforming or underperforming relative to long-term bonds—an insight often used to detect risk-on/risk-off sentiment shifts in the market.

Exponentially Weighted Moving Average Oscillator [BackQuant]Exponentially Weighted Moving Average (EWMA)
The Exponentially Weighted Moving Average (EWMA) is a quantitative or statistical measure used to model or describe a time series. The EWMA is widely used in finance, the main applications being technical analysis and volatility modeling.
The moving average is designed as such that older observations are given lower weights. The weights fall exponentially as the data point gets older – hence the name exponentially weighted.
Applications of the EWMA
The EWMA is widely used in technical analysis. It may not be used directly, but it is used in conjunction with other indicators to generate trading signals. A well-known example is the Negative Volume Index (NVI), which is used in conjunction with its EWMA.
Why is it different from the In-Built TradingView EWMA
Adaptive Algorithms: If your strategy requires the alpha parameter to change adaptively based on certain conditions (for example, based on market volatility), a for loop can be used to adjust the weights dynamically within the loop as opposed to the fixed decay rate in the standard EWMA.
Customization: A for loop allows for more complex and nuanced calculations that may not be directly supported by built-in functions. For example, you might want to adjust the weights in a non-standard way that the typical EWMA calculation doesn't allow for.
Use of the Oscillator
This mainly comes from 3 main premises, this is something I like to do personally since it is easier to work with them in the context of my system. E.g. Using them to spot clear trends without noise on longer timeframes.
Clarity: Plotting the EWMA as an oscillator provides a clear visual representation of the momentum or trend strength. It allows traders to see overbought or oversold conditions relative to a normalized range.
Comparison: An oscillator can make it easier to compare different securities or timeframes on a similar scale, especially when normalized. This is because the oscillator values are typically bounded within a range (like -1 to 1 or 0 to 100), whereas the actual price series can vary significantly.
Focus on Change: When plotted as an oscillator, the focus is on the rate of change or the relative movement of the EWMA, not on the absolute price levels. This can help traders spot divergences or convergences that may not be as apparent when the EWMA is plotted directly on the price chart. This is also one reason there is a conditional plotting on the chart.
Trend Strength: When normalized, the distance of the oscillator from its midpoint can be interpreted as the strength of the trend, providing a quantitative measure that can be used to make systematic trading decisions.
Here are the backtests on the 1D Timeframe for
BITSTAMP:BTCUSD
BITSTAMP:ETHUSD
COINBASE:SOLUSD
When using this script the user is able to define a source and period, which by extension calculates the alpha. An option to colour the bars accord to trend.
This makes it super easy to use in a system.
I recommend using this as above the midline (0) for a positive trend and below the midline for negative trend.
Hence why I put a label on the last bar to ensure it is easier for traders to read.
Lastly, The decreasing colour relative to RoC, this also helps traders to understand the strength of the indicator and gain insight into when to potentially reduce position size.
This indicator is best used in the medium timeframe.

Coppock Curve w/ Early Turns [QuantVue]The Coppock Curve is a momentum oscillator developed by Edwin Coppock in 1962. The curve is calculated using a combination of the rate of change (ROC) for two distinct periods, which are then subjected to a weighted moving average (WMA).
History of the Coppock Curve:
The Coppock Curve was originally designed for use on a monthly time frame to identify buying opportunities in stock market indices, primarily after significant declines or bear markets.
Historically, the monthly time frame has been the most popular for the Coppock Curve, especially for long-term trend analysis and spotting the beginnings of potential bull markets after bearish periods.
The signal wasn't initially designed for finding sell signals, however it can be used to look for tops as well.
When the indicator is above zero it indicates a hold. When the indicator drops below zero it indicates a sell, and when the indicator moves above zero it signals a buy.
While this indicator was originally designed to be used on monthly charts of the indices, many traders now use this on individual equities and etfs on all different time frames.
About this Indicator:
The Coppock Curve is plotted with colors changing based on its position relative to the zero line. When above zero, it's green, and when below, it's red. (default settings)
An absolute zero line is also plotted in black to serve as a reference.
In addition to the classic Coppock Curve, this indicator looks to identify "early turns" or potential reversals of the Coppock Curve rather than waiting for the indicator to cross above or below the zero line.
Give this indicator a BOOST and COMMENT your thoughts!
We hope you enjoy.
Cheers!

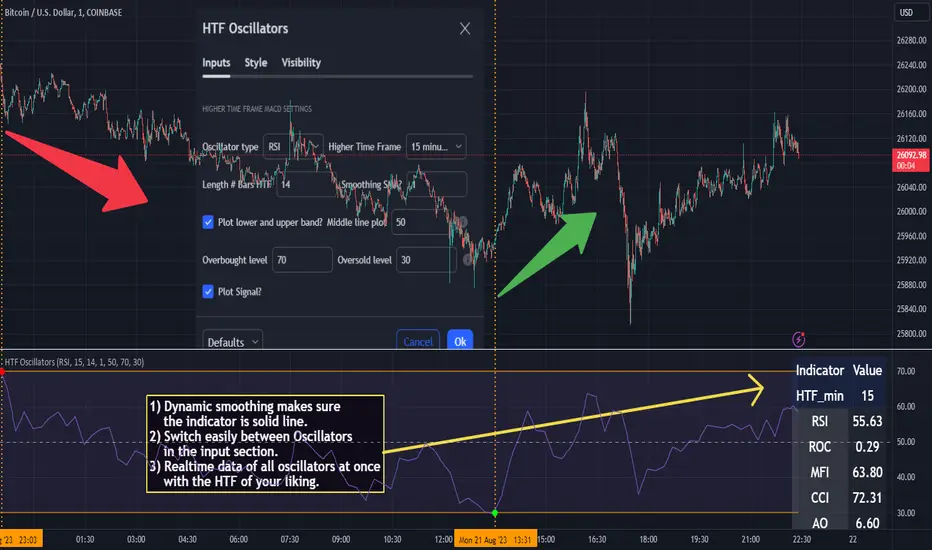
HTF Oscillators RSI/ROC/MFI/CCI/AO - Dynamic SmoothingThe Interplay of Time Frames: A Balanced View
Navigating the markets often involves interpreting trends from multiple angles. The HTF Oscillators with Dynamic Smoothing indicator enables you to do just that. This tool provides the option to integrate smoothed oscillator readings from Higher Time Frames (HTF) into lower time frame charts, such as a 1-minute chart. By doing so, the indicator offers a balanced viewpoint that bridges the gap between micro and macro perspectives, helping you make informed decisions without losing sight of the broader market context.
Features
Multi-Oscillator Support
Choose from a range of popular oscillators like the Relative Strength Index (RSI), Rate of Change (ROC), Money Flow Index (MFI), Commodity Channel Index (CCI), and Awesome Oscillator (AO). These oscillators are commonly used as foundational building blocks in trading strategy scripts by traders worldwide. Switch effortlessly between them, depending on your trading strategy and requirements. To maintain consistency and a familiar user experience, our script adopts the same visual aesthetics that you'll find in Pine Script indicators on TradingView: a sleek purple line for the oscillator and a transparent band filling. These visual elements are not only pleasing to the eye but also widely appreciated by the trading community.
Dynamic Smoothing
The unique dynamic smoothing feature calculates a smoothing factor based on the ratio of minutes between the Higher Time Frame (HTF) and your current time frame. This provides a sleek and responsive oscillator line that still holds the weight of the longer trend. One of the significant advantages of this feature is user experience; when you change your time frame, the HTF-values in your settings will remain consistent. This ensures that you can easily switch between different time frames without losing the insights provided by your selected HTF.
Visual Aids
Visual cues are an essential part of any trading strategy. The indicator not only plots signals to mark overbought and oversold conditions based on the dynamically smoothed oscillator but also provides you with the flexibility to customize your visual experience. You have the option to toggle on/off the display of these signals depending on your specific needs. Additionally, bands can be displayed at overbought and oversold levels, along with a reference middle line. If you switch between different oscillators (available in the parameter settings), remember to manually adjust the bands in the input settings to ensure signals matches with the type of oscillator to your liking.
User-Friendly Settings
We've grouped related settings together, making it easier for you to find what you're looking for. Adjust the oscillator type, length of bars, smoothing settings, and more with just a few clicks.
Information Table
A standout feature of this indicator is the real-time information table, which displays the values of all selected oscillators based on your specified Higher Time Frame (HTF) settings. This can be particularly useful for traders who depend on multiple indicators for their decision-making process. The data presented in the table is synchronized with the HTF options you've configured in the input settings, allowing for a more efficient and quick scan of values from higher time frames.
Educational Corner: The Power of the Information Table and Customization
The table incorporated into this indicator isn't just eye-candy; it's a practical tool designed to elevate your trading strategy. It dynamically displays real-time values of various oscillators for the HTF you've chosen. This is an exemplary use of TradingView's scripting capabilities to blend multiple indicators into a single visual panel, streamlining your analysis and decision-making process.
But here's the best part: You're not limited to what we've created. With some basic understanding of TradingView's scripting language, Pine Script, you can easily adapt this table to include different indicators that suit your unique trading style. The logic in the script is modular and can serve as a foundation for your own customized trading dashboard. So, go ahead, get creative and explore new combinations of indicators that will help you excel in your trading endeavors!
You no longer have to toggle between different charts or indicators to get the information you need; it's all there in one neatly organized table. We encourage you to tap into this feature and make it your own, empowering your trading like never before.
By doing so, you not only gain a more comprehensive toolset, but you also engage more deeply with your trading strategy, understanding its nuances and, ultimately, making more informed decisions.
Conclusion
The HTF Oscillators with Dynamic Smoothing is a versatile and powerful tool that brings together the best of both worlds: the perspective of higher time frames and the granularity of shorter ones. Its feature-rich setting options and real-time information table make it a potential useful addition to your trading toolkit.
Remember, while this indicator offers a comprehensive and smarter way to look at the markets, it is not a foolproof method for predicting market movements. Always use it in conjunction with other analysis methods and risk management strategies.
Ultimate Balance StrategyThe Ultimate Balance Oscillator Strategy harnesses the power of the Ultimate Balance Oscillator to deliver a comprehensive and disciplined approach to trading. By combining the insights of the Rate of Change (ROC), Relative Strength Index (RSI), Commodity Channel Index (CCI), Williams Percent Range, and Average Directional Index (ADX) from TradingView, this strategy offers traders a systematic way to navigate the markets with precision.
The core principle of this strategy lies in its ability to identify optimal entry and exit points based on the movement of the Ultimate Balance Oscillator. When the oscillator line crosses below the 0.75 level, a buy signal is generated, indicating a potential opportunity for a bullish trend reversal. Conversely, when the oscillator line crosses above the 0.25 level, it triggers an exit signal, suggesting a possible end to a bullish trend.
Key Features:
1. Objective Market Analysis: The Ultimate Balance Oscillator Strategy provides a disciplined and objective approach to market analysis. By relying on the quantified insights of multiple indicators, it helps traders cut through market noise and focus on key signals, improving decision-making and reducing emotional biases.
2. Enhanced Timing and Precision: This strategy's entry and exit signals are based on the specific thresholds of the Ultimate Balance Oscillator. By waiting for confirmation through the crossing of these levels, traders can potentially enter trades at opportune moments and exit with greater precision, maximizing profit potential and minimizing risk exposure.
3. Customizability and Adaptability: The strategy offers flexibility, allowing traders to customize the parameters to fit their preferred trading style and timeframes. Whether you're a short-term trader or a long-term investor, the Ultimate Balance Oscillator Strategy can be adjusted to suit your specific needs, making it adaptable to various market conditions.
4. Real-time Alerts: Stay informed and never miss a potential trade opportunity with the strategy's built-in alert system. Set personalized alerts for buy and exit signals to receive timely notifications, ensuring you're always aware of the latest developments in the market.
5. Backtesting and Optimization: Before applying the strategy to live trading, it's recommended to conduct thorough backtesting and optimization. By testing the strategy's performance over historical data and fine-tuning the parameters, you can gain insights into its strengths and weaknesses, enabling you to make informed adjustments and increase its effectiveness.
Trading involves risk. Use the Ultimate Balance Oscillator Strategy at your own discretion. Past performance is not indicative of future results.

Ultimate Balance OscillatorIntroducing the Ultimate Balance Oscillator: A Powerful Trading Indicator
Built upon the renowned Rate of Change (ROC), Relative Strength Index (RSI), Commodity Channel Index (CCI), Williams Percent Range, and Average Directional Index (ADX) from TradingView, this indicator equips traders with an unparalleled understanding of market dynamics.
What sets the Ultimate Balance Oscillator apart is its meticulous approach to weighting. Each component is assigned a weight that reflects its individual significance, while carefully mitigating the influence of highly correlated signals. This strategic weighting methodology ensures an unbiased and comprehensive representation of market sentiment, eliminating dominance by any single indicator.
Key Features and Benefits:
1. Comprehensive Market Analysis: The Ultimate Balance Oscillator provides a comprehensive view of market conditions, enabling traders to discern price trends, evaluate momentum shifts, identify overbought or oversold levels, and gauge the strength of prevailing trends. This holistic perspective empowers traders to make well-informed decisions based on a thorough understanding of the market.
2. Enhanced Signal Accuracy: With its refined weighting approach, the Ultimate Balance Oscillator filters out noise and emphasizes the most relevant information. This results in heightened signal accuracy, providing traders with a distinct advantage in identifying optimal entry and exit points. Say goodbye to unreliable signals and welcome a more precise and dependable trading experience.
3. Adaptability to Various Trading Scenarios: The Ultimate Balance Oscillator transcends the constraints of specific markets or timeframes. It seamlessly adapts to diverse trading scenarios, accommodating both short-term trades and long-term investments. Traders can customize this indicator to suit their preferred trading style and effortlessly navigate ever-changing market conditions.
4. Simplicity and Ease of Use: The Ultimate Balance Oscillator simplifies trading analysis by providing a single line on the chart. Its straightforward interpretation and seamless integration into trading strategies make decision-making effortless. By observing bullish or bearish crossovers with the moving average, recognizing overbought or oversold levels, and tracking the overall trend of the oscillator, traders can make well-informed decisions with confidence.
5. Real-time Alerts: Stay ahead of the game with the Ultimate Balance Oscillator's customizable alert system. Traders can set up personalized alerts for bullish or bearish crossovers, breaches of overbought or oversold thresholds, or any specific events that align with their trading strategy. Real-time notifications enable timely action, ensuring traders never miss lucrative trading opportunities.
The Ultimate Balance Oscillator is a robust trading companion, empowering traders to make shrewd and calculated decisions. Embrace its power and elevate your trading endeavors to new heights of precision and success. Discover the potential of the Ultimate Balance Oscillator and unlock a world of trading possibilities.

Rate of Change Candle Standardized (ROCCS)ROCCS is a standardized rate of change oscillator with "error bars". Rate of change helps traders gauge momentum in a market by comparing the current price with the price "n" periods ago. What makes this special is you get to see the momentum of the momentum via the candle view. The candle transformation utilizes a moving average to smooth the signal however this is only used for the close price. The high and low prices are not smoothed. The moving average has an adjustable period, and so does the standardization.
I hope you can find great use in this upgraded roc indicator.

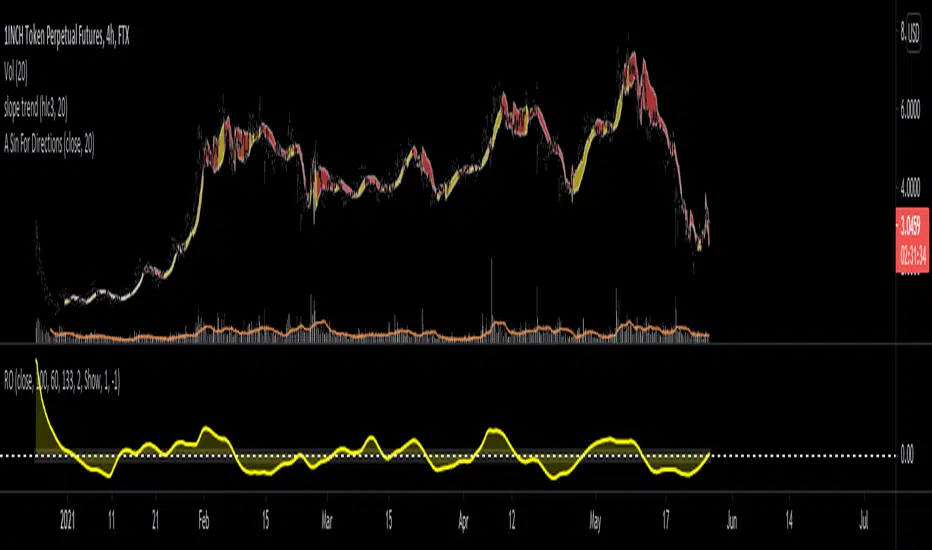
A Sin For Directions ROC Adaptive Length Trend Following In the same family as the slope trend indicator, but with this one being based on the function x - sinx , which mimics prices moving down and up. Using this we use ROC to determine a lower and upper level which will indicate whether not the path is still being followed.
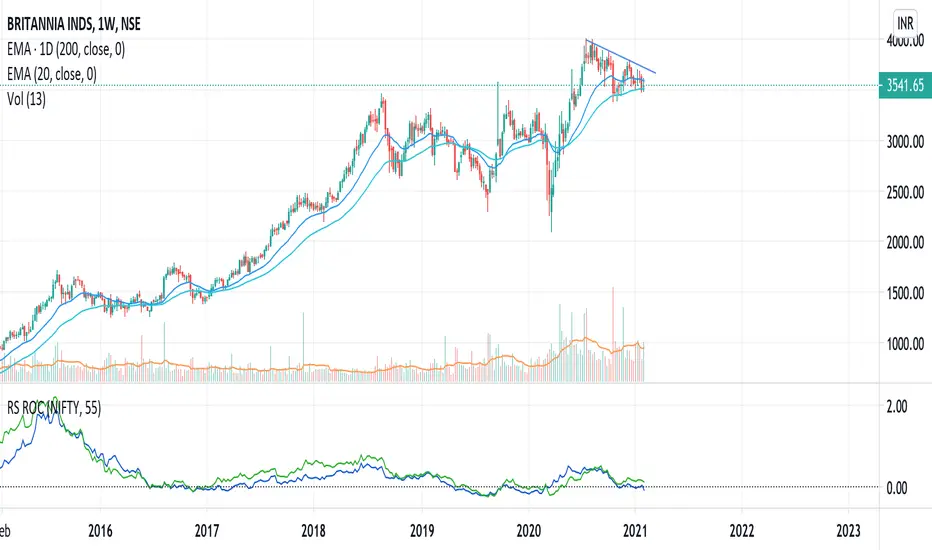
RS.ROC | Relative Strength - Rate of Changes - 4CR CUPFor completeness of Relative Strength studies, the Relative Strength based on rate of changes (ROC) with weighting is coded and presented as well.
The RS.ROC is similar to the formulation of RS by IBD before rank among all the stocks in the market.
The lookback period is relaxed for customizing. Once you set the total lookback period, representing the 4Q, in the indicator, the other shorter lookback periods will be auto-calculated, namely, 1Q, 2Q, 3Q.
A simple moving average of the RS.ROC is also added for your easier analysis on the trend development of the strength.
To use it later at your charting later,
1. Favorite it;
2. Select from your favorite list.

Relative Strength (RS) and Rate of Change (ROC) Combined in oneThis indicator combines Relative Strength and Rate of Change (ROC) in one plot. Change the period and comparative symbol (defaulted to NSE:NIFTY) in settings.
Linda Raschke -2 Period ROCLinda Raschke - Book - Street Smarts High Probability Short Term Trading Strategies - Chapter eight - 2 Period ROC

Custom EMA AngleThis script shows the angle of 6 EMAs to perform trade analysis. The EMA angle is also known as its Rate Of Change ( ROC ). The 6 EMAs (I, II, III , IV, V and VI ) default lengthes come from one of the Fibonacci Phi^3 and Phi^3/2 sub series (17, 34, 72, 144, 305 and 610), but can be changed to any values, particularly to the traditionally used 20, 40, 50, 100, 200 and 300. Up to my knowledge, Fibonacci Phi^3 and Phi^3/2 sub series lengthes were first proposed by Bo Williams.
Angle calculation is performed by calculating the tangent over a delta interval. Normalization is required to make the angle independent of the price range.
This script is meant to be used together with the corresponding EMAs on the candle pane. Non normalized view shows a more realistic angle condition but, if intended to be used with the CEMAS indicator, normalized view should be used.

GMS: RSI & ROC StrategyThis is a basic strategy like the RSI one I posted. This one adds in the Rate of Change indicator as well.
You can separate the two for RSI only and ROC only. Everything else is the same as the RSI strategy.
- Simple moving average trend filter.
- Simple moving average trade exit.
- Both long and short or each on it's own.
The source code should be open if you want to see it or modify it for your own project. I hope it helps!
Andre
Global Market Signals

BlueswimmerdoespineSharing to learn and to help others.
Any feedback on layout/structure/shortcuts will always be appreciated.
Simple indicator for close of candle above or below EMA with ROC and CO acting as a filter.

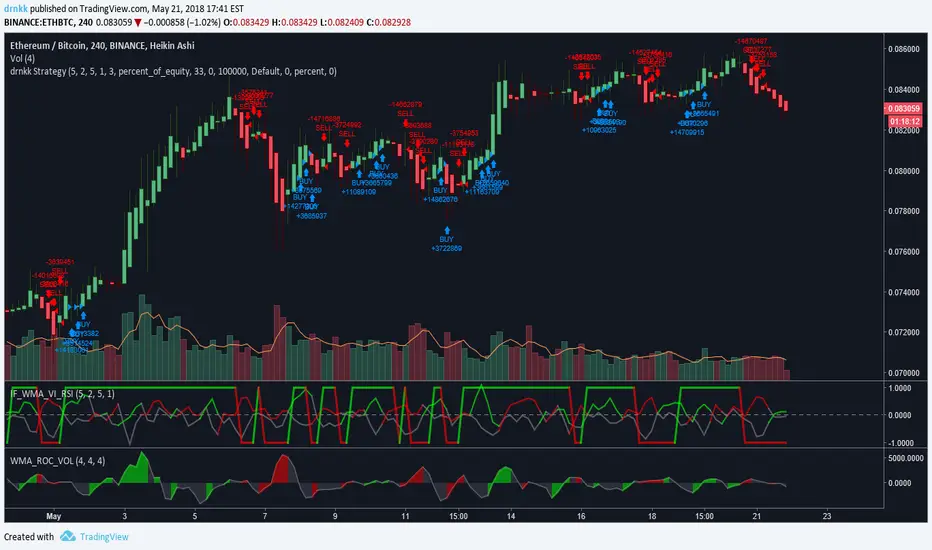
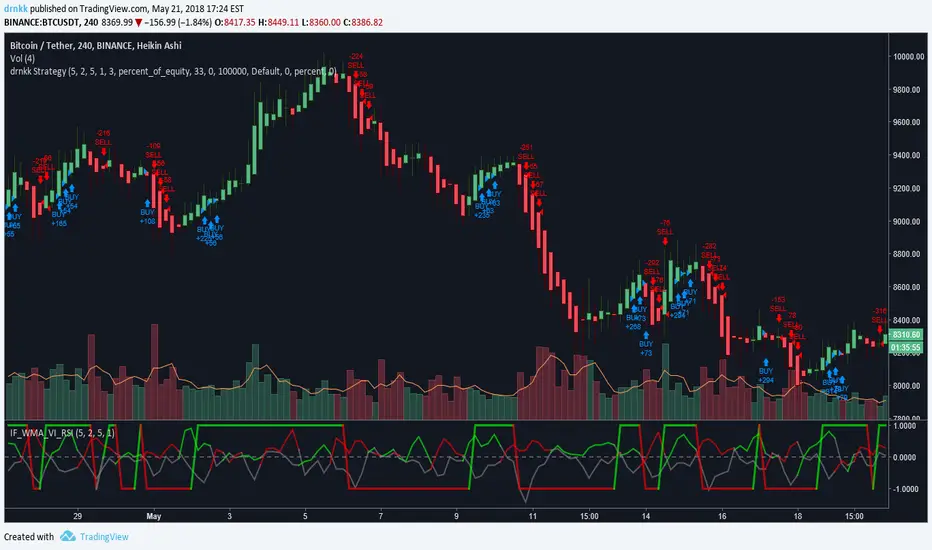
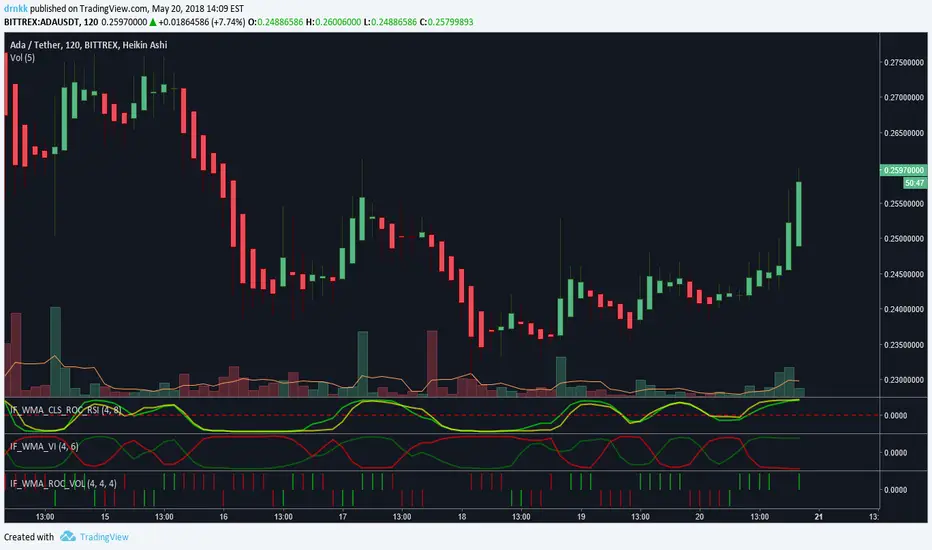
Inverse Fisher WMA Smoothed Price ROC and RSI by drnkkInverse Fisher WMA Smoothed Price ROC and RSI by drnkk
BUY & SELL PRESSURE by RegressionBUY & SELL PRESSURE by Regression Analysis at candle price/volume (Rate-Of-Change)
Ver. 3 By Ricardo M Arjona @XeL_Arjona
DISCLAIMER:
The Following indicator/code IS NOT intended to be a formal investment advice or recommendation by the author, nor should be construed as such. Users will be fully responsible by their use regarding their own trading vehicles/assets.
The embedded code and ideas within this work are FREELY AND PUBLICLY available on the Web for NON LUCRATIVE ACTIVITIES and must remain as is.
WHAT'S THIS?
This is my 3rd. revision of the original implementation for AmiBroker by Karthik Marar's of it's BUY AND SELL PRESSURE INDICATORS but this time, constructed under a complete REGRESSIVE ANALYSIS premise based in Rate Of Change (A kind of Slope but measured in % Performance).
Some minimal adaptation's (and cleaning) have been made:
Instead of simple Range calculation at price, Rate Of Change (Regressive) is used.
Oscillator of Pressure can be deactivated in favor of a simple RoC Cumulative Pressures at candle.
Oscillator can read Volume data from external tickers for accurate Index calculation. ( NYA can use TVOL as example.)
Code is small, cleaner and faster =) !
Cheers!
Any feedback will be welcome...
@XeL_Arjona

Insync Index [LazyBear]BB Support + Histo mode
-------------------------------
Code: pastebin.com
Show enclosing BB
Show Insync as Histo:
v02 - Configurable levels
---------------------------------
Small update to allow configuring the 95/75/25/5 levels.
Latest source code: pastebin.com
v01 - orginal description
---------------------------------
Insync Index, by Norm North, is a consensus indicator. It uses RSI, MACD, MFI, DPO, ROC, Stoch, CCI and %B to calculate a composite signal. Basically, this index shows that when a majority of underlying indicators is in sync, a turning point is near.
There are couple of ways to use this indicator.
- Buy when crossing up 5, sell when crossing down 95.
- Market is typically bullish when index is above 50, bearish when below 50. This can be a great confirmation signal for price action + trend lines.
Also, since this is typical oscillator, look for divergences between price and index.
Levels 75/25 are early warning levels. Note that, index > 75 (and less than 95) should be considered very bullish and index below 25 (but above 5) as very bearish. Levels 95/5 are equivalent to traditional OB/OS levels.
The various values of the underlying components can be tuned via options page. I have also provided an option to color bars based on the index value.
More info: The Insync Index by Norm North, TASC Jan 1995
drive.google.com
List of my free indicators: bit.ly
List of my app-store indicators: blog.tradingview.com
(Support doc: bit.ly)

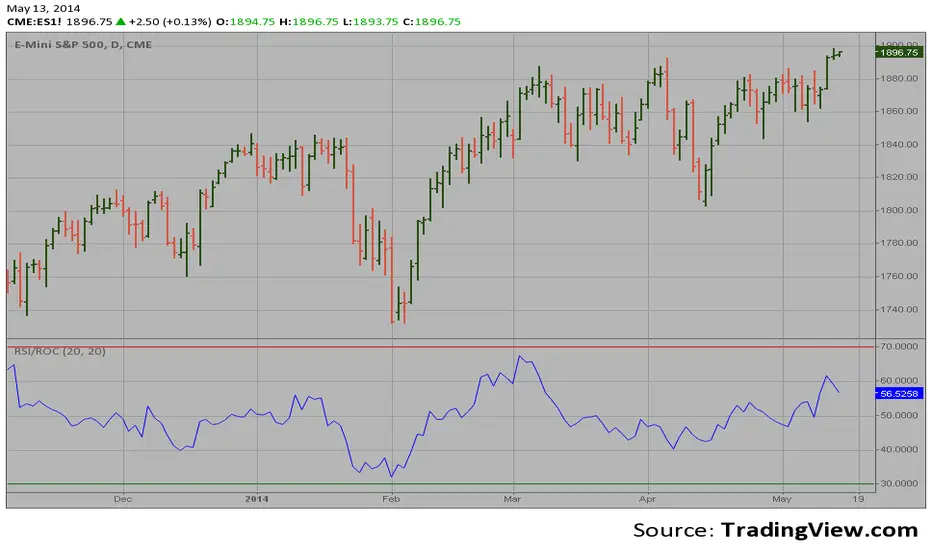
RSI based on ROC This is the new-age indicator which is version of RSI calculated upon
the Rate-of-change indicator.
The name "Relative Strength Index" is slightly misleading as the RSI
does not compare the relative strength of two securities, but rather
the internal strength of a single security. A more appropriate name
might be "Internal Strength Index." Relative strength charts that compare
two market indices, which are often referred to as Comparative Relative Strength.
And in its turn, the Rate-of-Change ("ROC") indicator displays the difference
between the current price and the price x-time periods ago. The difference can
be displayed in either points or as a percentage. The Momentum indicator displays
the same information, but expresses it as a ratio.