Penunjuk Pine Script®
Cari dalam skrip untuk "rsi"

Penunjuk Pine Script®

Penunjuk Pine Script®
Penunjuk Pine Script®

Penunjuk Pine Script®
Penunjuk Pine Script®

Penunjuk Pine Script®

Penunjuk Pine Script®

Penunjuk Pine Script®

Strategi Pine Script®

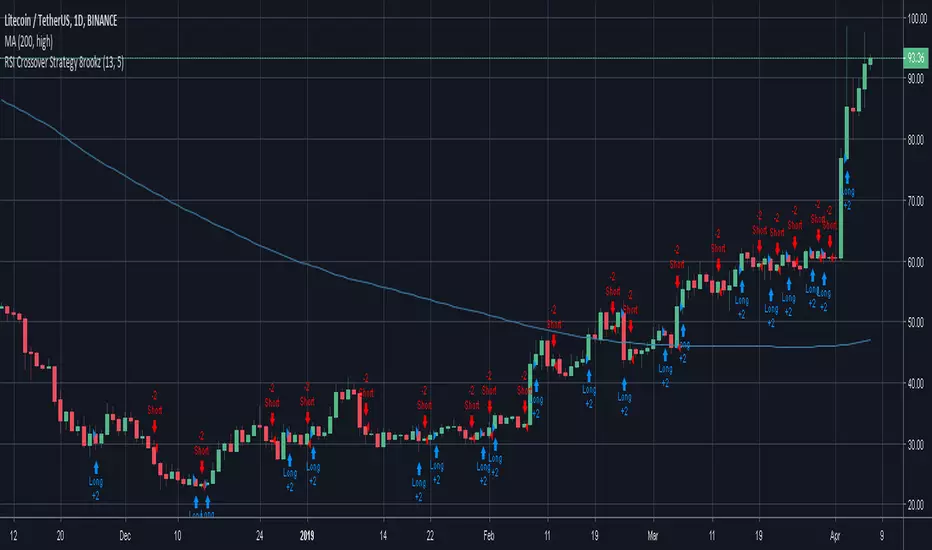
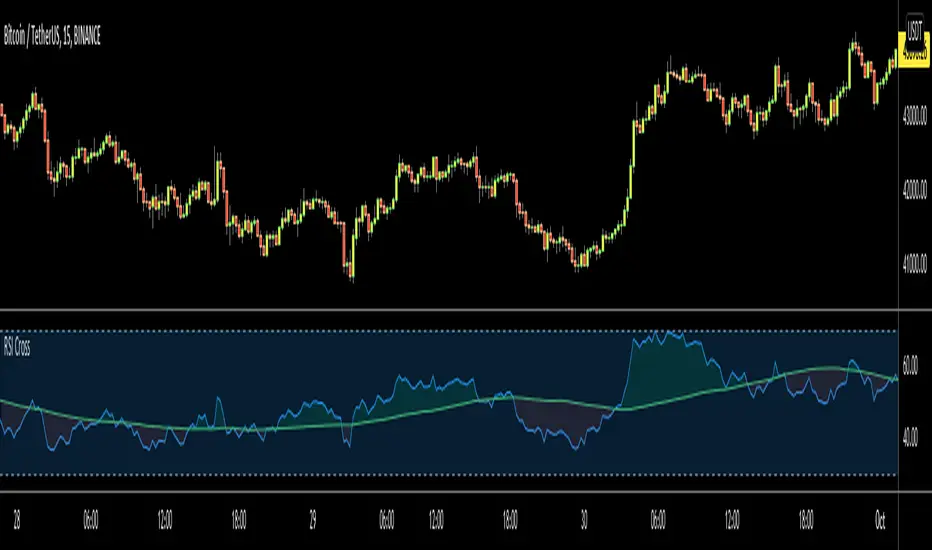
RSI Crossover Strategy 8rookzRSI Crossover Strategy
used to create entry points for increasing relative strength
Strategi Pine Script®
Penunjuk Pine Script®
Penunjuk Pine Script®

Penunjuk Pine Script®
Penunjuk Pine Script®

RSI TRI With Mid Point and HighlightsRSI that has the 50 line plotted plus it highlights overbought and oversold conditions.
Penunjuk Pine Script®

Penunjuk Pine Script®
Penunjuk Pine Script®

Penunjuk Pine Script®

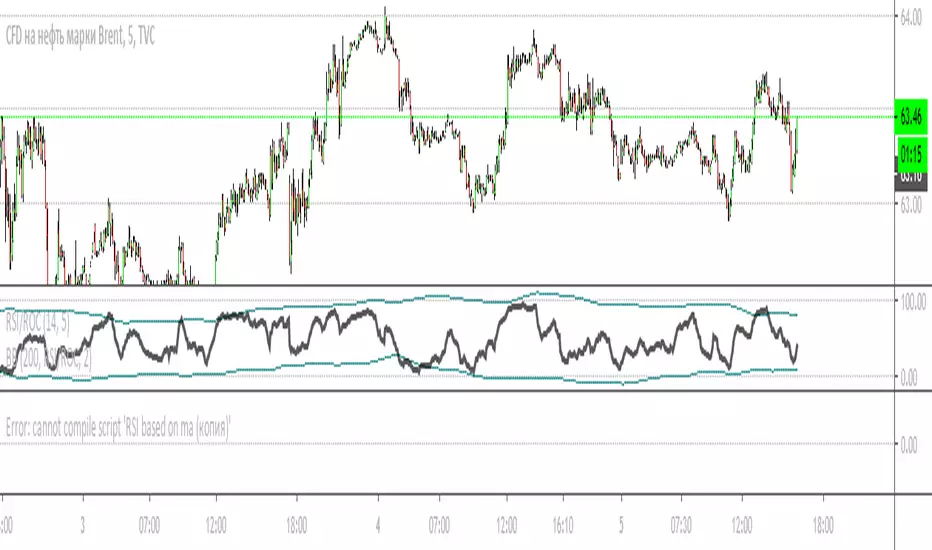
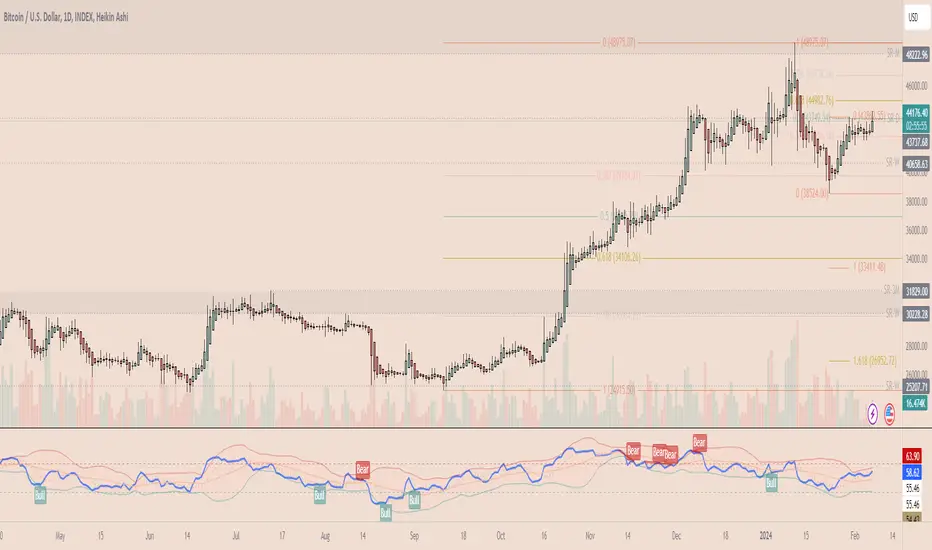
RSI+Bollinger Bands+ EMARSI on pivot points (you can chose the source) with Bollinger Bands and a EMA
Penunjuk Pine Script®

Penunjuk Pine Script®

Penunjuk Pine Script®
RSI Currency Strength IndicatorRSI based currency strength indicator. Other indicators only give 7 currencies, leaving NZD. This one is an updated version which gives all 8 major currencies.
Penunjuk Pine Script®
