Cari dalam skrip untuk "rsi"


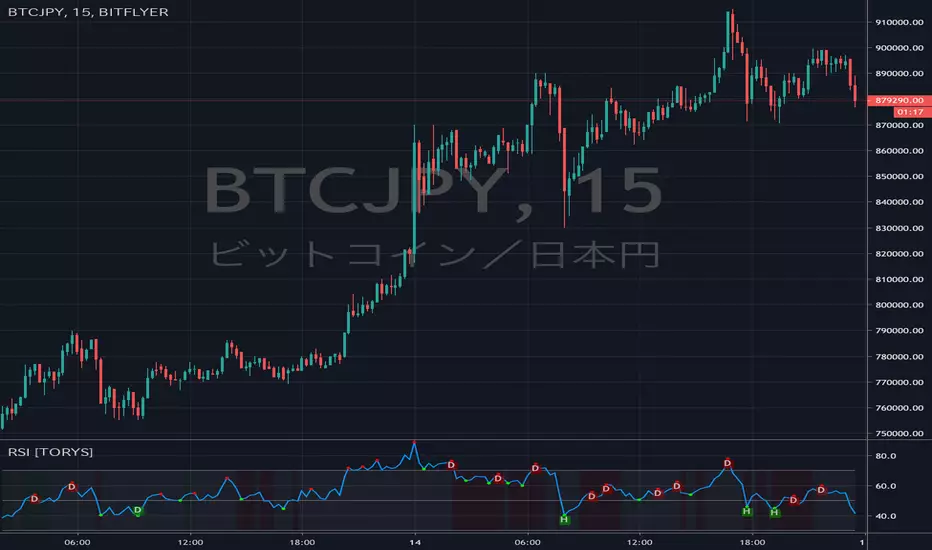
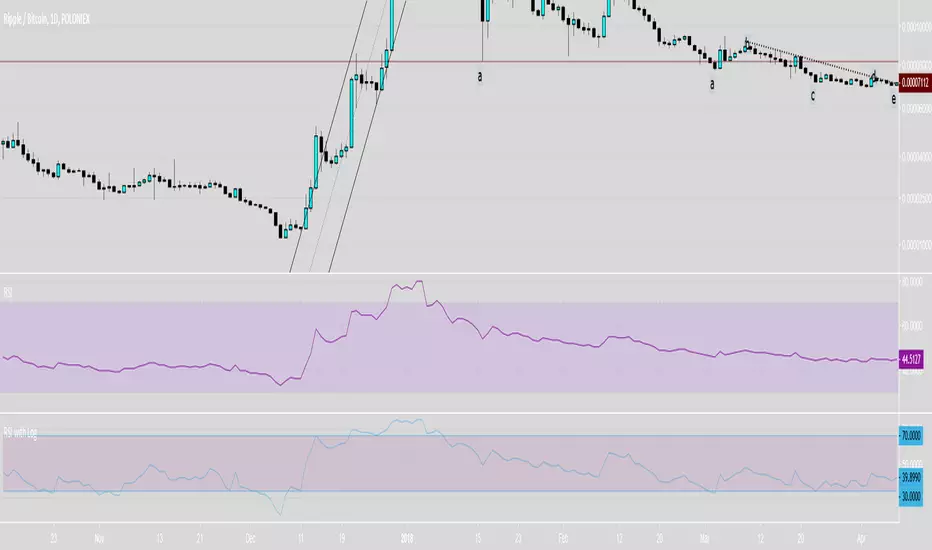
RSI Divergence [TORYS]RSI divergence indicator
green back : suggestion of rising
red back : suggestion of falling

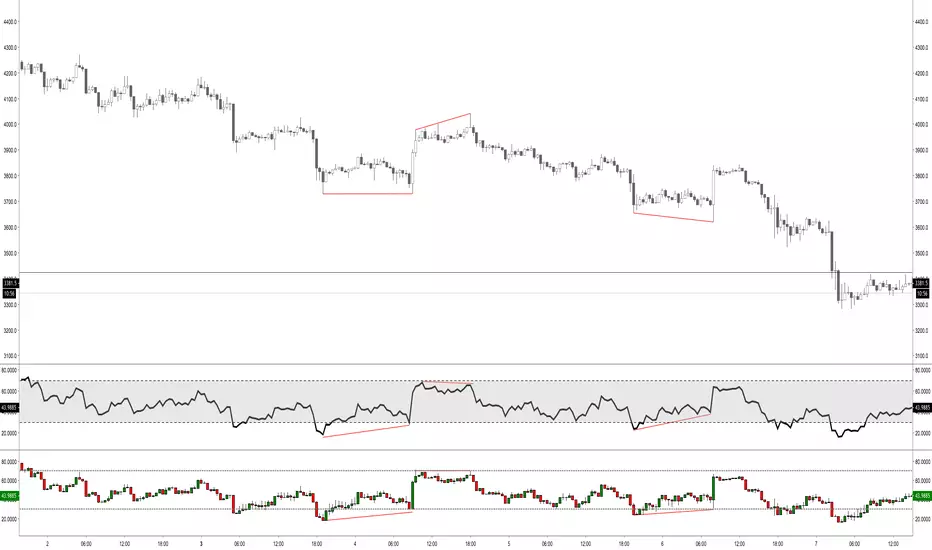
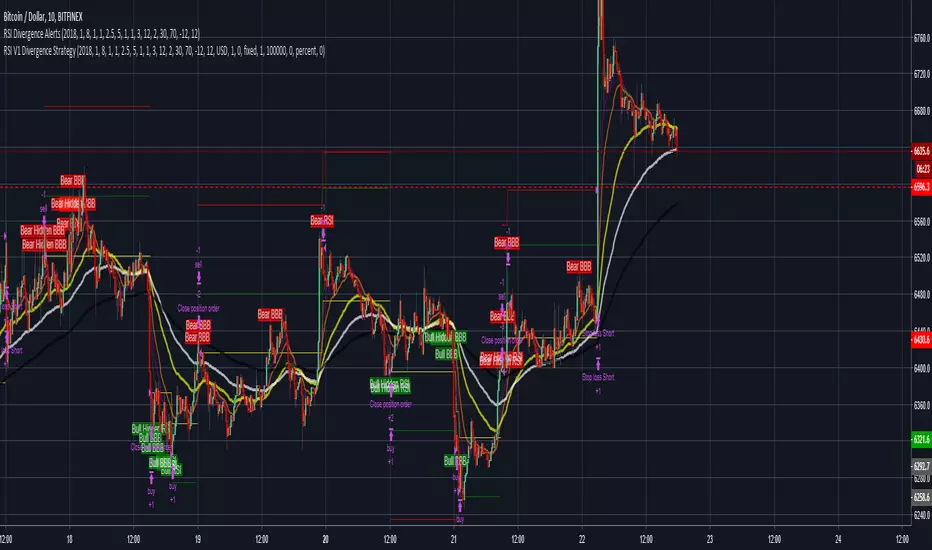
RSI DivergenceRSI Indicator with the following additions:
- highlighting the overbought/oversold conditions
- show divergences


RSI TRI With Mid Point and HighlightsRSI that has the 50 line plotted plus it highlights overbought and oversold conditions.


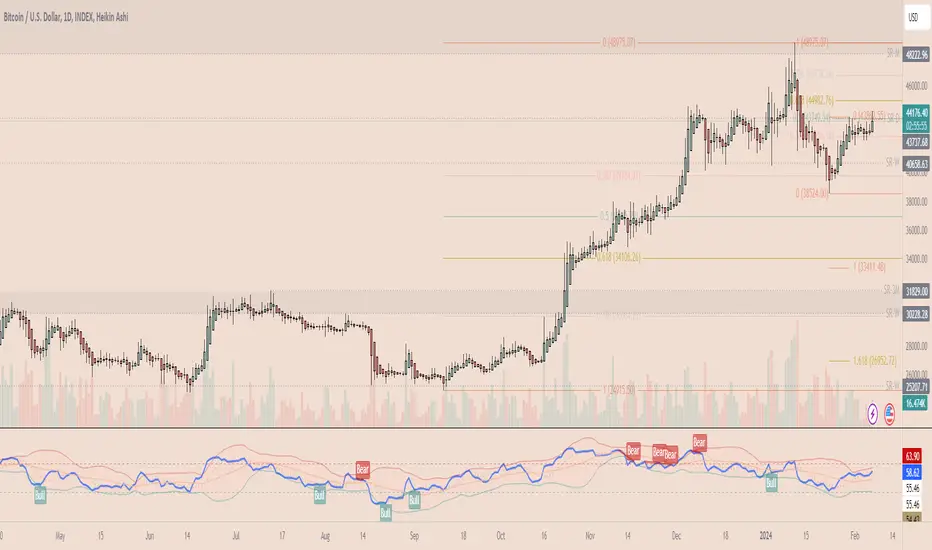
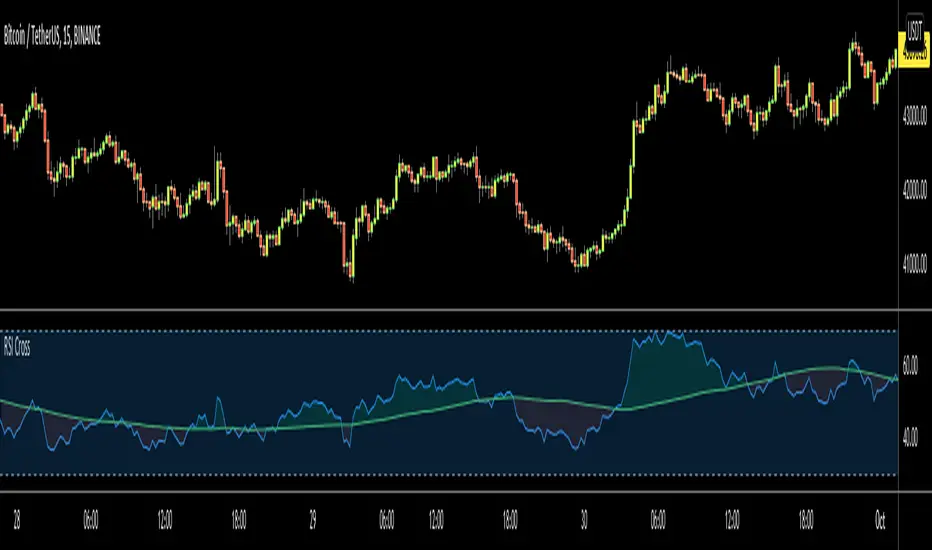
RSI scalperRSI for scalpers and swingers, easily to identify divergence.
Intraday S/R levels (0) for easy trading.
green line = in the money
red line = reconsider your position
For BTC, xbt, altcoins, forex & stocks
Trial version 7 days, contact me


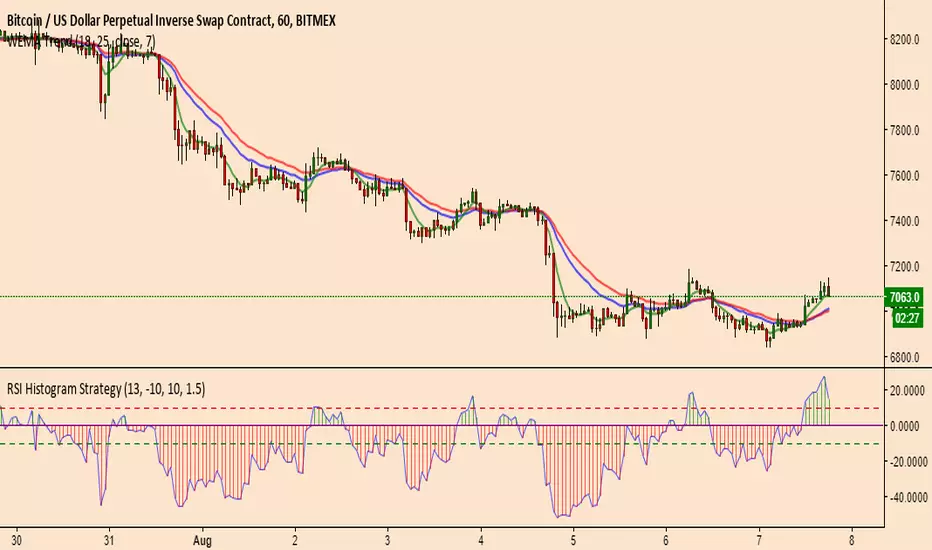
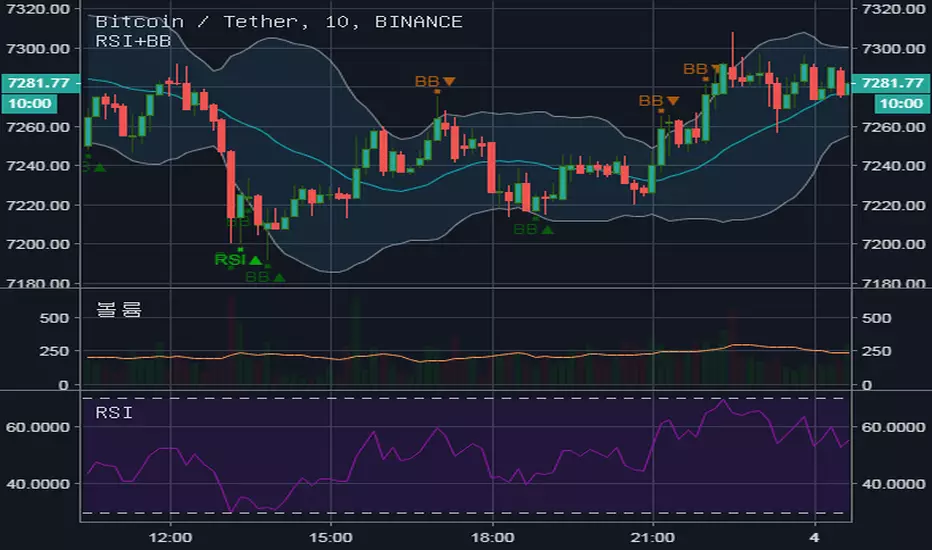
RSI and Bollinger Band simple signal ⓙRSI and Bollinger Band simple signal.
Please, use ten minutes time frame signal for buying.
Please, use shorter time frame signal for selling.
RSI+Bollinger Bands+ EMARSI on pivot points (you can chose the source) with Bollinger Bands and a EMA