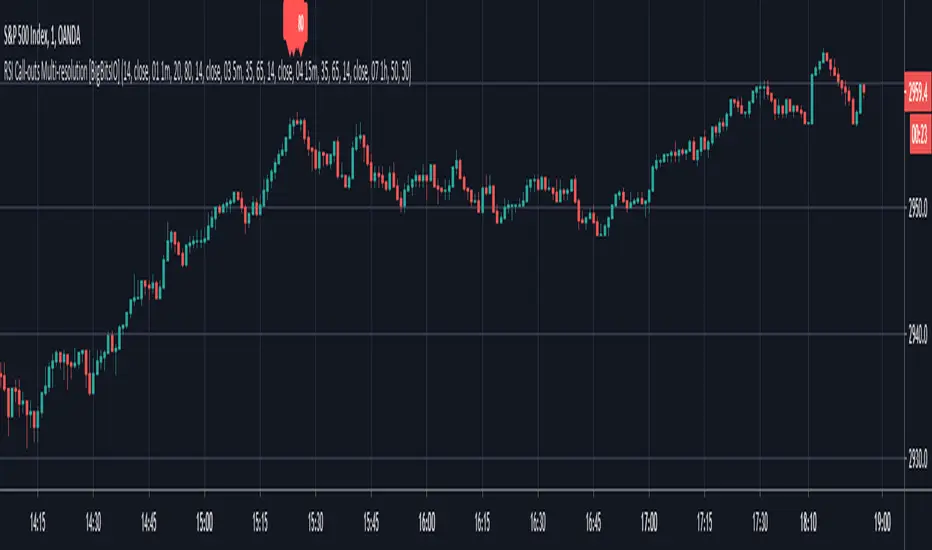
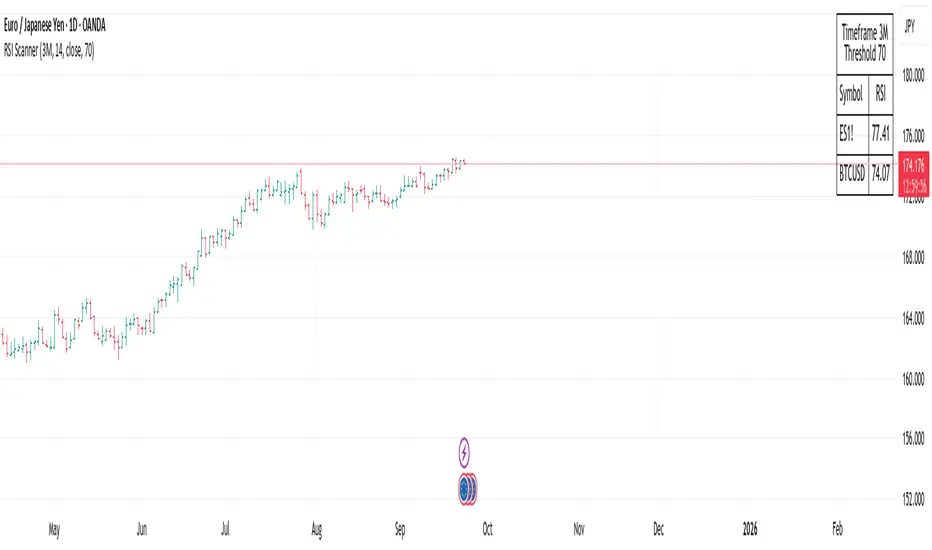
RSI / Stoch / Stoch RSI (SRSI) Overlay [SigmaDraconis]One indicator combining RSI, Stochastic Oscillator and Stochastic RSI in one.
Credits for rwhiteside and his RSI / Stoch RSI Overlay indicator who served as inspiration to all three.
I believe this will be very useful to a lot of people.
If you like, use and i prove to be , you can contribute to my
TIP JAR :
Cari dalam skrip untuk "rsi"
RSI + Stoch/RSIThis is a combination of 2 of the most used indicators. RSI and stochastic/RSI
Ive coded them both to work together to save space on your chart and work as only ONE indicator.
I specifically only use the D line with my rsi , but you have the option to use the K and D line if you so choose.
RSI is good for momentum
Stochastic is good for short term momentum.
They work very well together and if you are a swing trader or scalper they can help immensely when looking for sniper entry areas after you've done you're initial pattern, level, fibonacci and wave analysis.
I like the way this works and have been using these two indicators for a while so I figured I would share.
Happy new year everyone, God bless!
RSI Stochastic Extreme Combo alertThis script will give you red or green columns as an indication for oversold/overbought based upon the rsi and stochastic both being at extreme levels (you set). The default oversold is at 35. If Stochastic and RSI fall below 35, you will get a green column (Both indicators at the extreme). Play with your levels to see how your stock reacts. RSI and Stochastic can both be changed along with each of the levels you would like the color change. I have set mine at RSI low: 37, RSI high: 63, Stoch low: 10, and Stoch high: 90. These levels have been working well for me on AAPL. Enjoy and don't forget to leave a comment if it helps your trading or you have other ideas about what is working for you.
RSI & MACD Exit IndicatorThis indicator is designed to assist traders in identifying potential exit points for long and short trades by combining the Relative Strength Index (RSI) and Moving Average Convergence Divergence (MACD).
Unlike traditional indicators that provide entry signals, this script is specifically optimized for exit strategies, helping traders manage their positions efficiently.
How It Works
The script identifies potential exit points based on the following conditions:
🔴 Exit Long:
- RSI crosses above the user-defined overbought threshold (default: 65).
- MACD crosses below the signal line (bearish crossover).
🟢 Exit Short:
- RSI crosses below the user-defined oversold threshold (default: 35).
- MACD crosses above the signal line (bullish crossover).
When these conditions align, a label appears on the price chart indicating an exit point.
Key Features
- Customizable RSI & MACD Settings – Adjust lengths and thresholds to suit your strategy.
- ATR-Based Adjustments – The script incorporates an ATR multiplier for dynamic signal adjustments based on market volatility.
- Clear Visual Labels – Exit points are clearly marked on price candles.
- Color-Coded Background – Highlights buy/sell zones for quick identification.
- Alerts for Exit Signals – Receive notifications when exit conditions are met.
- Clean Chart Design – The MACD plots are placed below the main chart to avoid clutter.
How to Use
⚠ This indicator is for exits only and does not generate buy/sell entry signals.
For long trades: When an Exit Long signal appears, traders may consider closing or reducing their long positions.
For short trades: When an Exit Short signal appears, traders may consider closing or reducing their short positions.
ATR Settings: Users can adjust the ATR multiplier to fine-tune the signal frequency based on market conditions.
Important Notes
- This indicator does not guarantee future performance—it should be used alongside other analysis methods.
- No financial advice – Always use proper risk management.
- TradingView users who do not read Pine Script can still fully utilize this script thanks to the detailed signal labels and alerts.
💡 Developed with advice from @CoffeeshopCrypto based on user feedback.
RSI-EMA Signal by stock shooter## Strategy Description: 200 EMA Crossover with RSI, Green/Red Candles, Volume, and Exit Conditions
This strategy combines several technical indicators to identify potential long and short entry opportunities in a trading instrument. Here's a breakdown of its components:
1. 200-period Exponential Moving Average (EMA):
* The 200-period EMA acts as a long-term trend indicator.
* The strategy looks for entries when the price is above (long) or below (short) the 200 EMA.
2. Relative Strength Index (RSI):
* The RSI measures the momentum of price movements and helps identify overbought and oversold conditions.
* The strategy looks for entries when the RSI is below 40 (oversold) for long positions and above 60 (overbought) for short positions.
3. Green/Red Candles:
* This indicator filters out potential entries based on the current candle's closing price relative to its opening price.
* The strategy only considers long entries on green candles (closing price higher than opening) and short entries on red candles (closing price lower than opening).
4. Volume:
* This indicator adds a volume filter to the entry conditions.
* The strategy only considers entries when the current candle's volume is higher than the average volume of the previous 20 candles, aiming for stronger signals.
Overall:
This strategy aims to capture long opportunities during potential uptrends and short opportunities during downtrends, based on a combination of price action, momentum, and volume confirmation.
Important Notes:
Backtesting is crucial to evaluate the historical performance of this strategy before deploying it with real capital.
Consider incorporating additional risk management techniques like stop-loss orders.
This strategy is just a starting point and can be further customized based on your trading goals and risk tolerance.
RSI with SMA and DisplacementThis RSI contains SMA 50 (which can be edited). Same SMA Line is displaced 10 rsi points above and below.
One can study crossing of rsi with these lines and where rsi taking support or experiencing resistance on these lines and build unique strategy.
RSI + ADX + MACDINDICADOR COMBINADO DE RSI + ADX
Aprovecha las ventajas de cada indicador en uno solo.
Teniendo en un solo indicador el momentum de cada tendencia y la fuerza relativa con sus puntos de sobre compra y sobre venta.
También al poder analizar divergencias en el indicador oscilador RSI y poder crear estrategias de entrada con el ADX
-------------------------------------------------------------------------------------------------------------------------------------------------------------------------------
RSI + ADX COMBINED INDICATOR
Take advantage of each indicator in one.
Having in a single indicator the momentum of each trend and the relative strength with its points of overbought and oversold.
Also by being able to analyze divergences in the RSI oscillator indicator and being able to create entry strategies with the ADX
DERECHOS DEL CREADOR PARA: Dvd_trading
RSI Trending with DivergencesThis script uses the RSI and RSI divergences to mark signals where the rsi is both below/above the 50, below/above its moving average, and where the last regular or hidden divergence matches that state. The RSI is built into the indicator, so you don't need it in your bottom pane if you don't want it, I just put one there for illustrative purposes. Please note it will not print the same signal consecutively, as it is meant to show an overall direction, not the in and out fluctuations. I suggest using it in conjunction with some moving averages so you can ignore signals not in the trend.
RSI Multi Length With Divergence Alert [Skiploss]This is a modified indicator base code from RSI Multi Length and we will add some of functions by finding a classic/hidden divergence and alert.
The indicator returns information over RSI using multiple periods and calculates the percentage of overbought and oversold by overbought divided by oversold.
To find the divergence and hidden divergence we use base code from platform (Divergence Indicator) but change the input from normal to the average (RSI Multi Length).
RSI Settings
Maximum Length is maximum period.
Minimum Length is minimum period.
Overbought Level is value of the overbought level .
Oversold Level is value of the oversold level.
Source is input source of the indicator.
Divergence Settings
Pivot Right is value look back to the right side.
Pivot Left is value look back to the left side.
Max Range is maximum range value.
Min Range is minimum range value.
Alert Settings
It will be part of display of Divergence and Hidden Divergence.
Style Settings
Color of overbought/oversold/Bullish/Bearish which you can change as you wish.
RSI adjusted SuperTrendThis script is a variation on the SuperTrend.
The original function is from Tradingview, the difference is that I added a calculation with RSI
First 50 is subtracted from the RSI.
The absolute value of this number is on its turn divided with 100 or 50 (settings: 'Divide RSI value by')
-> this gives the 'aRSI', which is similar to a percentage
Finally a last calculation is made:
- lower * 'aRSI' is subtracted from the lower band
- upper * 'aRSI' is added to the upper band
If you want to see the Regular ST -> Toggle 'Show Regular ST'
Settings:
- factor (for both SuperTrends)
- ATR length (for SuperTrends)
- RSI length (for 'RSI adjusted SuperTrend')
Cheers!
RSI Highs and LowsENG
RSI is usually used with closes but sometimes traders need to find out exact lows and highs while trading, therefore this script is written.
Green plot is the RSI value according to highs and red plot is the RSI value according to lows.
TR
RSI genellikle mum kapanışlarına göre kullanılıyor ama bazen alım satım yaparken en dip ve en tepeleri yakalamak istersek kapanışlara değil de bu en yüksek ve en düşük mum değerlerine ihtiyacımız oluyor. Bu nedenle bu kod yazılmıştır.
Yeşil grafik - en yükseklere göre
Kırmızı grafik - en düşüklere göre
RSI Momentum Acceleration by TartigradiaPlots the momentum acceleration oscillators from price and RSI, rescaled and with areas above/below highlighted.
Usage: in a nutshell, when the background is yellow, it's bearish (RSI decelerates faster than price), whereas when the background is green, it's bullish (RSI accelerates faster than price). It appears to detect early some reversals that are otherwise difficult to detect.
Note: it supports using any other indicator's output as the second source input, instead of RSI. PineScript does not allow for more than one source to receive input from other indicators, all the others must only use price as an input.
This indicator uses the core routine to calculate Momentum Acceleration Oscillators by DGT:
This indicator is based on the idea of stinkbug : "RSI is a good momentum indicator showing how excited ppl are on a move, this is why divergences on it work so well. I would like to see the change accelerating or slowing on a move up or down.."
RSI + MA, LinReg, ZZ (HH HL LH LL), Div, Ichi, MACD and TSI HistRelative Strength Index with Moving Average, Linear Regression, Zig Zag (Highs and Lows), Divergence, Ichimoku Cloud, Moving Average Convergence Divergence and True Strength Index Histogram
This script is based on zdmre's RSI script, I revamped a lot of things and added a few indicators from ParkF's RSI script.
Disable Labels in the Style tab and the histogram if you don't enlarge the indicator and it seems too small.
Look to buy in the oversold area and bounce of the support of the linear regression.
Look to sell in the overbought area and bounce of the resistance of the linear regression.
Look for retracement to the moving average or horizontal lines, and divergences for potential reversal.
RSI
The Relative Strength Index (RSI) is a well versed momentum based oscillator which is used to measure the speed (velocity) as well as the change (magnitude) of directional price movements.
Moving Average
Moving Average (MA) is a good way to gauge momentum as well as to confirm trends, and define areas of support and resistance.
Linear Regression
The Linear Regression indicator visualizes the general price trend of a specific part of the chart based on the Linear Regression calculation.
Zig Zag (Highs and Lows)
The Zig Zag indicator is used to identify price trends, and in doing so plots points on the chart to mark whenever prices reverse by a larger percentage point than a predetermined variable or marker.
Divergence
The divergence indicator warns traders and technical analysts of changes in a price trend, oftentimes that it is weakening or changing direction.
Ichimoku Cloud
The Ichimoku Cloud is a package of multiple technical indicators that signal support, resistance, market trend, and market momentum.
MACD and TSI Histogram
MACD can be used to identify aspects of a security's overall trend.
The True Strength Index indicator is a momentum oscillator designed to detect, confirm or visualize the strength of a trend.
RSI Candle with Connors RSI and Heikin Ashi (CRSICHA)This script was designed to work and feel like the built in RSI script but with a lot of added feature that traders might enjoy. You get to see the RSI represented as candle sticks OR Heikin Ashi. I have added in Connors RSI as a bonus so you can see what this lesser used study looks like in candle form. Just like in the original script I have moving averages and Bollinger Bands. I must say, Heikin Ashi really excells in this situation because you don't need to know an exact price! As always I hope every one finds this useful! Enjoy!
RSI OverlayThis is the stock RSI index using the Price as the midline.
It can be useful to view information normally displayed in a second pane overlaid on the price chart. As far as I know, this has not been done for one of the most widely used indicators, the Relative Strength Index.
This can be overlaid anywhere on the chart and every parameter is variable. If you'd like to change the position, the RSI, midline, upper line, and lower line are scaled with a factor "*close/x"
To change the position on the chart, simply change the "X" until you are pleased with the location.
The RSI MA was distracting so I removed it. I also published this indicator including the MA, titled "RSI Overlay with MA."
RSI Divergence Fast by RSUAdvantages:
1. When rsi is at a high point, once it falls by 1 k line, it will detect the divergence from the previous high point. This can quickly find the divergence that has taken effect and help you quickly capture the trend before a sharp decline or rise.
The difference between other RSI divergence indicators: the official divergence indicator is to detect the 5 and the k line, which may lead to a large amount of decline.
2. This indicator detects the previous high and the previous low of 5, 10, 20 lengths at the same time, instead of only detecting a fixed length, so that more deviations can be found.
Notice:
Because it is a quick divergence detection, it is recommended to confirm that the divergence takes effect after the current k is completely closed first. I have identified this state in the indicator as "k not end"
Disadvantages and Risks
Since it is a quick discovery, there will be error identification. I listed the difference between the two indicators when deleting errors. The indicator turns off the "delete error" option by default.
Please do not:
Don't go short in the uptrend, don't go long in the downtrend.
Top divergences that occur because of a strong uptrend are usually only temporary pullbacks. Bottom divergences in persistent declines are also temporary rallies. Do not attempt to trade such low-return trades.
It is recommended to use the divergence indicator when the stock price has made a new high and retraced, and once again made a new high, because this often leads to the end of the trend.
Divergence how to use:
1. After the previous K line was completely closed, a bottom divergence was found.
2. Open an long order at the beginning of the second bar, or as close to the bottom as possible (because the stop loss will be smaller).
3. Break the stop loss price below the previous low where the divergence occurred, which already means that the divergence is wrong.
RSI usage:
1. RSI is above the 50 line, in an uptrend, below 50 in a downtrend.
2. Above 70 is overbought, falling below the oversold zone may mean the end of the uptrend.
Below 30 is oversold, above the oversold zone may mean the end of the downtrend.
[_ParkF]RSI Divergence_overlayRSI Divergence_overlay
Does not include RSI indicator.
Up Signal = Displayed green dot below the candle
Down Signal = Dispalyed red dot above the candle
* Don't trade just at the signal
RSI 다이버전스
RSI 지표 미포함.
상승 신호 = 초록색 점으로 캔들 아래 표시.
하락 신호 = 빨간색 점으로 캔들 위에 표시.
* 신호만 보고 매매하지 마세요
INVEST BTC RSI (from @tradinglord)RSI VERSION - no alerts
The script highlight point of interest for investors using EMA , RSI and a bit of criticism.
The script is built to be used on a weekly timeframe
When RSI is bellow 35 it can be interesting to invest in BTC , on the opposite when it is above 80 can be where to take a bit of profits.
Also using EMA to flow with the power of the trend or change your bias depending on conditions.
Feel free to use the included alerts to be informed when RSI is telling you something.
The idea is quite simple, and you will not gain x100 your investment, but with these kind of investments and some patience you could make your way out.
Obviously not financial advice, understand what you are doing.
"Sometimes it's better to be rational monkey than a greedy baboon" - Tradinglord 2022
RSI DoubleJust another RSI indicator with a plus: shows the current symbol RSI in black plus another symbol RSI in blue.
This is useful for example if you are trading alt-coins and you want to see also the RSI of Bitcaoin as reference, or is you are trading forex and want to see another index...
See my other scripts in: es.tradingview.com
Panel RSI MACD DMI//RSI
//--Default length : 14
//--RSI > 70 : Background is RED
//--RSI < 30 : Background is GREEN
//--RSI Between 30 and 70 : Background is BLUE
//MACD
//--Default: 12,26,9
//--MACD cross above Zero Line / Signal Line : Background is GREEN
//--MACD cross below Zero Line / Signal Line : Background is RED
//--Others condition : Background is BLUE
//DMI
//--Default: 14, 14
//--ADX > 20 : Text is GREEN
//--ADX < 20 : Text is RED
//--DI+ > DI- : Background is BLUE
//--DI- > DI+ : Background is YELLOW
RSI TableIt prints the RSI values for all timeframes in tabular format.
Gives overall picture of RSI in all timeframes.
We can compare with RSI value of one stock to another ( like comparing its index performance vs stock performance in terms of RSI).
Note: This is designed to work with 5 min timeframe. When switching to higher timeframes then lower timeframe values would be incorrect. Kindly use it for 5 min timeframe or lower.
RSI of MACD Strategy [Long only]This strategy uses the RSI on MACD indicator.
BUY
====
When RSI indicator crossing over 30 or 35 line and price above slow ema
Note: when the position already taken, you may reenter on the purple candle
Partial Exit
==========
Partial profit taking option is available in settings. If this is selected , 1/3 position exited when RSI indicator crossing down 80 line
Close
=====
When RSI indicator crossing below 15
Stop Loss
=========
I havent used hard stop loss in this strategy. Reason is , when price going down , indicator may go up ... so just wanted to ride along with indicator ...
Stop loss mentioned in the settings is used in calculation of how many units can be be purchased based on risk level
Tested with SPY and QQQ ETFs on hourly chart
Warning
=========
For the eductional purposes only ...
This is not a financial advise. please do your own research before taking any trading decission
RSI Tops and BottomsHello Traders
This script finds Tops when RSI is in overbought area or Bottoms when RSI is in oversold area and checks the divergence between them. it checks divergence at tops/bottoms after RSI exited from OB/OS areas.
You can change overbought / oversold levels.
You can limit the time that RSI is in OB/OS area with the option "Max Number of Bars in OB/OS"
you can set the minimum/maximum distances between Tops/Bottoms with the options "Min Number of Bars between Tops/Bottoms" and "Max Number of Bars between Topss/Bottoms"
and you can set the color and line widths as you wish.
These tops or bottom must be sequential, means there mustn't be another top while checking tops or bottom while checking bottoms between them.
in next example you can see valid and invalid bottoms:
After you got signal then you better use Stop Order, a few pips higher than the high of colored candle for long positions, ( vise versa in short positions ). so you may escape from traps. ("Stop order" is filled when the price reached a pre-specified price. for example the price is now 10.0 and you set Buy Stop Order at 11.0 then if price reaches 11.0 then your buy order get filled. you can put stoploss a few pips lower than the low of colored candle or you can use ATR to decice stoploss level. how you wish)
For example in following screenshot you can see that buy stop order was not filled and you didn't take long position.
Enjoy!