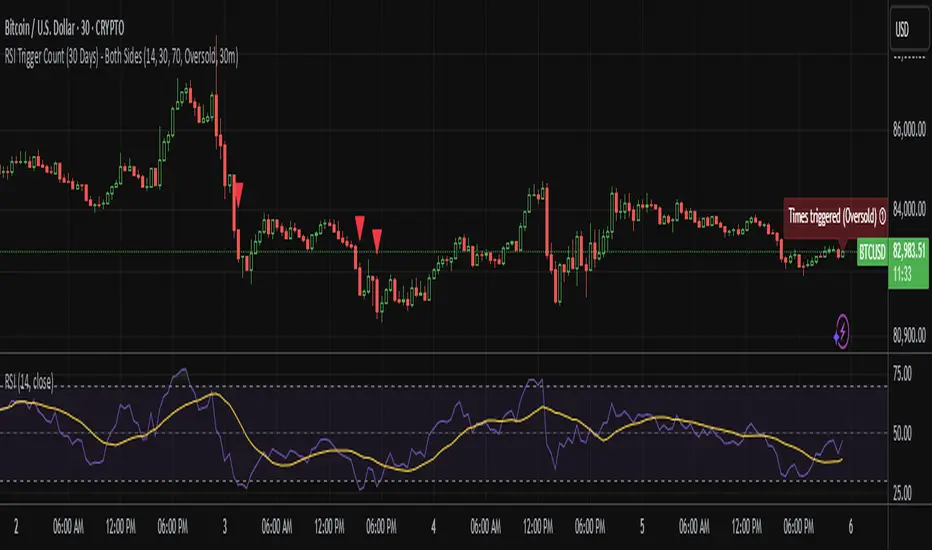
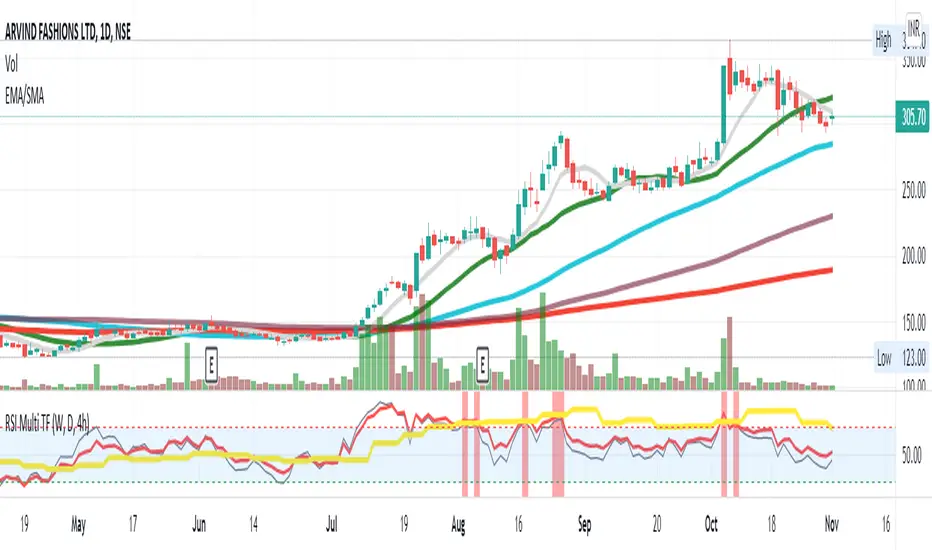
RSI with 2-Pole FilterA momentum indicator that tells you if a stock is overbought or oversold.
RSI goes between 0 and 100.
70 = overbought (might fall)
<30 = oversold (might rise)
It often looks jagged or choppy on volatile days.
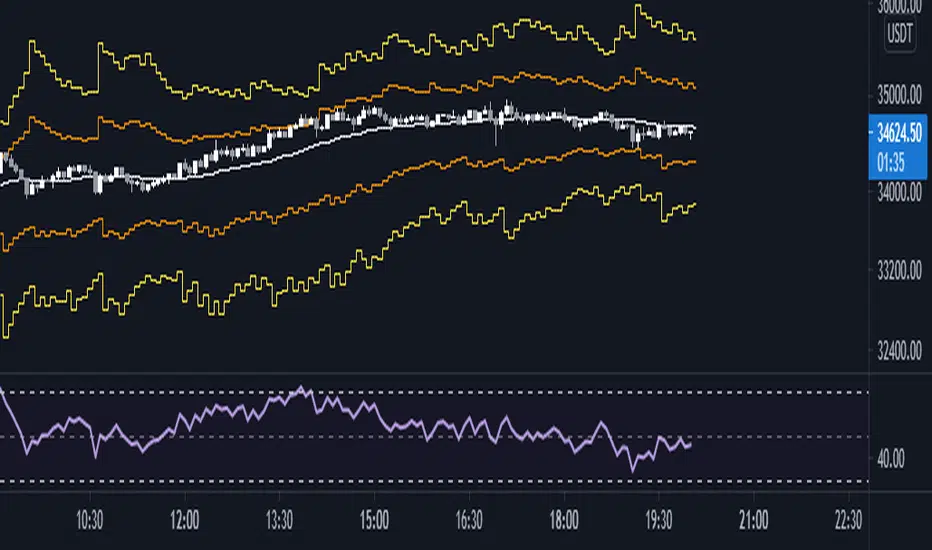
Think of this filter like a momentum smoother:
It still follows RSI closely,
But it doesn’t react to every little jiggle in price,
Which helps avoid false signals.
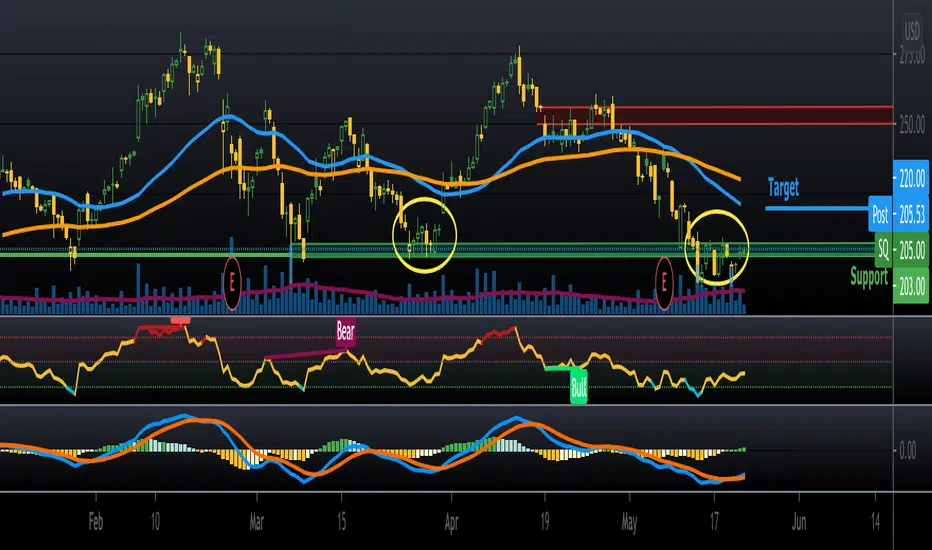
it keeps track of:
The current RSI,
The last 2 RSI values (inputs), and
The last 2 outputs (filtered RSIs).
It uses feedback to shape the output based on previous values, making it smoother than a simple moving average.
Penunjuk Pine Script®