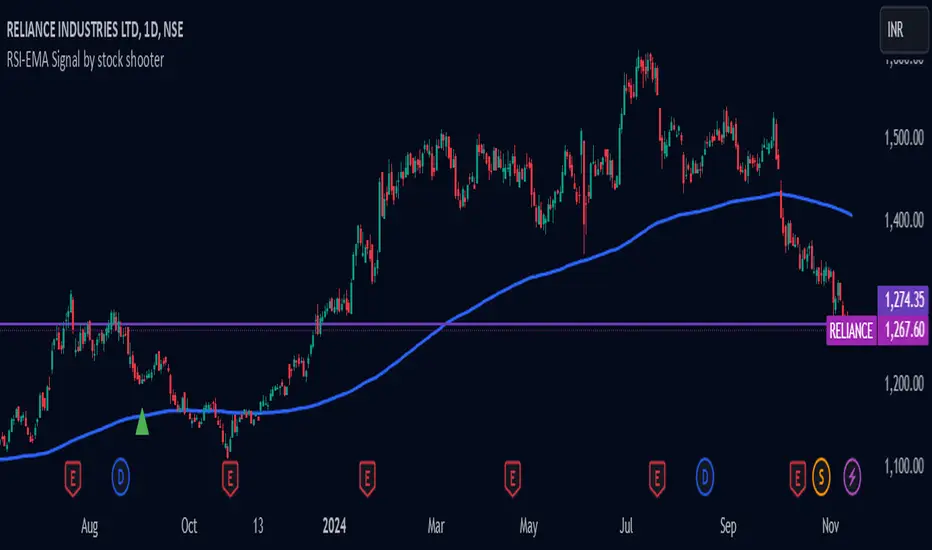
RSI+BSIThis script simply plots the current instruments RSI as well as Bitcoin's RSI from bitfinex. Helpful to identify when an alt is performing stronger than BTC or if BTC is dragging the alt down.
Cari dalam skrip untuk "rsi"
RSI & RVI OB/OS Alert ArrowThe script shows arrows on bars that are in overbought or oversold, based on the set parameters of Relative Strength Index ( RSI ) and Relative Volatility Index (RVI).
Also there is a universal allert, which includes both conditions - overbought and oversold.
You can change the period of RSI and RVI, as well as the upper and lower boundaries of these indicators.
rsi+ichmokunssoholik learned this idea and i made it in TV.
the thick line is RSI.
thin lines are from ichmoku standard(base), turning
sell when the RSI color changed to red(or yellow)
buy when the RSI color changed red to green(or yellow)
-----------
nssoholik 님의 요청으로 만들었습니다.
두꺼운 선의 색이 변하는 순간에 매매하는 것입니다. 녹색으로 변해갈때 사고, 빨강으로 변해갈 때 팝니다.
RSI+ Overbought/Sold IndicatorThis is a very simple script that plots signals on the chart whenever the RSI crosses the given threshold. Nothing fancy, but it is useful for deciding when to exit trades or prepare for pullbacks or for confirming that the market is currently in the middle of an extremely impulsive move or trend. It has alert functionality and you can set the overbought/sold thresholds and RSI length in the options menu.
Note: I definitely wouldn't recommend using it to enter trades unless you're an experienced counter-trend trader :)
Regards -
Matt.
RSI featuring MACD on the Relative Divergence IndexHello Traders,
This Indicator uses RSI output to form a MACDish type of indicator.
Raw RSI output is smoothed with a linear regression curve to form the indicator line.
The signal line is a simple moving average of the same output, the histogram or momentum is the difference between the signal and indicator line, just as MACD
The outer level lines are switched off in MACD modus, because they will 'compress' this indicator, removing them also allows the zero line to 'float'
If you change the length of this indicator you also have to re-adjust the outer level lines, if used.
I recommend this indicator especially on higher lengths (55 or 89) in so you won't get whipped out by a early cross-over or 'false' divergence.
Cheers Indicat...
RSI-DEMA Kurat : Double DEMA of Heiken Ashi RSIThe 2 DEMA represent the RSI based on Heiken Ashi candles.
Current settings has been designed for BTC and long position only, you open on the cross up (green background) and you close on the cross down (red background)
Obviously, you can play with the settings and the timeframes.
RSI Self-adjusting bandsThe original script was posted on ProRealCode by user pepkatapet.
RSI modified so that the bands are adjustable to volatility, is similar to Blai5 indicator (Advanced RSI with BV).
RSI versus SMA (no repaint)*** USE AT YOUR OWN RISK ***
Nothing is perfect, and all decisions by you are on your own head. And stuff.
Description:
It's RSI versus a Simple Moving Average.. Not sure it really needs much more description.
Should not repaint - Automatically offsets by 1 bar if anything other than "open" selected as RSI source.
...sometimes smashing things together just happens to work...
RSI 100 150 200 MA Ribbon
Following Trends and Finding Divergences
Here is a script example that uses a long length (100, 150, 200) RSI MA Ribbon to detect trend reversals using lower time frames. You can also use traditional RSI to find divergences.
Built Best for 1H to 10 Min Charting
BTCUSD
RSI-Stochastic Hybrid v2**For those who like a smooth ride...v2 of this script is now updated with optional exponential averaging of the stochastic and RSI. So for instance a value of 3 for smoothing of the stochastic is like using %D instead of %K. **
This is a very simple idea - an average of RSI and the Stochastic Oscillator. However it offers plenty of flexibility for tuning to your requirements. You can change the lengths of either indicator and the weighting of each. By default it's set to 50/50 (just change the percent RSI to adjust). There is also an optional EMA which can be used as a signal line.
This idea comes from Greg Morris who likes to use it for trend following. I would buy when the indicator hits the overbought line and sell when it goes below 50.
RSI-Stochastic HybridThis is a very simple idea - an average of RSI and the Stochastic Oscillator. However it offers plenty of flexibility for tuning to your requirements. You can change the lengths of either indicator and the weighting of each. By default it's set to 50/50 (just change the percent RSI to adjust). There is also an optional EMA which can be used as a signal line.
This idea comes from Greg Morris who likes to use it for trend following. I would buy when the indicator hits the overbought line and sell when it goes below 50.
RSI based on ROC This is the new-age indicator which is version of RSI calculated upon
the Rate-of-change indicator.
The name "Relative Strength Index" is slightly misleading as the RSI
does not compare the relative strength of two securities, but rather
the internal strength of a single security. A more appropriate name
might be "Internal Strength Index." Relative strength charts that compare
two market indices, which are often referred to as Comparative Relative Strength.
And in its turn, the Rate-of-Change ("ROC") indicator displays the difference
between the current price and the price x-time periods ago. The difference can
be displayed in either points or as a percentage. The Momentum indicator displays
the same information, but expresses it as a ratio.
RSI/MFI with Volatility Bands with Alerts [BetaBlock]Based on LazyBear - RSI/MFI with Bollinger Bands indicator, but with Oversold and Overbought alerts
RSI-WMA + EMA Trend Filter | Signal OnlyThis is the specialized Indicator to create the internal Strategy for the class of Rio & Friend base on RSI-WMA with the EMA Trend Filter.
Enjoy and have fun with it!
RSI + MACD + Liquidity FinderLiquidity Finder: The liquidity zones are heuristic and based on volume and swing points. You may need to tweak the volumeThreshold and lookback to match the asset's volatility and timeframe.
Timeframe: This script works on any timeframe, but signals may vary in reliability (e.g., higher timeframes like 4H or 1D may reduce noise).
Customization: You can modify signal conditions (e.g., require only RSI or MACD) or add filters like trend direction using moving averages.
Backtesting: Use TradingView's strategy tester to evaluate performance by converting the indicator to a strategy (replace plotshape with strategy.entry/strategy.close).
RSI DeviationAn oscillator which de-trends the Relative Strength Index. Rather, it takes a moving average of RSI and plots it's standard deviation from the MA, similar to a Bollinger %B oscillator. This seams to highlight short term peaks and troughs, Indicating oversold and overbought conditions respectively. It is intended to be used with a Dollar Cost Averaging strategy, but may also be useful for Swing Trading, or Scalping on lower timeframes.
When the line on the oscillator line crosses back into the channel, it signals a trade opportunity.
~ Crossing into the band from the bottom, indicates the end of an oversold condition, signaling a potential reversal. This would be a BUY signal.
~ Crossing into the band from the top, indicates the end of an overbought condition, signaling a potential reversal. This would be a SELL signal.
For ease of use, I've made the oscillator highlight the main chart when Overbought/Oversold conditions are occurring, and place fractals upon reversion to the Band. These repaint as they are calculated at close. The earliest trade would occur upon open of the following day.
I have set the default St. Deviation to be 2, but in my testing I have found 1.5 to be quite reliable. By decreasing the St. Deviation you will increase trade frequency, to a point, at the expense of efficiency.
Cheers
DJSnoWMan06
RSI SuperstackThis script integrates three Relative Strength Index (RSI) indicators across multiple time frames, providing a comprehensive overview of oversold and overbought conditions. This holistic approach enhances the precision of entry and exit points on shorter time frames.
As a momentum indicator, the Relative Strength Index assesses a security's strength during upward and downward price movements within the specified time period.
In a broader context, an upward slope in all indicators (green, purple, and orange) signifies an increasing market momentum, suggesting a potential continuation of the upward trend.
More specifically, a collective upward slope reaching or surpassing the 40 level in all indicators serves as a buy signal. Conversely, a uniform downward slope descending to or below the 60 level in all indicators constitutes a sell signal.
The default time frames for analysis include:
- 1 Hour (1H)
- 4 Hours (4H)
- Daily (D)
It is imperative to note that this indicator should not serve as the sole determinant for initiating long or short positions. Instead, it is recommended to consider it as part of a broader analysis, incorporating factors such as trend analysis and significant support levels.
Disclaimer: The utilization of this indicator should complement a comprehensive analysis and not be solely relied upon for decision-making regarding long or short positions.
RSI + FIB HH LL StopLoss Finder/Contrarian TradesThis indicator is a multi-timeframe indicator that works in any timeframe.
It takes a price reading of the highest or lowest bar in the past based on Fibonacci numbers and plots it.
In addition, the RSI smoothed by a 5-day moving average can be used to detect signs that previous highs or lows will be reached in advance.
This gives insight into determining stop-loss values or entering the market in a contrarian manner.
This is an example of BTCUSDT 4Hour Chart
Here is BTCUSDT 1Hour Chart
For scalpers BTCUSDT 15min Chart Example
Fibonacci Number is 1, 1, 2, 3, 5, 8, 13, 21, 34, 55, 89, 144, 233, 377, 610, 987, 1597, ...
FIbonacci Ratio is 0.236, 0.382, 0.5, 0.618, 1, 1.618, 2.618, 4.236, ...
RSI Fractal Energy with Signal LineHere is my second script.
Introducing the RSI Fractal Energy Indicator.
This incorporates the Relative-Strength Index and Fractal Energy as the name implies.
This will help the trader identify:
1. Trend Strength: The higher the value of the indicator can indicate the strength of the trend and vice versa.
2. Reversal points: If the indicator is showing weakness and the market is making higher highs and lower lows this can indicate a reversal is possible.
3. Overbought and Oversold conditions: This indicator is currently set to 30(Oversold) and 70(Overbought), but this can be changed in the source code.
I also added a signal line to provide bullish/bearish crossovers.
I use this indicator on the 1 hr chart, but it can be used on any time frame.
Please let me know if you have any questions, comments, or concerns. Always open to learning more.
I will also provide updates as I continue to use my indicators.
Happy trading!
RSI Divergence Method█ OVERVIEW
This is a divergence indicator based on Relative Strength Index (RSI).
My attempt to make this indicator updated based on latest pine script features such as type, object and method.
█ FEATURES
1. Color of plot and label is based on contrast color of chart background. Able to customize color from style menu.
2. Big divergence (Regular Divergence) is based on lime / red color.
3. Small divergence (Hidden Divergence) is based on contrast color of chart background.
█ EXAMPLES / USAGES
RSI Candle ColorI manually made a 100 point gradient for this one. Its just smooth sensitive rsi but it colors your candles based on the level of the rsi. I hope you find this useful even as a utility for the gradient.