RSI Apex: Breakout & DivergenceRSI Apex: Breakout & Divergence System
RSI Apex:突破与背离交易系统
🇬🇧 English Description
RSI Apex is a comprehensive trading system designed to capture both Trend Breakouts and Market Reversals. Unlike traditional RSI indicators that rely solely on fixed levels (70/30), RSI Apex integrates Donchian Channels, Volatility Squeeze, and the Libertus Divergence Algorithm to provide high-probability signals.
🚀 Key Features
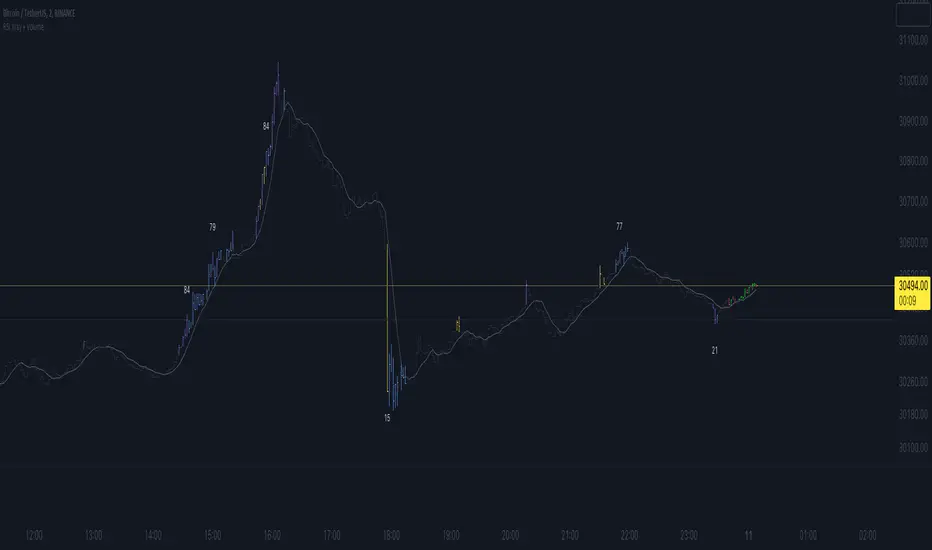
Trend Push System (Donchian Breakout):
Detects when RSI momentum is strong enough to push the upper/lower Donchian Channel bands.
Signal: Displays ▲ (Bull) or ▼ (Bear) at levels 20/80.
Libertus Divergence (No-Lag):
Uses a real-time pivot tracking algorithm to identify divergences between Price and RSI without the lag of traditional pivot points.
Signal: Displays "Div" labels at levels 30/70.
Smart Coloring (Extreme Highlight):
Green/Red: Normal Trend.
White (Extreme): When RSI breaches 70 (Overbought) or 30 (Oversold), the line turns bright White. This highlights the most volatile zones where reversals or strong continuations occur.
Volatility Squeeze Filter:
Monitors market volatility. When the Donchian Channel compresses significantly (below historical average), the background turns Purple.
Meaning: "Calm before the storm"—expect a major move soon.
🛠 How to Use
Trend Following: Enter when you see Green/Red RSI lines accompanied by ▲ / ▼ signals. This indicates a "Trend Push."
Reversal Trading: Look for "Div" signals when the RSI line is White (Extreme). This suggests momentum is fading despite price action.
Exit/Take Profit: Watch for the "Weak" label, which appears when RSI falls back into the neutral zone.
Dashboard: Monitor real-time RSI Value, Market State (Bullish/Bearish/Extreme), and Volatility (Squeeze/Expanding) in the bottom-right table.
🇨🇳 中文简介
RSI Apex 是一套旨在捕捉趋势爆发 (Breakout) 和 市场反转 (Reversal) 的综合交易系统。与仅依赖固定 70/30 线的传统 RSI 不同,本指标融合了 唐奇安通道 (Donchian Channels)、波动率挤压 (Squeeze) 以及 Libertus 无滞后背离算法,以提供高胜率的交易信号。
🚀 核心功能
强趋势推动系统 (唐奇安突破):
检测 RSI 动能是否强劲到足以推动唐奇安通道的上轨或下轨扩张。
信号: 在 20/80 轴位置显示 ▲ (多头推动) 或 ▼ (空头推动)。
Libertus 智能背离 (无滞后):
采用实时 Pivot 追踪算法,精准识别价格与 RSI 之间的背离,解决了传统背离指标的滞后问题。
信号: 在 30/70 轴位置显示 "Div" 标签。
智能变色 (极端行情高亮):
绿色/红色: 正常趋势状态。
白色 (White): 极端区域。当 RSI 突破 70 (超买) 或跌破 30 (超卖) 时,线条会强制变为醒目的亮白色,提示此处为变盘/背离高发区。
波动率挤压 (Squeeze) 过滤器:
实时监控市场波动率。当通道宽度显著收窄(低于历史平均水平)时,背景会填充为半透明紫色。
含义: “暴风雨前的宁静”——预示着大行情即将爆发,此时应空仓等待突破方向。
🛠 使用策略
顺势交易 (Trend): 当 RSI 呈现 绿色/红色 并伴随 ▲ / ▼ 信号时进场。这代表动能极强,处于主升/主跌浪。
左侧反转 (Reversal): 重点关注 RSI 线条变为 白色 (Extreme) 时出现的 "Div" 背离信号。这通常意味着价格虽创新高,但动能已耗尽。
止盈/离场: 留意 "Weak" (衰竭) 标签,它出现在 RSI 掉回中间震荡区时。
仪表盘: 右下角面板实时显示 RSI 数值、市场状态 (极值/背离/趋势) 以及波动率状态 (挤压/扩张)。
Penunjuk Pine Script®