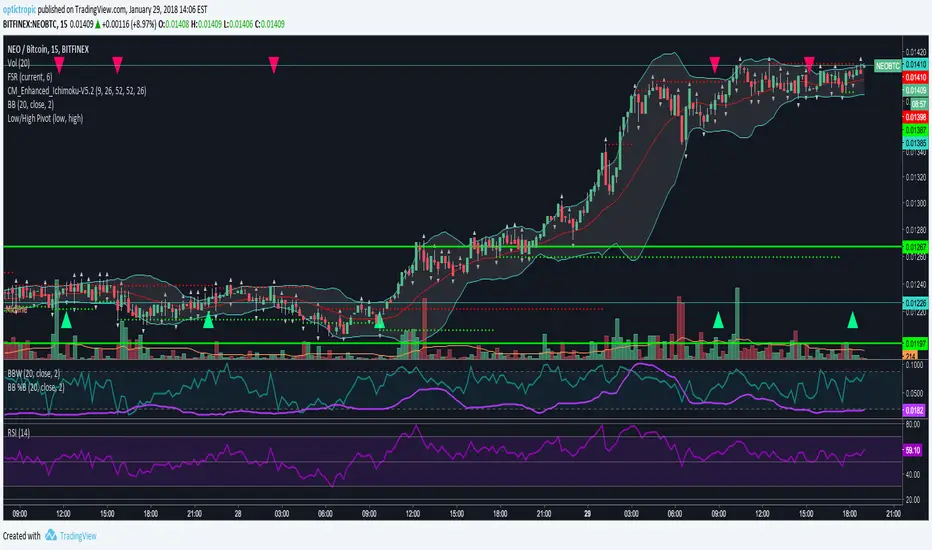
RSI or MFI %BPlots where RSI or MFI is inside its Bollinger Bands. Various strategies: good to see the trend (above/below average), overbought/oversold conditions (you could work a strategy around RSI getting out of overbought/oversold conditions as shown in the screenshot), divergences, etc...
I will also publish a Bollinger Bands width of RSI to identify areas of squeeze in volatility
Enjoy!
Cari dalam skrip untuk "rsi"

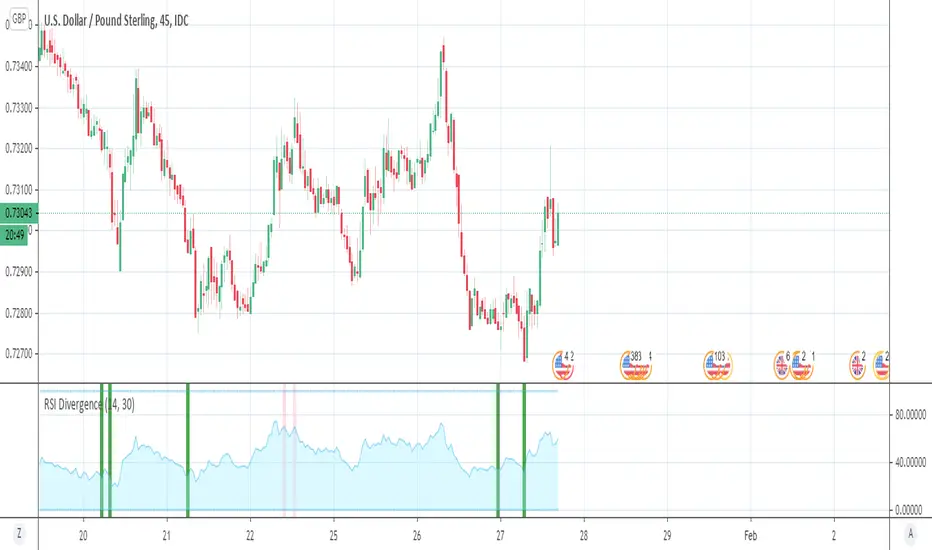
RSI DivergenceSimple RSI Divergence with adjustable lookback period.
Highlights bars with higher price but lower RSI (bearish) or lower price but higher RSI (bullish) than the highest/lowest points in the lookback period.
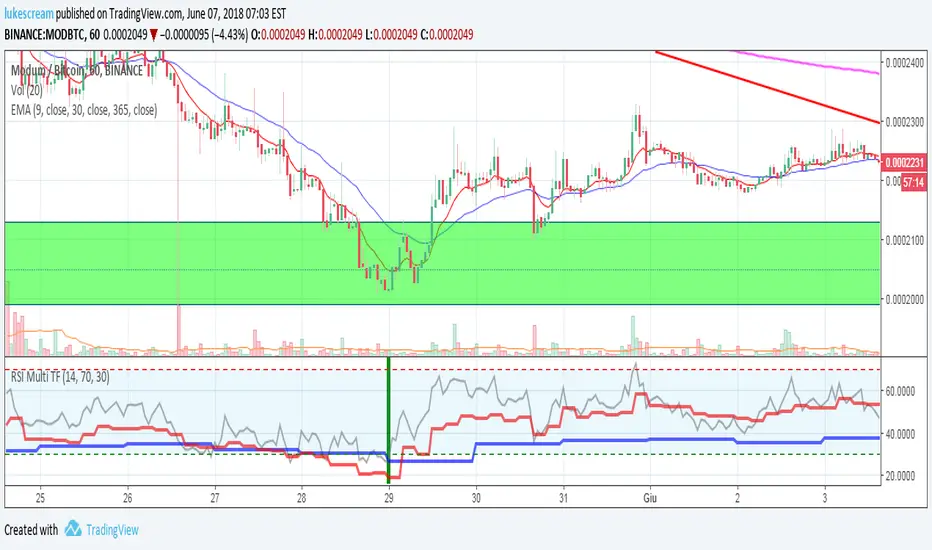
RSI Multi Time Frame - Spot Panic Sell Moments and profit!Union of three RSI indicators: 1h, 4h and daily. In order to show 1h RSI, you have to set it as active time frame on the chart.
Purpose: spot "triple oversold" moments, where all the three RSI are under the threshold, which is 30 by default but editable.
Target Market: Cryptocurrencies. Didn't try it on other ones, may work as well. Fits Crypto well as, by experience, I can tell it usually doesn't stay oversold for long.
When the market panics and triple oversold occurs, the spot is highlighted by a green vertical bar on the indicator.
The indicator highlights triple overbought conditions as well (usually indicating strong FOMO), but I usually don't use it as a signal.
I suggest to edit the oversold threshold in order to make it fit the coin you're studying, minimizing false positives.
Special thanks to Heavy91, a Discord user, for inspiring me in this indicator.
Any editing proposal is welcome!
I reposted this script, as the first time I wrote it in Italian. Sorry for that.
RSI-MTF-Histo-EntryThis indicator gives a histogram of RSI in relation to an ema of the RSI.
The histogram is then smoothed to reduce false signals.
The actualiteit RSI line with overbought/overvols signals can be added or omitted as preferred.
The background can be color coded if the RSI is above or below 50.
Version 2. Added support for MTF. Longer timesframes (1h-3h) tend to give better entry results.
As an example the indicator was added two times, one for the current timeframe and one for a longer timeframe.

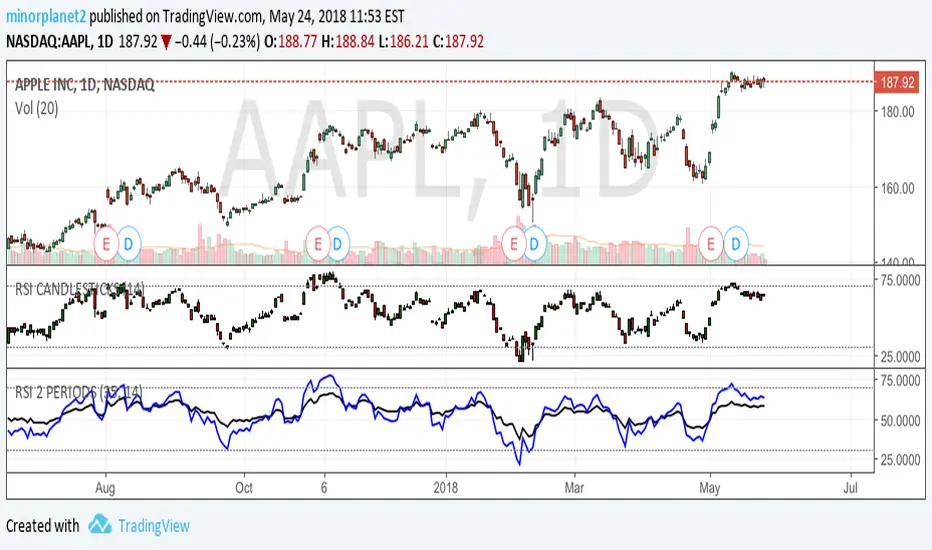
RSI 2 PERIODSPlots RSI of 2 different periods. Crossover of faster RSI with slower RSI suggests bullish outlook. Crossunders imply bearish outlook. Let me know what you think.
RSI / Stoch / Stoch RSI (SRSI) Overlay [SigmaDraconis]Combines RSI, Stochastic and Stochastic RSI (SRSI) in only one indicator.
Most useful to better pick tops and bottoms on oversold and overbought levels.
I decided to write it since I felt the need to look at how all 3 behaved at once, relative to each.
If you like it, here are my tip jars:
BTC: 1CfBVcxmrx7Uxw3SYJWVGKZsEK698fwXP9
LTC: LXXt76wWTksLcM5qbbiAxfP1o8SoxwzDH2
BTS: sigma-draconis

RSI with midlineHere's a standard RSI with a few horizontal lines included for convenience. (Above chart unrelated.)
I was inspired to make this script after watching CryptoCred's wonderful resource on the RSI, here (youtube) .
A few preset alert-templates are included, namely when the RSI touches a level of import (midline, overbought/sold, and even more overbought/sold, because crypto gonna crypto).
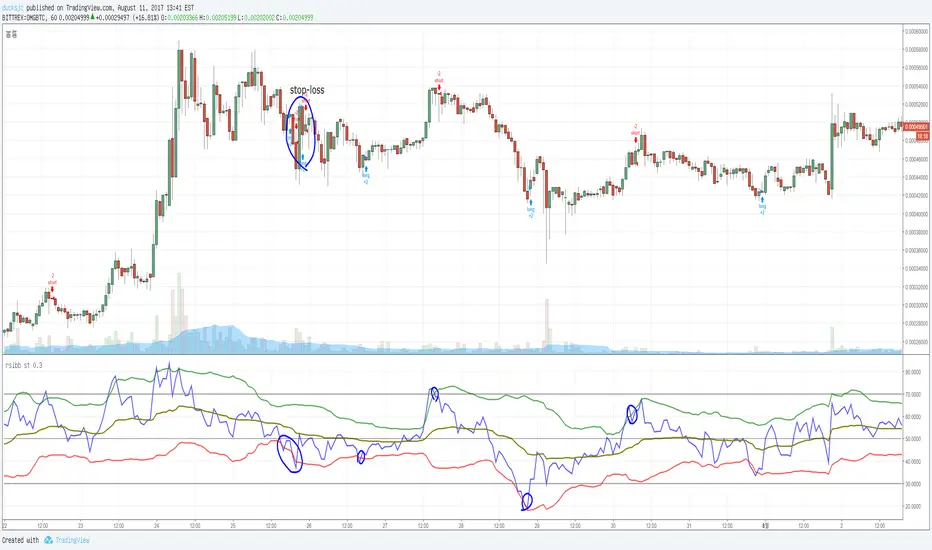
rsi+bb stadded BB in rsi .
if rsi touch green, sell.
if rsi touch red, buy.
also it has stop-loss function.
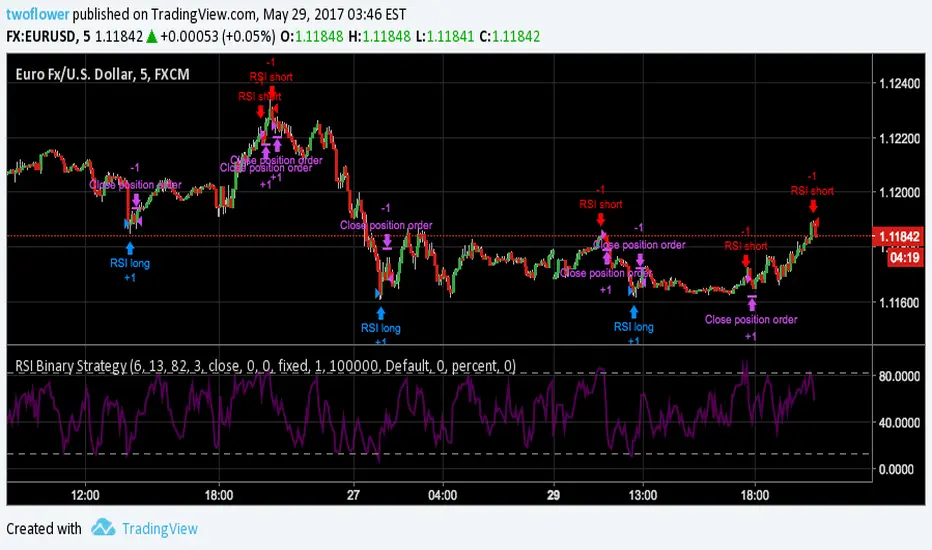
RSI Binary StrategyAnother basic strategy most people learn at the beginning of their trading carreer (like me) is the RSI strategy. This is an adaptation of the built-in RSI strategy for use in binary options. Who knows, maybe one day i will graduate to CFD trading, but my time for trading in general is limited at the moment and I am very much still at the beginning of this entire topic.
The rather specific values for the RSI bounds and length I saved have been developed for the EURUSD short term (5min.) interval, giving the highest amount of winning vs. loosing trades as of the publishing date of this script, which is the only important factor for binary options in my understanding. Use at your own risk.
Feel free to comment, give me pointers and/or recommendations.
RSI Strategy The RSI is a very popular indicator that follows price activity.
It calculates an average of the positive net changes, and an average
of the negative net changes in the most recent bars, and it determines
the ratio between these averages. The result is expressed as a number
between 0 and 100. Commonly it is said that if the RSI has a low value,
for example 30 or under, the symbol is oversold. And if the RSI has a
high value, 70 for example, the symbol is overbought.

RSI < 30 BUY | RSI > 70 SELL (One-Time) TSMThis script is a clean, non-repainting RSI-based trading indicator designed for scalping and intraday trading. It focuses on extreme market conditions and gives one-time BUY and SELL signals only, avoiding repeated or noisy alerts.

RSI Dual-Source DashboardRelative Strength Index
Table with adjustable positions
Shows:
RSI, 14 Source High (on given TF)
RSI, 14 Source Low (on given TF)

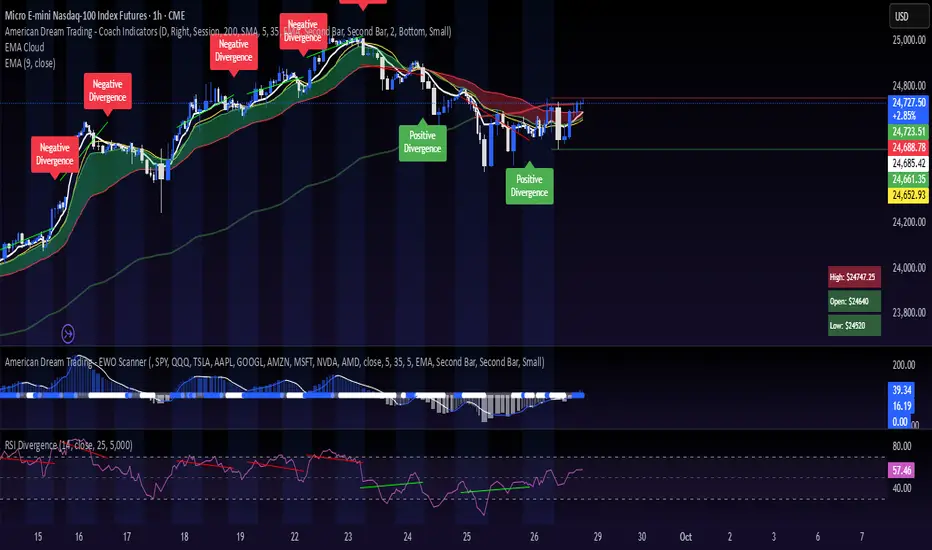
RSI Divergence bsTzdThis indicator automatically detects bullish and bearish RSI divergences by comparing swing highs and lows in price against momentum shifts on the Relative Strength Index. It identifies both regular divergences, which signal potential trend reversals, and hidden divergences, which often confirm trend continuation.
All divergences are plotted directly on the chart using clean, non-repainting swing-point logic so signals only appear after pivots are confirmed.
The goal of the tool is to help traders quickly spot early momentum shifts that are otherwise difficult to see in real-time—especially during fast intraday moves. By combining price structure with RSI behavior, the indicator offers high-quality signals designed to improve entry timing, stop placement, and overall trend analysis.
Key Features
Automatic bullish & bearish regular divergences
Automatic bullish & bearish hidden divergences
Uses confirmed swing pivots to avoid repainting
Works on all assets and all timeframes
Clean visual markers for fast decision-making
Helps identify momentum exhaustion, trend continuation, and potential reversals
Useful for scalping, day trading, and swing trading setups

RSI < 25 + Price Below 200 SMA (4H) - Text Signal
Price below 200MA on 4hr chart
RSI is below 25 ovsersold
Start buying small positions at every signal
Eventually price will capture the 200MA on 4hr
This will work great for NVDA, AAPL, MSFT, NFLX, PANW, AMZN, PLTR, CRWD and META.
Good for swing trading based on price action, RSI oversold and reversal
Add more on the Pin bar candles on 4hr time frame once the price is oversold.


RSI Mean-Reversion StrategyLong entry when RSI ≤ 30; exit at RSI ≥ 70. 100% equity per trade, 0.1% commission + 1 tick slippage. Optional 2% stop-loss. Visual buy/sell signals, dynamic SL line, and background highlight on oversold zones. Clean, backtest-ready Pine Script v5. Everything is easily adjustable to suit your liking.

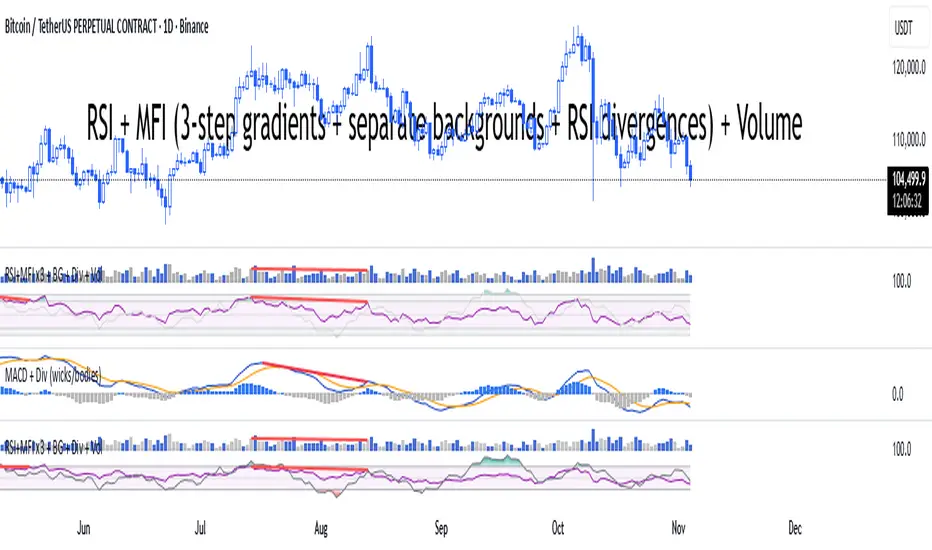
RSI + MFI + VolumeIndicator shows RSI + MFI + Volume in one panel, marks divergences separate for wicks and bodies, green dots shows where MFI and RSI are oversold
RSI to Price Projection PanelThis indicator calculates the current RSI based on the closing price and projects estimated prices for user-defined RSI target levels. Results are displayed in a table at the top-right corner of the chart.

RSI DivergenceStrat WCredit to faytterro. Buy when RSI is staying flat or going up while the ticker price is going down. Sell when RSI is staying flat or going down while the ticker price is going up.
RSI/Stochastic with overlays a moving average + Bollinger BandsCompact oscillator panel that lets you switch the base between RSI and Stochastic %K, then overlays a moving average + Bollinger Bands on the oscillator values (not on price) to read momentum strength and squeeze/expansion.
What’s added
Selectable base: RSI ↔ Stochastic %K (plots %D when Stoch is chosen).
MA + BB on oscillator to gauge momentum trend (MA) and volatility (bands).
Adjustable bands 70/50/30 with optional fill, plus optional regular divergence and alerts.
How to read
Bull bias: %K above osc-MA and pushing/closing near Upper BB; confirm with %K > %D.
Bear bias: %K below osc-MA and near Lower BB; confirm with %K < %D.
Squeeze: BB on oscillator tightens → expect momentum breakout.
Overextension: repeated touches of Upper/Lower BB in 70/30 zones → strong trend; watch for %K–%D recross.
Quick settings (start here)
Stoch: 14 / 3 / 3; Bands: 70/50/30.
Osc-MA: EMA 14.
BB on oscillator: StdDev 2.0 (tune 1.5–2.5).
Note
Analysis tool, not financial advice. Backtest across timeframes and use risk management.

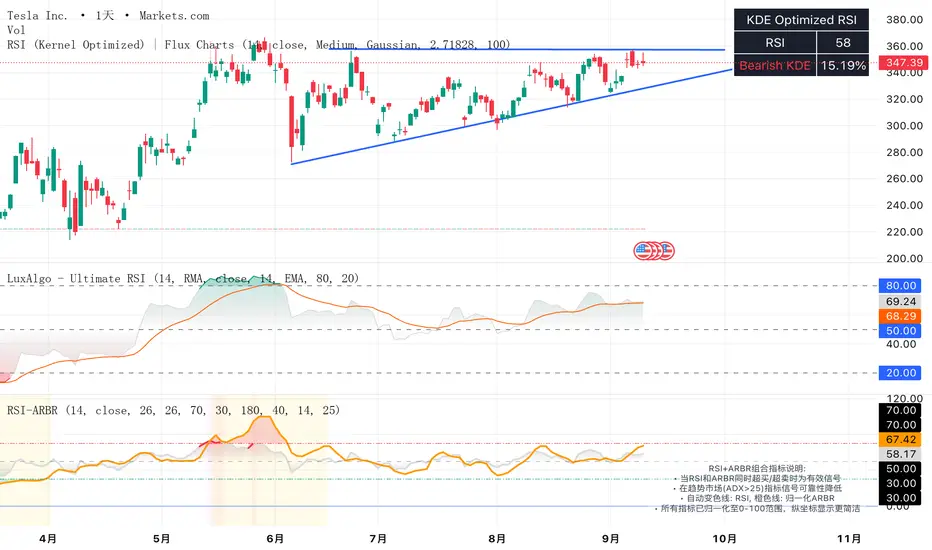
RSI + ARBR 组合指标The RSI + ARBR indicator mainly harmonizes the values of the two indicators, enabling investors to exit at market tops or buy at market bottoms when market sentiment surges or collapses.
### 补充说明:
- **RSI**:全称为Relative Strength Index(相对强弱指数),是常用的技术分析指标,用于衡量市场多空双方力量的对比。
- **ARBR**:由AR(Activity Ratio,人气指标)和BR(Buying Ratio,意愿指标)两个子指标组成,主要反映市场交易的活跃程度和投资者的买卖意愿。
- 句中“逃顶”译为“exit at market tops”,“抄底”译为“buy at market bottoms”,均为金融领域常用表达,准确对应“在高位卖出规避风险”和“在低位买入等待上涨”的操作含义。
RSI ALL INOverbought and Oversold with Candle Pattern Confluences
1. Overbought / Oversold signal only
2. RSI + Engulfing Candle
3. RSI + Hammer/Shooting Star
RSI+MA by RAThis Indicator generates buy and sell signal on the crossover of RSI and MA, HTF RSI is also plotted for HTF trend.
