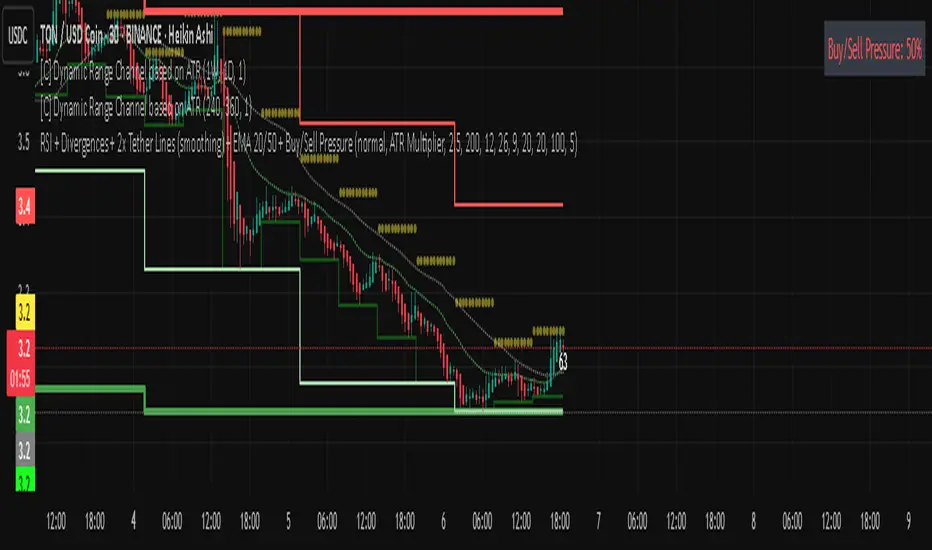
Rsi bar, divergences, tether line, ema 20,50 -Ema 20,50
-Tether Line dominance
-Buy/sell pressure
-Rsi last candle
-byu sell signal
-rsi divergence
-macd divergence
-Coloured candles 25,30 rsi and 70 rsi
Cari dalam skrip untuk "rsi"
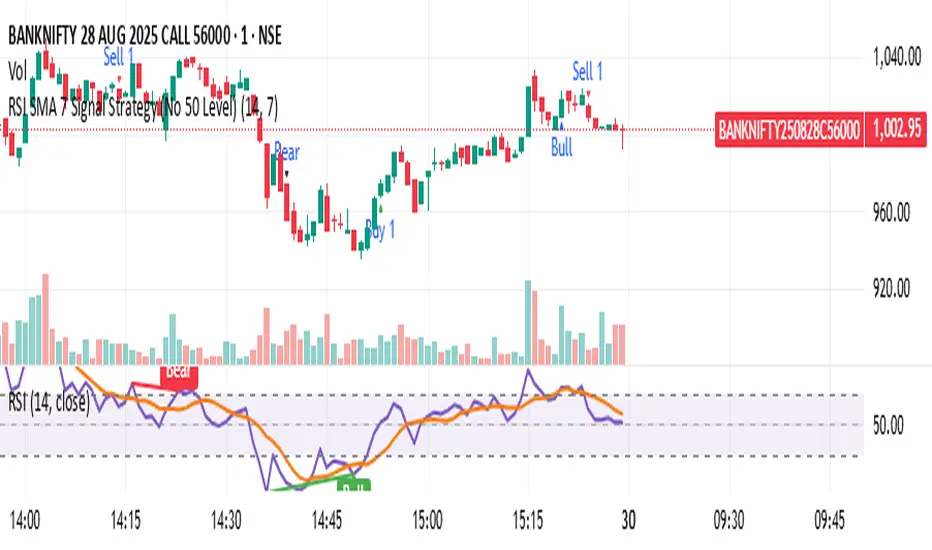
RSI SMA 7 Signal Strategy (No 50 Level)Script uses SMA 7 Perio and 14 Period RSI
If SMA crosses 40 RSI level from below consider it a buy zone or buy signal, if SMA crosses from below 60 RSI level, then super bullish, IF SMA crosses 60 RSI level from above its a profit taking time and Sell zone, if SMA crosses 40 level from above then super bearish sell signal.
RSI+BOLLINGER (LONG & SHORT)This indicator combines two of the most popular tools in technical analysis, the Relative Strength Index (RSI) and Bollinger Bands (BB), to generate both long (BUY) and short (SELL) trading signals.
Strategy:
Entries (Buy/Short): Entry signals are based on the RSI.
A BUY is suggested when the RSI crosses above an oversold level (default: 29), indicating a possible upward reversal.
A SHORT is suggested when the RSI crosses below an overbought level (default: 71), indicating a possible downward reversal.
Exits (Position Closure): Exit signals are based on Bollinger Bands.
A long position is closed when the price crosses below the upper Bollinger Band.
A short position is closed when the price crosses above the lower Bollinger Band.
Key Features:
Cascade Filter: Includes a smart filter that prevents opening new consecutive trades if the price hasn't moved significantly in favor of a new entry, optimizing signal quality.
Automation Alerts: Generates detailed alerts in JSON format for each event (buy, sell, close), designed for easy integration with trading bots and automated systems via webhooks.
Fully Configurable: All parameters of the RSI, Bollinger Bands, and strategy filters can be adjusted from the indicator’s settings menu.

RSI PotentialRSI Potential
This indicator does more than just track RSI; it measures the "energy" or "fuel" left in a trend. It answers a critical question: how much further can the price move before momentum is exhausted?
The key insight is that high momentum often means low potential, and vice versa. This inverse relationship is what allows the indicator to provide powerful, forward-looking signals about trend health and potential reversals.
Think of it like a race car:
Momentum is the car's current speed.
Potential is the amount of fuel left in the tank.
A car at top speed (high momentum) is burning fuel rapidly (potential is decreasing). A car just starting (low momentum) has a full tank of fuel (high potential). This indicator helps you see the fuel gauge, not just the speedometer.
This indicator plots three distinct components in a separate pane below your chart:
1. Upside Potential (Green Line)
What it shows: The percentage price increase required to hit the Overbought RSI Level. In other words, how much "fuel" is left for the upward trend.
How to interpret it:
Low Value (Approaching Zero): This is a warning sign. It means the price is already in high gear, and there is very little room left to run before hitting overbought exhaustion. Even if the price is rocketing up (high momentum), low potential signals the rally is likely on its last legs.
High Value: This indicates the market has a full tank of fuel for a rally. Even if the price is moving sideways or slowly (low momentum), the high potential suggests that if a new uptrend starts, it has the energy to be sustainable and significant.
2. Downside Potential (Red Line)
What it shows: The percentage price decrease required to hit the Oversold RSI Level—the "fuel" for a downtrend.
How to interpret it:
Low Value (Approaching Zero): A warning for bears. The price may be dropping fast (high momentum), but it's running out of energy to fall further. This signals seller exhaustion and increases the probability of a bounce or reversal.
High Value: The market has significant room to fall before becoming oversold. This can confirm the health of a new downtrend or suggest that a current downtrend has more to go.
3. Net Potential (Columns / Histogram)
What it shows: The net balance of energy: Upside Potential - Downside Potential. It answers, "Which side has more fuel in the tank?"

RSI Phan Ky FullThe RSI divergence indicator is like a magnifying glass that spots gaps between price swings and momentum. When price keeps climbing but RSI quietly sags, it’s a flashing U‑turn sign: the bulls are winded, and the bears are lacing up their boots. Flip it around—price is sliding yet RSI edges higher—and you’ve got bulls secretly stockpiling. Hidden divergences shore up the trend; regular divergences hint at a pivot. Blend those signals with overbought/oversold zones, support‑resistance, and volume, and RSI divergence turns into a radar that helps traders jump in with swagger and bail out just in time.

RSI & MACD Exit IndicatorThis indicator is designed to assist traders in identifying potential exit points for long and short trades by combining the Relative Strength Index (RSI) and Moving Average Convergence Divergence (MACD).
Unlike traditional indicators that provide entry signals, this script is specifically optimized for exit strategies, helping traders manage their positions efficiently.
How It Works
The script identifies potential exit points based on the following conditions:
🔴 Exit Long:
- RSI crosses above the user-defined overbought threshold (default: 65).
- MACD crosses below the signal line (bearish crossover).
🟢 Exit Short:
- RSI crosses below the user-defined oversold threshold (default: 35).
- MACD crosses above the signal line (bullish crossover).
When these conditions align, a label appears on the price chart indicating an exit point.
Key Features
- Customizable RSI & MACD Settings – Adjust lengths and thresholds to suit your strategy.
- ATR-Based Adjustments – The script incorporates an ATR multiplier for dynamic signal adjustments based on market volatility.
- Clear Visual Labels – Exit points are clearly marked on price candles.
- Color-Coded Background – Highlights buy/sell zones for quick identification.
- Alerts for Exit Signals – Receive notifications when exit conditions are met.
- Clean Chart Design – The MACD plots are placed below the main chart to avoid clutter.
How to Use
⚠ This indicator is for exits only and does not generate buy/sell entry signals.
For long trades: When an Exit Long signal appears, traders may consider closing or reducing their long positions.
For short trades: When an Exit Short signal appears, traders may consider closing or reducing their short positions.
ATR Settings: Users can adjust the ATR multiplier to fine-tune the signal frequency based on market conditions.
Important Notes
- This indicator does not guarantee future performance—it should be used alongside other analysis methods.
- No financial advice – Always use proper risk management.
- TradingView users who do not read Pine Script can still fully utilize this script thanks to the detailed signal labels and alerts.
💡 Developed with advice from @CoffeeshopCrypto based on user feedback.

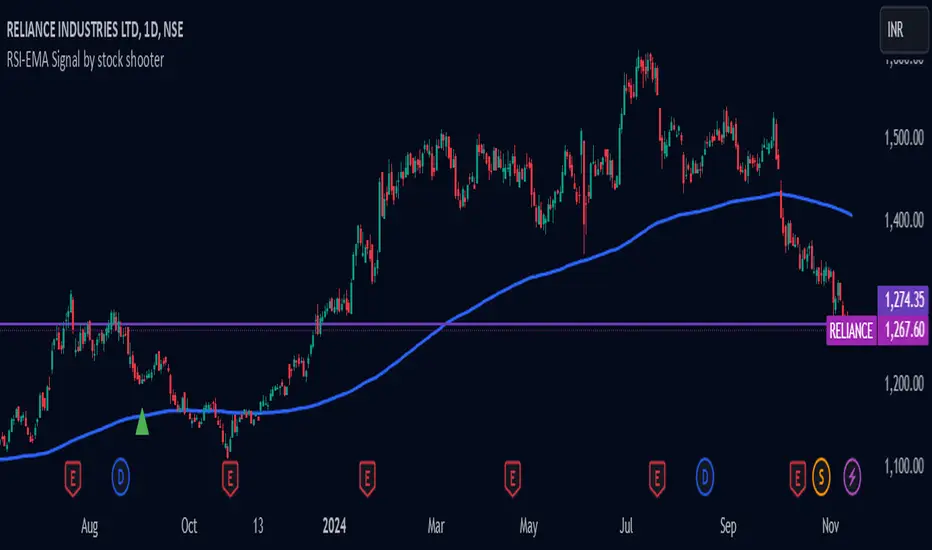
RSI-EMA Signal by stock shooter## Strategy Description: 200 EMA Crossover with RSI, Green/Red Candles, Volume, and Exit Conditions
This strategy combines several technical indicators to identify potential long and short entry opportunities in a trading instrument. Here's a breakdown of its components:
1. 200-period Exponential Moving Average (EMA):
* The 200-period EMA acts as a long-term trend indicator.
* The strategy looks for entries when the price is above (long) or below (short) the 200 EMA.
2. Relative Strength Index (RSI):
* The RSI measures the momentum of price movements and helps identify overbought and oversold conditions.
* The strategy looks for entries when the RSI is below 40 (oversold) for long positions and above 60 (overbought) for short positions.
3. Green/Red Candles:
* This indicator filters out potential entries based on the current candle's closing price relative to its opening price.
* The strategy only considers long entries on green candles (closing price higher than opening) and short entries on red candles (closing price lower than opening).
4. Volume:
* This indicator adds a volume filter to the entry conditions.
* The strategy only considers entries when the current candle's volume is higher than the average volume of the previous 20 candles, aiming for stronger signals.
Overall:
This strategy aims to capture long opportunities during potential uptrends and short opportunities during downtrends, based on a combination of price action, momentum, and volume confirmation.
Important Notes:
Backtesting is crucial to evaluate the historical performance of this strategy before deploying it with real capital.
Consider incorporating additional risk management techniques like stop-loss orders.
This strategy is just a starting point and can be further customized based on your trading goals and risk tolerance.
RSI with SMA and DisplacementThis RSI contains SMA 50 (which can be edited). Same SMA Line is displaced 10 rsi points above and below.
One can study crossing of rsi with these lines and where rsi taking support or experiencing resistance on these lines and build unique strategy.

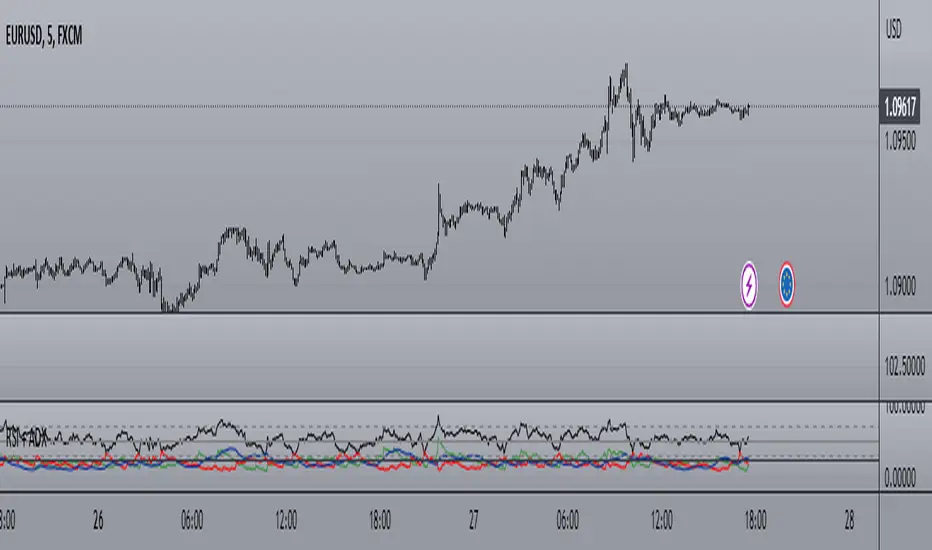
RSI + ADX + MACDINDICADOR COMBINADO DE RSI + ADX
Aprovecha las ventajas de cada indicador en uno solo.
Teniendo en un solo indicador el momentum de cada tendencia y la fuerza relativa con sus puntos de sobre compra y sobre venta.
También al poder analizar divergencias en el indicador oscilador RSI y poder crear estrategias de entrada con el ADX
-------------------------------------------------------------------------------------------------------------------------------------------------------------------------------
RSI + ADX COMBINED INDICATOR
Take advantage of each indicator in one.
Having in a single indicator the momentum of each trend and the relative strength with its points of overbought and oversold.
Also by being able to analyze divergences in the RSI oscillator indicator and being able to create entry strategies with the ADX
DERECHOS DEL CREADOR PARA: Dvd_trading
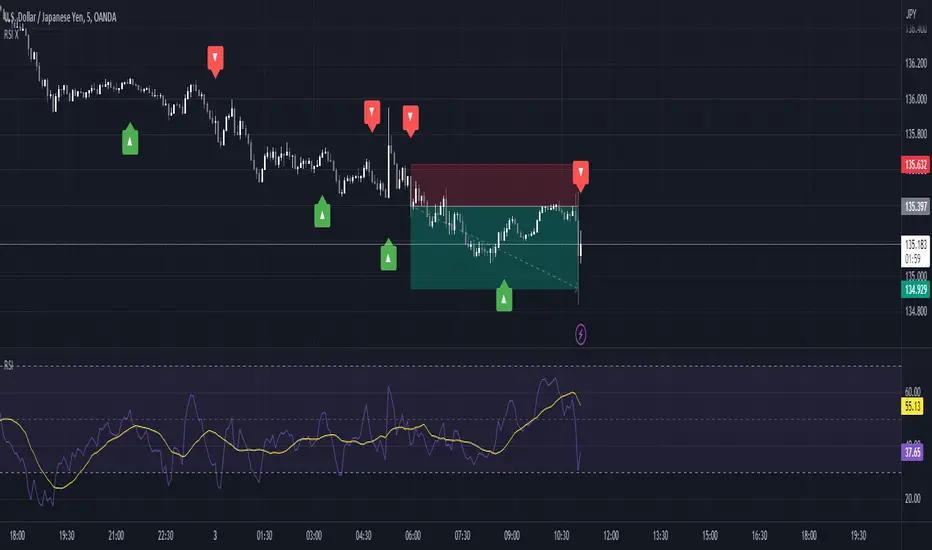
RSI Trending with DivergencesThis script uses the RSI and RSI divergences to mark signals where the rsi is both below/above the 50, below/above its moving average, and where the last regular or hidden divergence matches that state. The RSI is built into the indicator, so you don't need it in your bottom pane if you don't want it, I just put one there for illustrative purposes. Please note it will not print the same signal consecutively, as it is meant to show an overall direction, not the in and out fluctuations. I suggest using it in conjunction with some moving averages so you can ignore signals not in the trend.
RSI Multi Length With Divergence Alert [Skiploss]This is a modified indicator base code from RSI Multi Length and we will add some of functions by finding a classic/hidden divergence and alert.
The indicator returns information over RSI using multiple periods and calculates the percentage of overbought and oversold by overbought divided by oversold.
To find the divergence and hidden divergence we use base code from platform (Divergence Indicator) but change the input from normal to the average (RSI Multi Length).
RSI Settings
Maximum Length is maximum period.
Minimum Length is minimum period.
Overbought Level is value of the overbought level .
Oversold Level is value of the oversold level.
Source is input source of the indicator.
Divergence Settings
Pivot Right is value look back to the right side.
Pivot Left is value look back to the left side.
Max Range is maximum range value.
Min Range is minimum range value.
Alert Settings
It will be part of display of Divergence and Hidden Divergence.
Style Settings
Color of overbought/oversold/Bullish/Bearish which you can change as you wish.

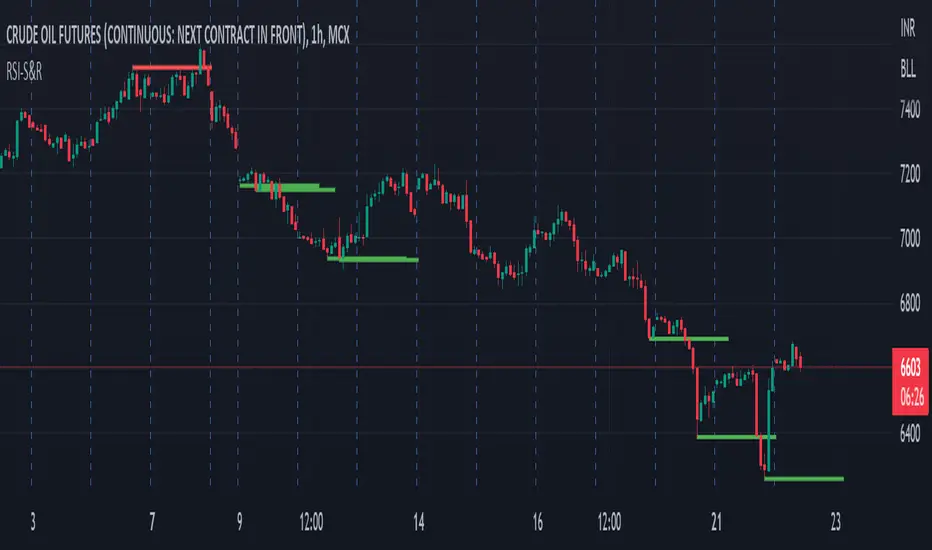
RSI SR by Kred-AllinoHello Trader,
This indicator is draw Support & Resistance Level based on RSI Calculation, It will help you to find Support and Resistance very Easily.
Red Color Line - Resistance
Green Color Line - Support
RSI comes up from the OS region. So it's good time to do the calculation with.
- Find out the lowest RSI value from the RSI array
- Get the corresponding low price from the price array
- Get the corresponding bar_index from bar_index array
- Draw the demand/support line on that price
This Indicator is made for Educational Purpose only, Author will not liable for direct or indirect for any losses due to use of Indicator.
RSI adjusted SuperTrendThis script is a variation on the SuperTrend.
The original function is from Tradingview, the difference is that I added a calculation with RSI
First 50 is subtracted from the RSI.
The absolute value of this number is on its turn divided with 100 or 50 (settings: 'Divide RSI value by')
-> this gives the 'aRSI', which is similar to a percentage
Finally a last calculation is made:
- lower * 'aRSI' is subtracted from the lower band
- upper * 'aRSI' is added to the upper band
If you want to see the Regular ST -> Toggle 'Show Regular ST'
Settings:
- factor (for both SuperTrends)
- ATR length (for SuperTrends)
- RSI length (for 'RSI adjusted SuperTrend')
Cheers!

RSI Highs and LowsENG
RSI is usually used with closes but sometimes traders need to find out exact lows and highs while trading, therefore this script is written.
Green plot is the RSI value according to highs and red plot is the RSI value according to lows.
TR
RSI genellikle mum kapanışlarına göre kullanılıyor ama bazen alım satım yaparken en dip ve en tepeleri yakalamak istersek kapanışlara değil de bu en yüksek ve en düşük mum değerlerine ihtiyacımız oluyor. Bu nedenle bu kod yazılmıştır.
Yeşil grafik - en yükseklere göre
Kırmızı grafik - en düşüklere göre

RSI Momentum Acceleration by TartigradiaPlots the momentum acceleration oscillators from price and RSI, rescaled and with areas above/below highlighted.
Usage: in a nutshell, when the background is yellow, it's bearish (RSI decelerates faster than price), whereas when the background is green, it's bullish (RSI accelerates faster than price). It appears to detect early some reversals that are otherwise difficult to detect.
Note: it supports using any other indicator's output as the second source input, instead of RSI. PineScript does not allow for more than one source to receive input from other indicators, all the others must only use price as an input.
This indicator uses the core routine to calculate Momentum Acceleration Oscillators by DGT:
This indicator is based on the idea of stinkbug : "RSI is a good momentum indicator showing how excited ppl are on a move, this is why divergences on it work so well. I would like to see the change accelerating or slowing on a move up or down.."

RSI + MA, LinReg, ZZ (HH HL LH LL), Div, Ichi, MACD and TSI HistRelative Strength Index with Moving Average, Linear Regression, Zig Zag (Highs and Lows), Divergence, Ichimoku Cloud, Moving Average Convergence Divergence and True Strength Index Histogram
This script is based on zdmre's RSI script, I revamped a lot of things and added a few indicators from ParkF's RSI script.
Disable Labels in the Style tab and the histogram if you don't enlarge the indicator and it seems too small.
Look to buy in the oversold area and bounce of the support of the linear regression.
Look to sell in the overbought area and bounce of the resistance of the linear regression.
Look for retracement to the moving average or horizontal lines, and divergences for potential reversal.
RSI
The Relative Strength Index (RSI) is a well versed momentum based oscillator which is used to measure the speed (velocity) as well as the change (magnitude) of directional price movements.
Moving Average
Moving Average (MA) is a good way to gauge momentum as well as to confirm trends, and define areas of support and resistance.
Linear Regression
The Linear Regression indicator visualizes the general price trend of a specific part of the chart based on the Linear Regression calculation.
Zig Zag (Highs and Lows)
The Zig Zag indicator is used to identify price trends, and in doing so plots points on the chart to mark whenever prices reverse by a larger percentage point than a predetermined variable or marker.
Divergence
The divergence indicator warns traders and technical analysts of changes in a price trend, oftentimes that it is weakening or changing direction.
Ichimoku Cloud
The Ichimoku Cloud is a package of multiple technical indicators that signal support, resistance, market trend, and market momentum.
MACD and TSI Histogram
MACD can be used to identify aspects of a security's overall trend.
The True Strength Index indicator is a momentum oscillator designed to detect, confirm or visualize the strength of a trend.

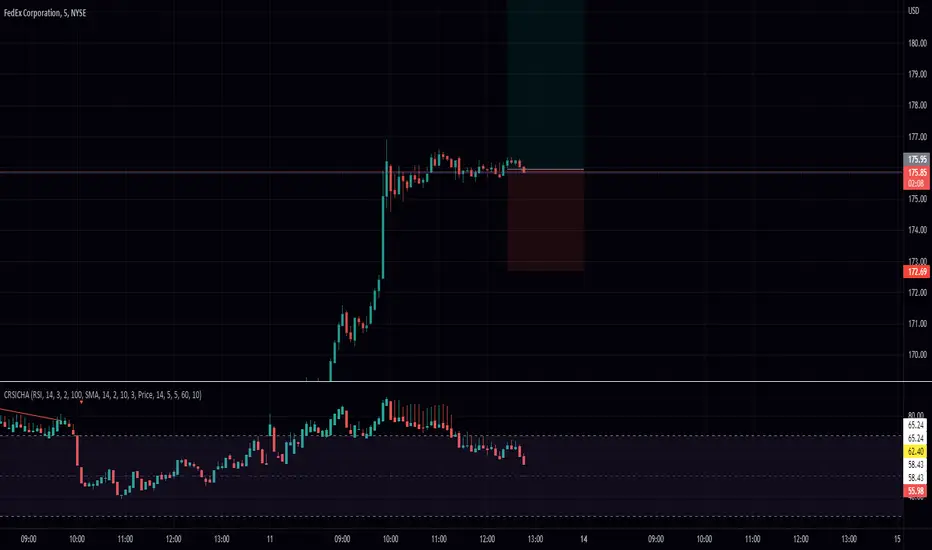
RSI Candle with Connors RSI and Heikin Ashi (CRSICHA)This script was designed to work and feel like the built in RSI script but with a lot of added feature that traders might enjoy. You get to see the RSI represented as candle sticks OR Heikin Ashi. I have added in Connors RSI as a bonus so you can see what this lesser used study looks like in candle form. Just like in the original script I have moving averages and Bollinger Bands. I must say, Heikin Ashi really excells in this situation because you don't need to know an exact price! As always I hope every one finds this useful! Enjoy!
RSI OverlayThis is the stock RSI index using the Price as the midline.
It can be useful to view information normally displayed in a second pane overlaid on the price chart. As far as I know, this has not been done for one of the most widely used indicators, the Relative Strength Index.
This can be overlaid anywhere on the chart and every parameter is variable. If you'd like to change the position, the RSI, midline, upper line, and lower line are scaled with a factor "*close/x"
To change the position on the chart, simply change the "X" until you are pleased with the location.
The RSI MA was distracting so I removed it. I also published this indicator including the MA, titled "RSI Overlay with MA."

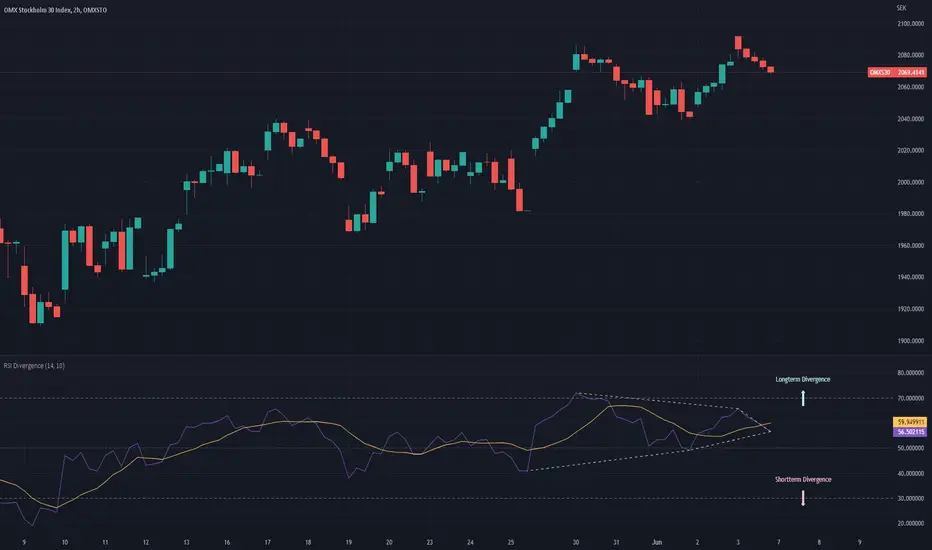
RSI DivergenceThe RSI DIvergence script tries to predict the upper and lower trend-lines for the current security’s RSI.
The script identifies peaks and valleys within the RSI and then tries to draw a trend-line in between the peaks and the valleys. The longest possible trend-line originating from the latest peak/valley will be used to determine whether or not the trend is moving up or down, the slope of the trend-line will then dictate the direction of the trend.
(If no trend line can be drawn from the latest peak/valley, the current value of the RSI will be used as the origin point of the trend-line)
Once the script has identified the trendlines they will be superimposed on the RSI line as dashed lines. The color of the dashed lines will depend on the direction of the trend, an upwards moving trend will be depicted in green,whilst a downwards moving trend will be depicted in red.
Furthermore, the script will draw two arrows, representing the short term trend and the long term trend, as to make it even more clear which direction the two trend-lines have.
If only one trend-line (either upper or lower) can be found, the script will replace the corresponding arrow with a diamond shape instead.
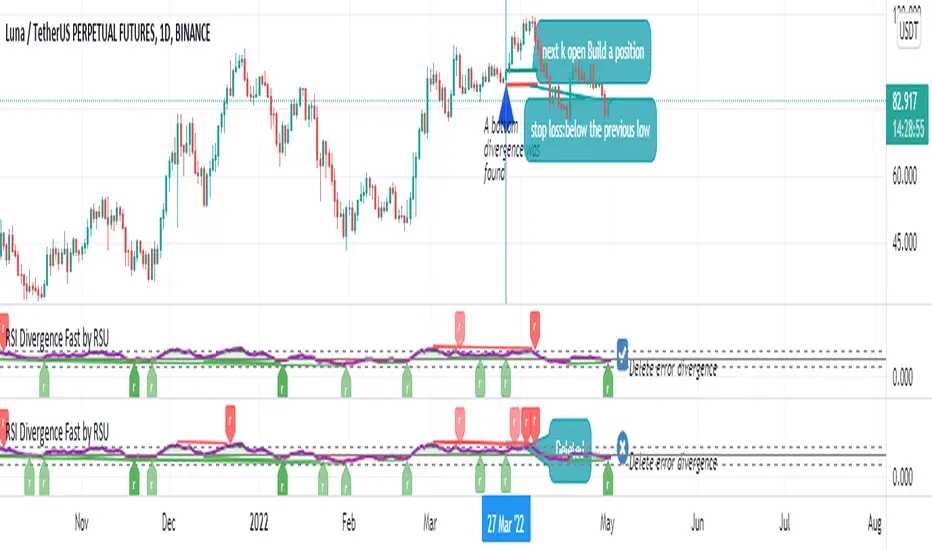
RSI Divergence Fast by RSUAdvantages:
1. When rsi is at a high point, once it falls by 1 k line, it will detect the divergence from the previous high point. This can quickly find the divergence that has taken effect and help you quickly capture the trend before a sharp decline or rise.
The difference between other RSI divergence indicators: the official divergence indicator is to detect the 5 and the k line, which may lead to a large amount of decline.
2. This indicator detects the previous high and the previous low of 5, 10, 20 lengths at the same time, instead of only detecting a fixed length, so that more deviations can be found.
Notice:
Because it is a quick divergence detection, it is recommended to confirm that the divergence takes effect after the current k is completely closed first. I have identified this state in the indicator as "k not end"
Disadvantages and Risks
Since it is a quick discovery, there will be error identification. I listed the difference between the two indicators when deleting errors. The indicator turns off the "delete error" option by default.
Please do not:
Don't go short in the uptrend, don't go long in the downtrend.
Top divergences that occur because of a strong uptrend are usually only temporary pullbacks. Bottom divergences in persistent declines are also temporary rallies. Do not attempt to trade such low-return trades.
It is recommended to use the divergence indicator when the stock price has made a new high and retraced, and once again made a new high, because this often leads to the end of the trend.
Divergence how to use:
1. After the previous K line was completely closed, a bottom divergence was found.
2. Open an long order at the beginning of the second bar, or as close to the bottom as possible (because the stop loss will be smaller).
3. Break the stop loss price below the previous low where the divergence occurred, which already means that the divergence is wrong.
RSI usage:
1. RSI is above the 50 line, in an uptrend, below 50 in a downtrend.
2. Above 70 is overbought, falling below the oversold zone may mean the end of the uptrend.
Below 30 is oversold, above the oversold zone may mean the end of the downtrend.
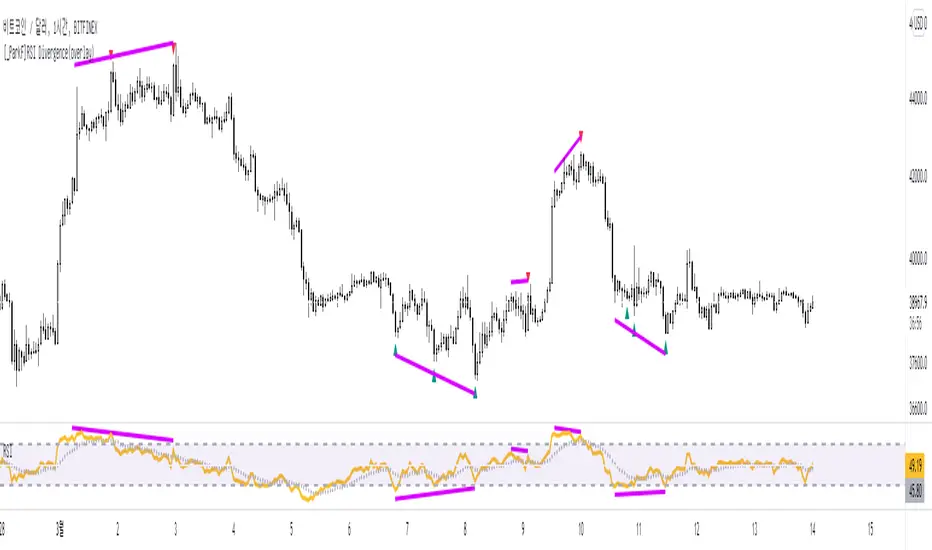
[_ParkF]RSI Divergence_overlayRSI Divergence_overlay
Does not include RSI indicator.
Up Signal = Displayed green dot below the candle
Down Signal = Dispalyed red dot above the candle
* Don't trade just at the signal
RSI 다이버전스
RSI 지표 미포함.
상승 신호 = 초록색 점으로 캔들 아래 표시.
하락 신호 = 빨간색 점으로 캔들 위에 표시.
* 신호만 보고 매매하지 마세요
INVEST BTC RSI (from @tradinglord)RSI VERSION - no alerts
The script highlight point of interest for investors using EMA , RSI and a bit of criticism.
The script is built to be used on a weekly timeframe
When RSI is bellow 35 it can be interesting to invest in BTC , on the opposite when it is above 80 can be where to take a bit of profits.
Also using EMA to flow with the power of the trend or change your bias depending on conditions.
Feel free to use the included alerts to be informed when RSI is telling you something.
The idea is quite simple, and you will not gain x100 your investment, but with these kind of investments and some patience you could make your way out.
Obviously not financial advice, understand what you are doing.
"Sometimes it's better to be rational monkey than a greedy baboon" - Tradinglord 2022

RSI DoubleJust another RSI indicator with a plus: shows the current symbol RSI in black plus another symbol RSI in blue.
This is useful for example if you are trading alt-coins and you want to see also the RSI of Bitcaoin as reference, or is you are trading forex and want to see another index...
See my other scripts in: es.tradingview.com
