RSI ExtendedThis script is intended to print signals on the main price chart and send alerts when the RSI is overbought or oversold.
You can customize the source of the signal (open, close, etc), as well as oversold/overbought levels, and RSI length.
Cari dalam skrip untuk "rsi"
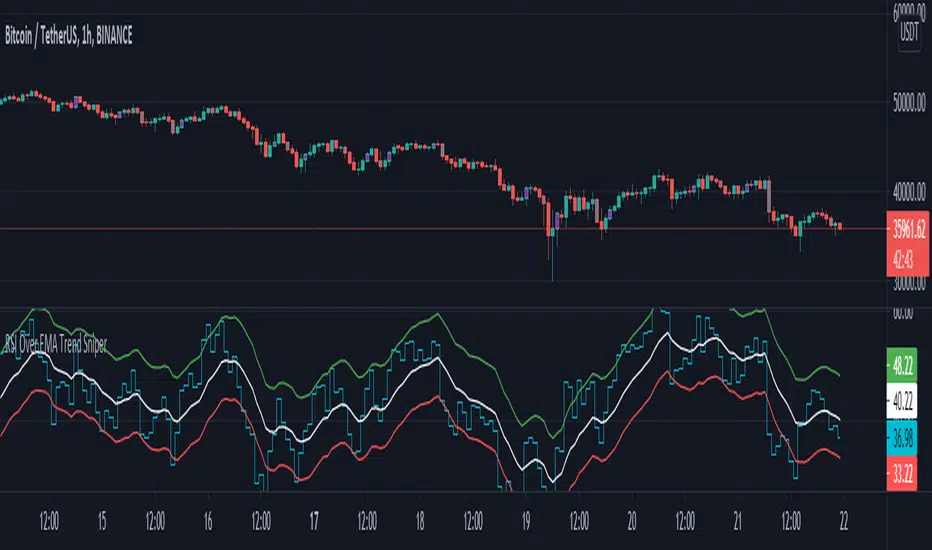
RSI Over EMA Trend SniperThis is an indicator that uses horizontal EMA lines with a RSI line on top of it to provide optimal entry and exit positions for trading crypto.
How to use:
If the Aqua(RSI) line passes upwards on the red heading to the white - it's heading towards a good BUY signal. To be safe you wait until it passes above the white line, then BUY LONG. Another signal to buy long is when the Aqua line passes above the white and green lines.
Selling is essentially the opposite, if the Aqua line is passing down from the green or white lines, then it's time to sell and exit your trade.
This indicator works well as a confirmation, and it's nice to have multiple confirmations, so it's suggested you use this with other indicators that can provide entry and exit confirmations.
RSI & MACDThis indicator presents standart RSI and MACD indicators in a single indicator. The appearances of these indicators have been modified a little bit and squeezed into one window. To overcome the scale problem the MACD values has expanded with 1000 and divided by the current price to use both indicators in the same scale. Original values could be determined from there. Original Tradingview codes have been used to get full control of graphs.
Bu indikatör RSI ve MACD gösterfgelerini tek bir indikatörde sunuyor. İndikatörlerin görünüşleri bir miktar modifiye edilip iki indikatörğn tek bir pencereden takip edilmesine olanak sağlanmıştır. İki indikatördeki farklı ölçek kullanımından ortaya çıkan ölçek sorunu MACD değerlerinin 1000 ile genişletilip, ürünün güncel fiyatına bölünmesiyle giderilmiştir. Her iki indikatiör için de orjinal Tradingview kodları kullanılmıştır.

RSI OverTrend Strategy (by Marcoweb) v1.0Hi guys, just adapted the CCI Level zero Strategy with the Over Bought and Over Sold levels provided by the Relative Strength Index. The strat is opening a long position at RSI Oversold 30 Level closing it at RSI Overbought 70 Level flipping the position.
Enjoy :D

RSI Weekly and MonthlyThis script publishes the weekly and monthly RSI Indicator on the daily chart.
You have an option to view the daily RSI
It is preferable to use this indicator on a Lower time frame. Eg. Daily, 1 hour chart...

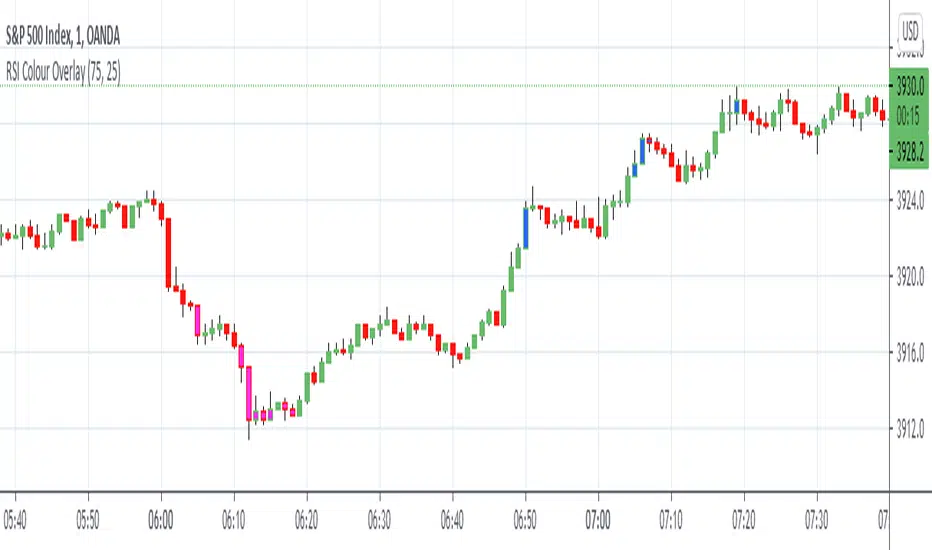
RSI Colour OverlayApplies Blue or Pink colour overlay to candles when RSI is at or over the predefined parameters. These parameters are adjustable in the settings area of the indicator. Please note RSI does not guaranteed a pivot point in price action and the colour overlay should only be used as an indication or condition not a call to buy or sell alone. The colour overlay is a useful prompt to review price action. I hope this helps and good luck with your analysis and trading.
RSI-VWAP Indicator %█ OVERALL
Simple and effective script that, as you already know, uses vwap as source of the rsi, and with good results as long as the market has no long-term downtrend.
RsiVwap = rsi (vwap (close), Length)
The default settings are for BTC in a 30 minute time frame. For other pairs and time frames you just have to play with the settings.
█ FEATURES
• The option to start trading from a certain date has been added.
• To make the profit more progressive, a percentage of your equity is used for entries and a percentage of your position is used for closings.
• The option to trade in Spot mode has been added, since, for the TradingView backtest, the money is infinite and if you do not limit it somehow,
it would offer you much better profits than the live trading.
QuantityOnLong = Spot ? (EquityPercent / 100) * ((strategy.equity / close) - strategy.position_size) : (EquityPercent / 100) * (strategy.equity / close)
• The option to stop the system when the drawdown exceeds the fixed limit has been added.
Drawdown, as you already know, is a very important measure of risk in trading systems.
The maximum drawdown will tell us what the maximum loss of a trading system has been during a period. This maximum loss is determined by:
strategy.risk.max_drawdown(Risk, strategy.percent_of_equity)
• Leverage plotted on labels added.
█ ALERTS
To enjoy the benefits of automatic trading, TradingView alerts can be used as direct buy-sell orders on spot, or long-close orders with leverage.
Currently there are Chrome extensions that act as a bridge between TradingView and your Exchange or Broker.
This is an example of syntax for this type of extensions. Copy and paste a message like this into the alert window:
{{strategy.order.action}} @ {{strategy.order.price}} | e = {{exchange}} a = account s = {{ticker}} b = {{strategy.order.action}} {{strategy.order.alert_message}}
█ NOTE
Certain Risks of Live Algorithmic Trading You Should Know:
• Backtesting cannot assure actual results.
• The relevant market might fail or behave unexpectedly.
• Your broker may experience failures in its infrastructure, fail to execute your orders in a correct or timely fashion or reject your orders.
• The system you use for generating trading orders, communicating those orders to your broker, and receiving queries and trading results from your broker may fail.
• Time lag at various point in live trading might cause unexpected behavior.
• The systems of third parties in addition to those of the provider from which we obtain various services, your broker, and the applicable securities market may fail or malfunction.
█ THANKS
Thanks to TradingView, its Pine code, its community and especially those Pine wizards who post their ideas that helps us to learn.
If the world is heading toward a equitable new world economic order, let's get rich first ...
Happy trading!

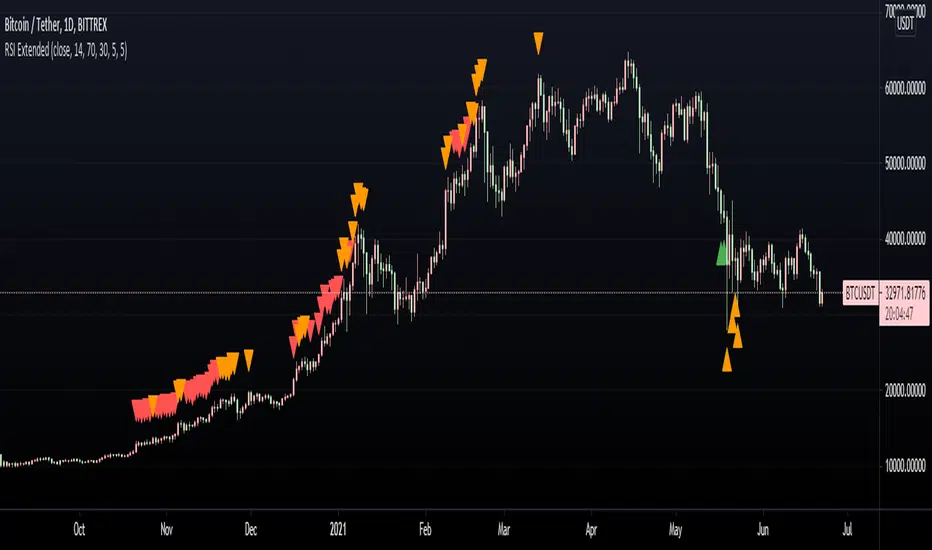
RSI With Noise Elimination Technology (John Ehlers)Indicator translation to Pinescript requested by cookie_crusher on Twitter. The "RSI With Noise Elimination Technology" (NET) is an indicator developed by John Elhers.
The indicator is simply a rolling Kendall rank correlation coefficient of a normalized momentum oscillator (a version of the RSI introduced by Elhers in the May 2018 issue of Stocks & Commodities). It can be interesting to note that the absolute value of this oscillator is equal to the efficiency ratio used in the Kaufman adaptive moving average (KAMA).
Even if both the normalized momentum oscillator and rolling Rank correlation are scale-invariant oscillators, they do not have the same behaviors when increasing their settings, that is the normalized momentum oscillator scale range will become lower while the Kendall correlation will stay close to 1/-1, here is a closed-form approximation of the mean of the absolute value of the normalized momentum oscillator absolute value (efficiency ratio):
E (er) ≈ 1/√p
Where E (er) is the mean of the efficiency ratio er while p is the period of the efficiency ratio, as such the scale of the normalized momentum oscillator will shrink with a higher period, maybe that both are not intended to be plotted at the same time but that's what the original code does.
It's still a coll indicator. The link to J. Elhers article is in the code.

RSI - MTF - Non RepaintUsing rsi with security function directly will cause repaint. Hence, doing it based on close price and calculating rsi via formula to avoid that. Hope this solves repainting issue.
Thanks to @Jittra for requesting this :)

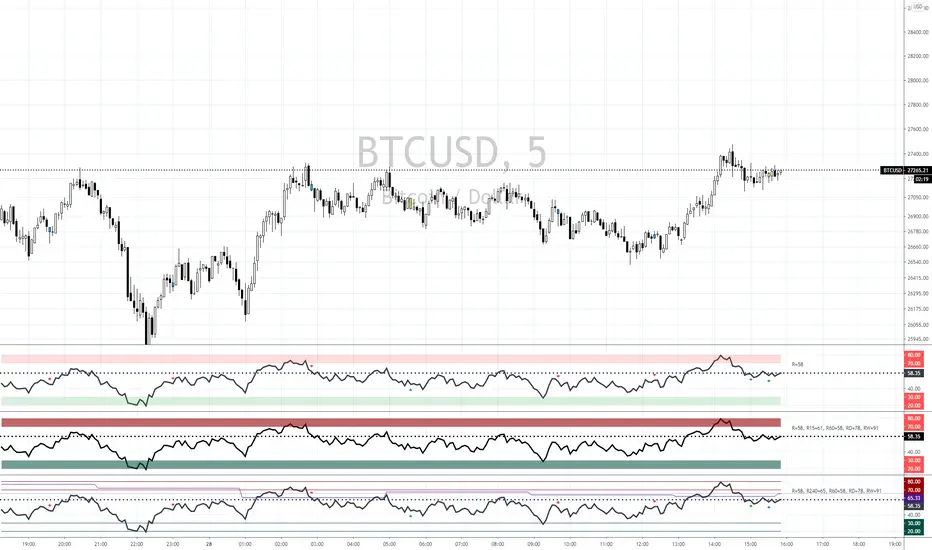
RSI Divergence multi Timeframe Ultimate
2 x Rsi Level
Show Divergence and Color Bars
Show RSi from multi Timframes with lines and/or Label
Fully configurable
Aertable
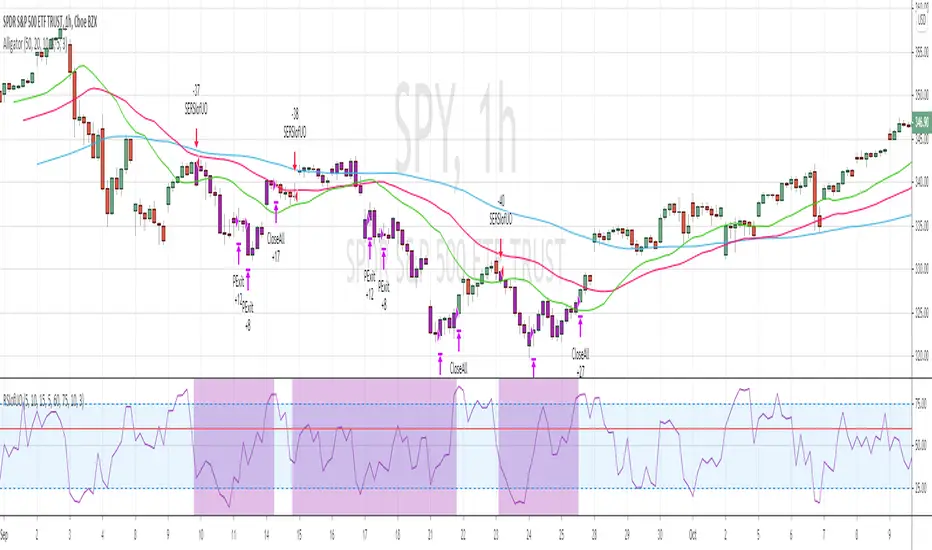
RSI of Ultimate Oscillator [SHORT Selling] StrategyThis is SHORT selling strategy with Ultimate Oscillator. Instead of drectly using the UO oscillator , I have used RSI on UO (as I did in my previous strategies )
Ultimator Oscillator settings are 5, 10 and 15
RSI of UO setting is 5
Short Sell
==========
I have used moving averages from WilliamAlligator indicator --- settings are 10(Lips), 20(teeth) and 50 (Jaw)
when Lips , Teeth and Jaw are aligned to downtrend (that means Lips < Teeth < Jaw )
Look for RSIofUO dropping below 60 ( setting parameter is Sell Line )
Partial Exit
==========
When RSIofUO crossing up Oversold line i.e 30
Cover Short / Exit
=================
When RSIofUO crosisng above overbought line i.e 70
StopLoss
========
StopLoss defaulted to 3 % , Though it is mentioned in settings , it has not been not used to calcuate and StopLoss Exit... Reason is, when RSIofUO already crossed 60 line (for SHORTING) , then it would take more efforts go up beynd 60. There is saying price takes stairs to climb up but it takes elevator to go down. I have not purely depend on this to exit stop loss, however noticed the trades in this stratgey did not get out with loss higher than when RSIofUO reaching 70 level.
Note
======
Williams Alligator is not drawn from the script. It is manually added to chart for illustration purpose. Please add it when you are using this strategy , whch woould give an idea how the strategy is taking Short Trades.
This is tested on Hourly chart for SPY
Bar color changes to purple when the strategy is in SHORT trade
Warning
========
For the eductional purposes only
RSI Over 85When Weekly RSI, using Coinbase Data, gets over 84 , then it generates a marker on the chart saying FOMO
I had been manually checking that. However, this is needed for my own personal use as an alert. Hence, I created this.
This is so simple script that I have made this open-source.
Note: This is my own belief that whenever RSI is over 84 on weekly timeframe using COINBASE data, there may be one red candle nearby. This only works with BTC charts. It does not work with other charts.

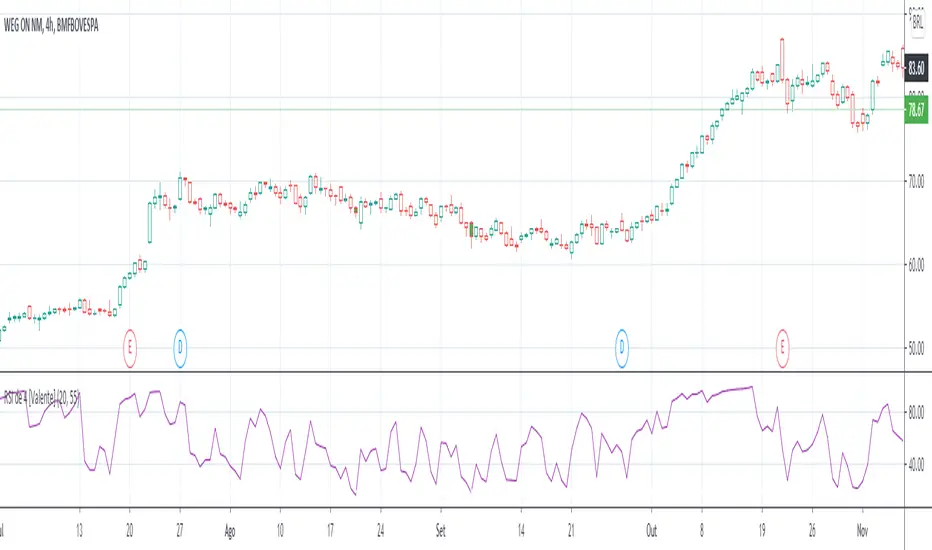
RSI de 4 [Valente]Study RSI 4 (RSI 25) from connors strategy. It will fill the candle color with green on buy signals and red on end positions base on RSI4 study.
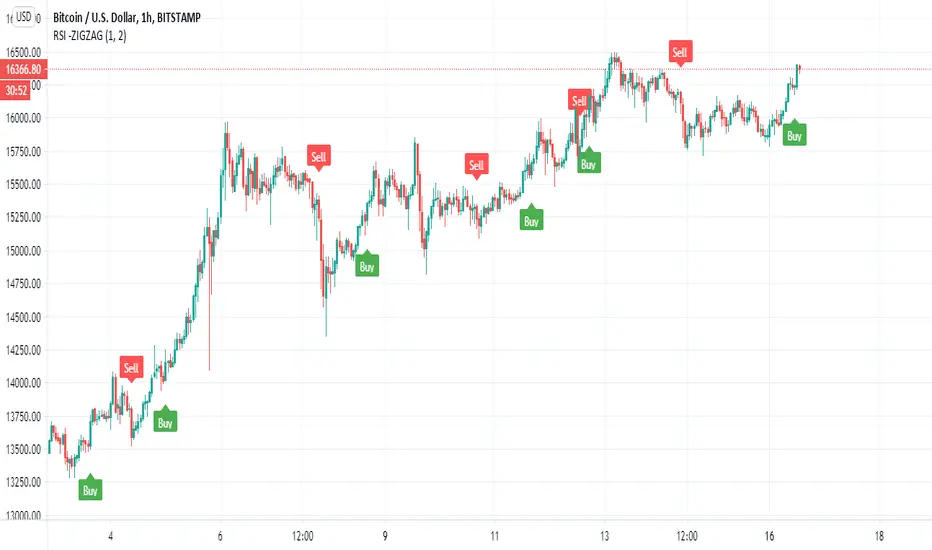
RSI -ZIGZAGSo this indicator is RSI Zigzag
with fast RSI with create high and low
then we just add % zigzag
you can modify the signal by length or by % of the zigzag that make change
the signal created by the cross over the zigzag
alerts included
there is no lag in this zigzag
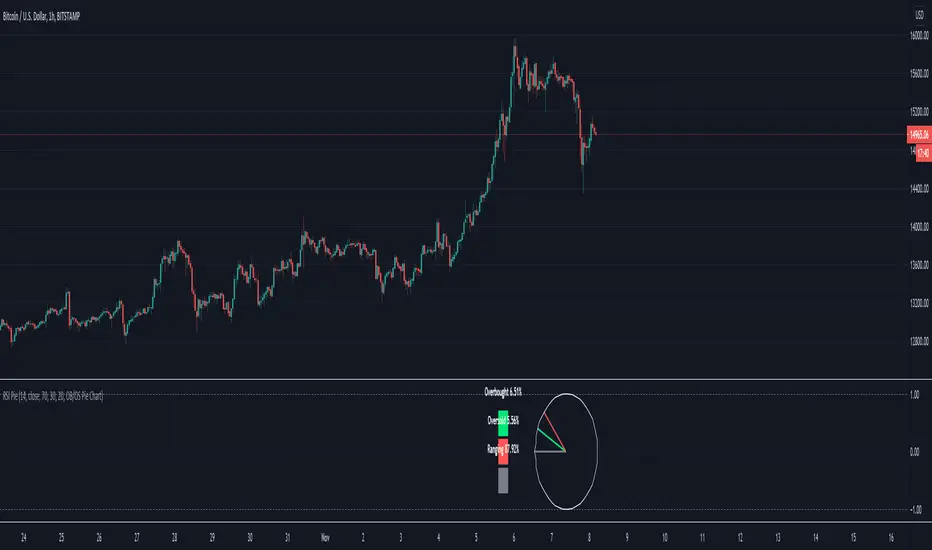
RSI PieMore a novelty than anything useful. Measures the % of overbought/sold RSI and renders as a pie chart. RSI % -> Radians -> (x,y) -> bar_time. 24hr market charts only.
RSI (Lucho_FGL) MulticolorIt is an RSI indicator. Unlike the rest, we can see at a glance areas of over-buying and over-selling. We can also see the crossing of the RSI indicator with the Exponential Moving Average with its colored areas.

RSI Chart Bars 8 55 45Dear Traders
This RSI 8 period made for perfect entry for Long and Short for Intraday/Scalping in any time frame, when RSI 8 crossed above 55 the Candle charged to White then you can go for Long/Buy and when crossed below 45 the Candle changed to Yellow so you can go for Short/Sell, it working in any time frame.
Thanks & Regards
Nesan
RSI, STOCHASTIC, KELTNER AND EMA CROSSES COMBINEDI have combined RSI and Stochastic but also added an keltner channel and then also two EMA's.
How the indicator works is the background turns green when the rsi and stochastic are below 20 and the keltner channel is below X and also your fast ema is below your slow ema and then vice versa for sell signals.
Feel free to leave a comment on what you think and what could be improved on it because i know their is some fine tuning to do and some improvement that can be made and I'm sure i'll be updating this myself.
All the variables are interchangable and the indicator has alert functionality.
RSI cross Bollinger Band indicatorThis is a RSI cross Bollinger Band indicator that paints bgcolor short and long signals when the RSI cross's up through the lower bollinger band ( Long ) or cross's down through the upper bollinger band ( Short )
I have also added alerts for the signals
please note there is still noise with this, you need to use with something else like MFI or VFI
RSI SUPER TREND V1very simple script of RSI super trend based on super trend V
(can be found in my open scripts
buy period is green
sell period is red
you can change length by min time (now set to 240 min)
you can change output by RSI length or the supertrend ATR
very easy to add signal or alert to it
i may do it later

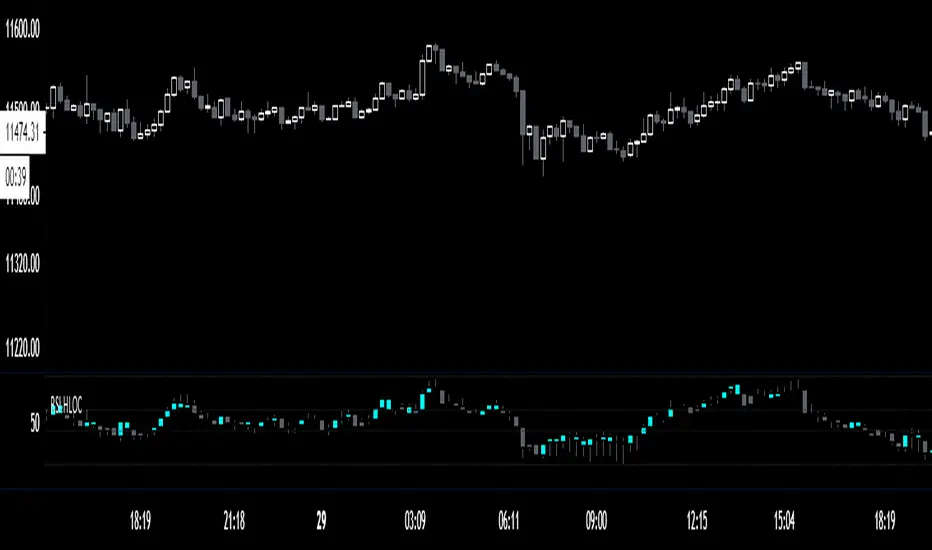
RSI HLOCShout out to @FnM_Capital for the original script
For that its open code as his was
ALl i added was a different variable for the color code and also removed some things i found unneeded
I also changed the period and the underlying rsi variable from RMA to WMA
The final change i made was the zones he had, i changed them to reflect my SRSI levels.
good little secondary check to strength in momentum . Wicks and candle patterns have the same logic in the RSI version made here
CHEERS
RSI with BB and MAsThis indicator is based on the 'rsi sma/ema CU' indicator by auroagwei. That is a great base to start with.
I've added Bollinger Bands, crossover indications and alert conditions to it, to work with a combined RSI - MA - BB strategy.
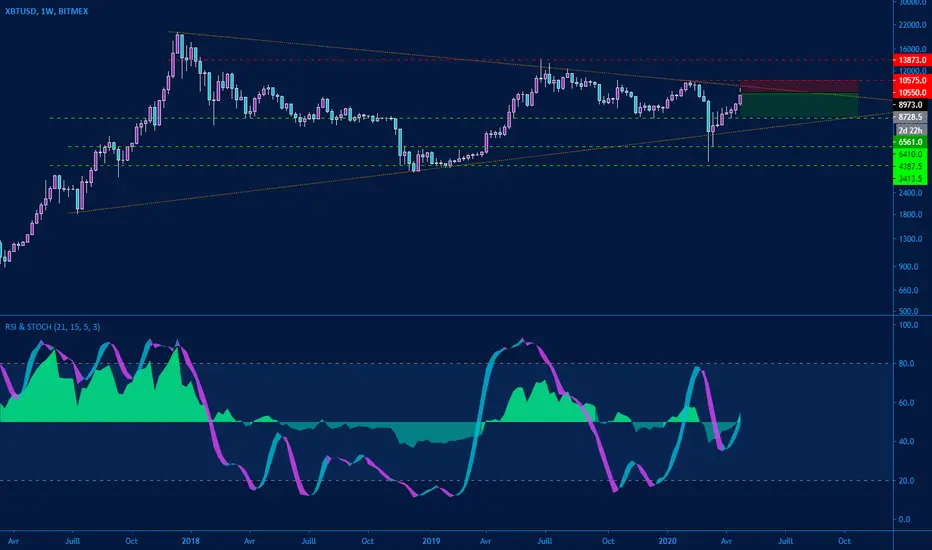
RSI & StochasticHello everyone,
I would like to share with you my new little toy...
It's an oscillator wich combine RSI based on his neutral value (50) and Stochastic on the same spot.
Defaults values are ( 21 ) for RSI and ( 15,5,3 ) for stochastic.
All parameters are editable...
I hope you will enjoy
Cheers,
Keep it Simple