RSI Divergence Method█ OVERVIEW
This is a divergence indicator based on Relative Strength Index (RSI).
My attempt to make this indicator updated based on latest pine script features such as type, object and method.
█ FEATURES
1. Color of plot and label is based on contrast color of chart background. Able to customize color from style menu.
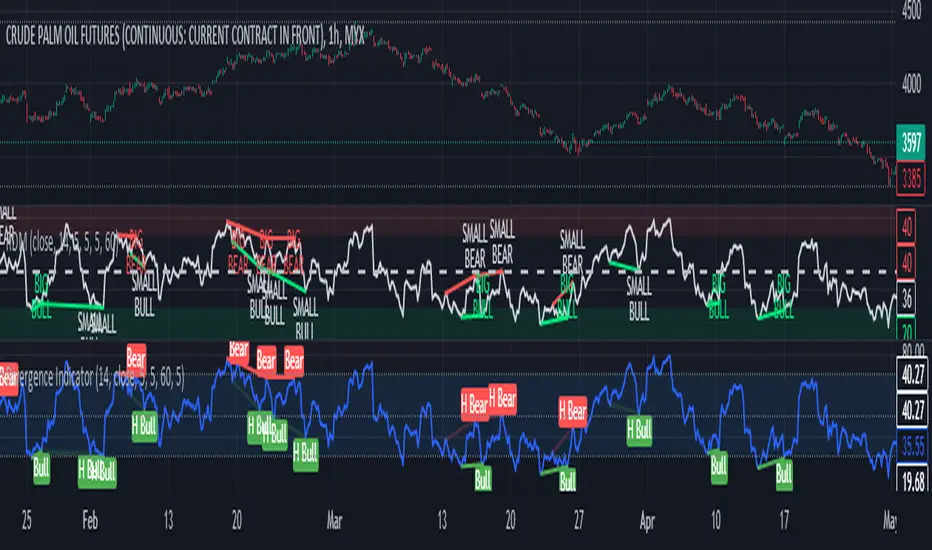
2. Big divergence (Regular Divergence) is based on lime / red color.
3. Small divergence (Hidden Divergence) is based on contrast color of chart background.
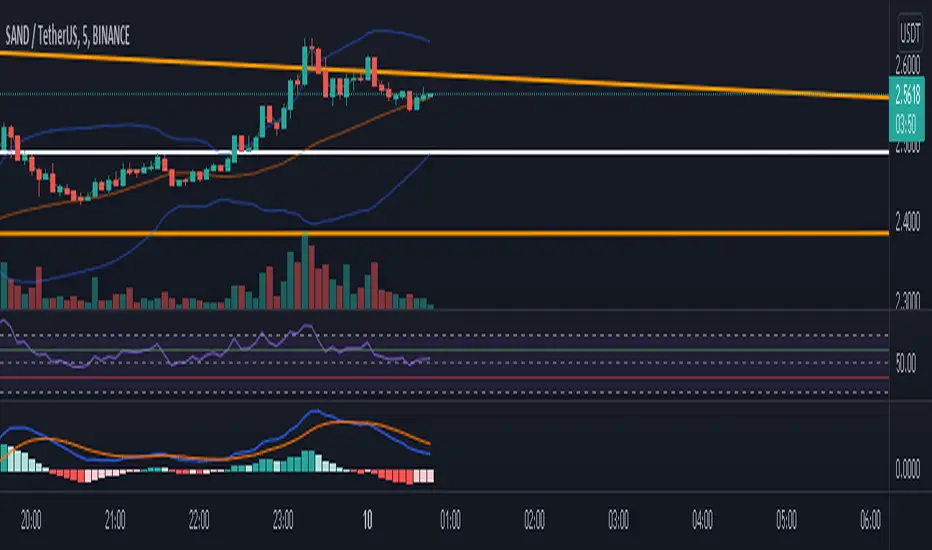
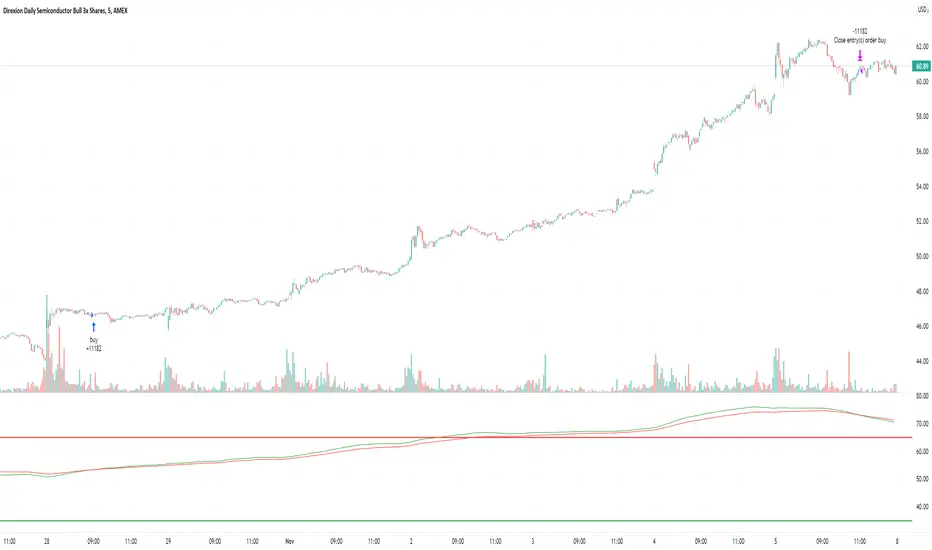
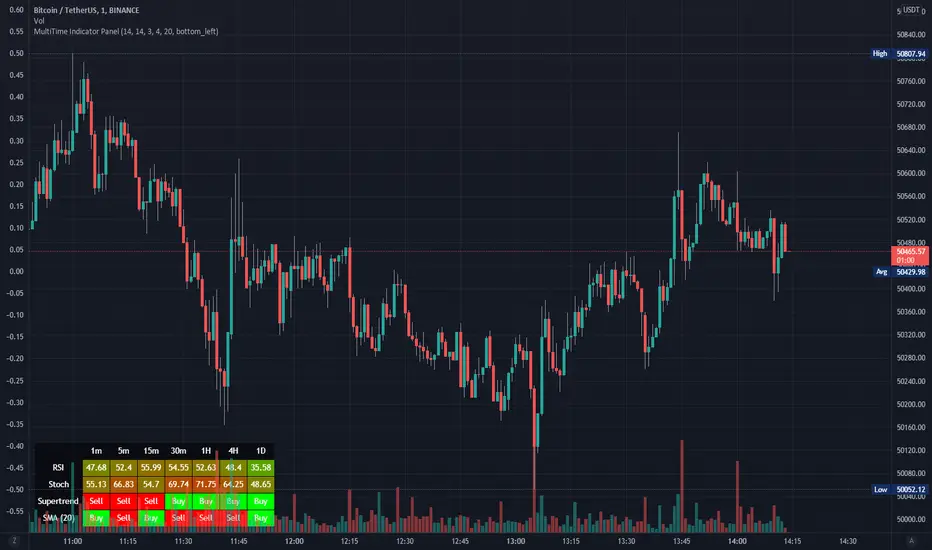
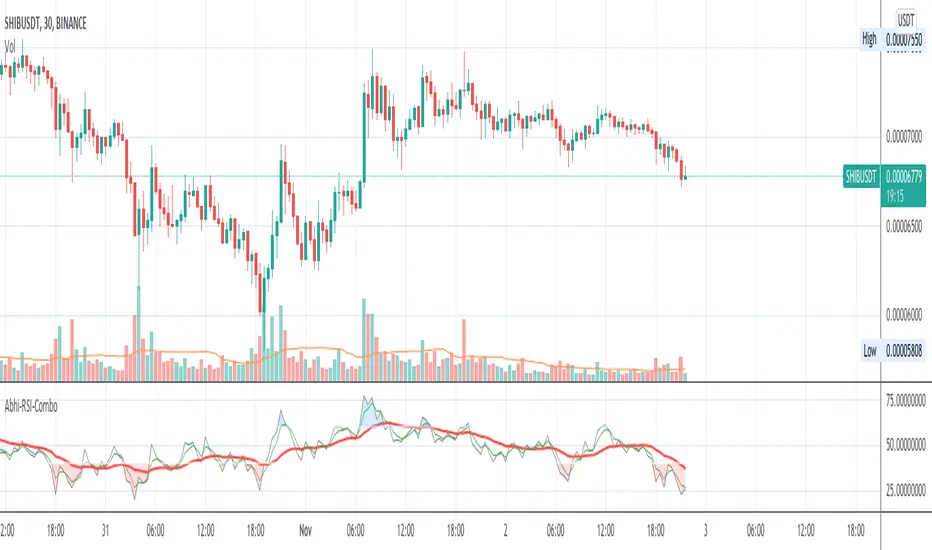
█ EXAMPLES / USAGES
Penunjuk Pine Script®