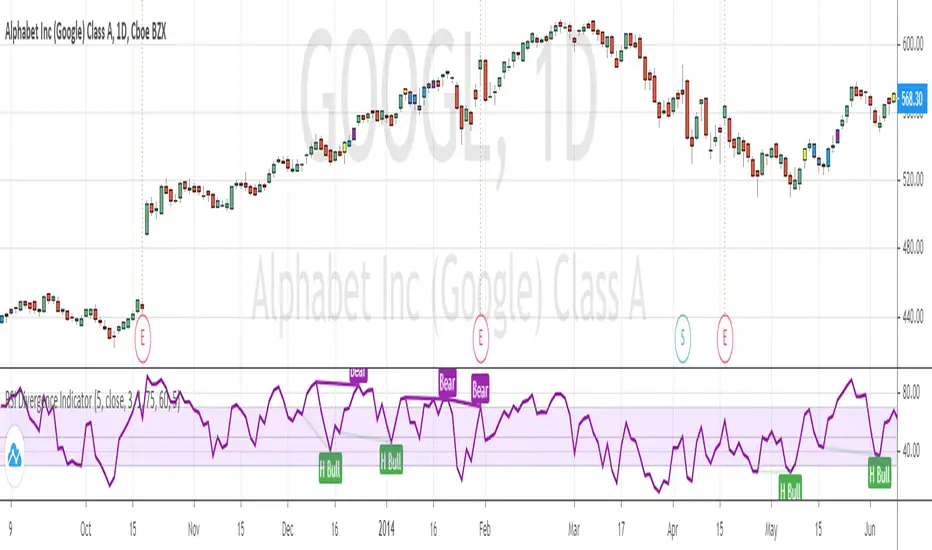
RSI Divergence Indicator (with alerts)Many have requested me for indicator version with alerts for the RSI Divergence strategy. Here is the one ...
Please note alert triggers in delay by number of bars defined in the settings. (same as strategy) ...
Bar color also changes when alert triggers ...
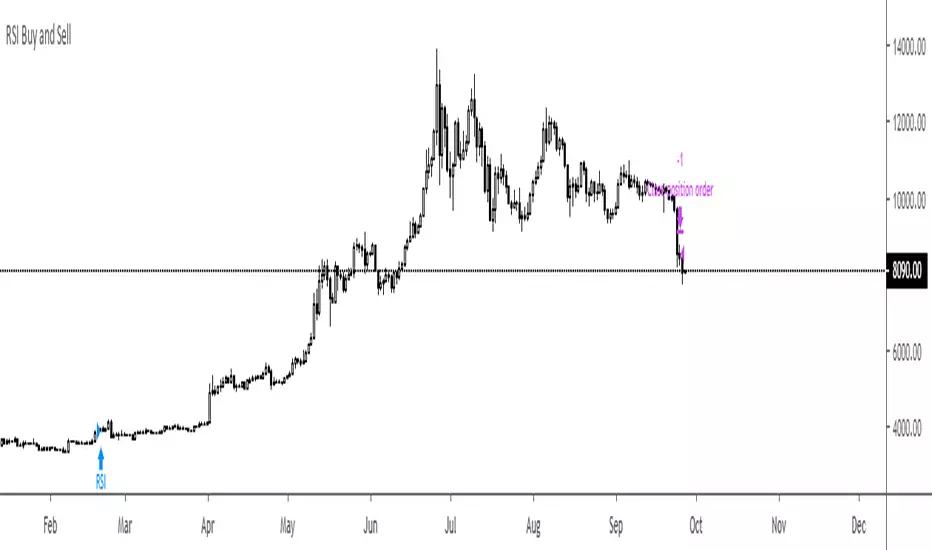
Yellow Bar shows BUY
Purple Bar shows EXIT ( Exit the Long position ... NO SHORTing )
On each Yellow Bar can be added to existing position
On each Purple Bar , exit partial position OR exit the whole position
Appreciate your feedback.
Warning
Use for education purpose only ...
Penunjuk Pine Script®