RSI Enhanced CandlesRSI Enhanced Candles highlight candles that are in overbought and oversold areas of RSI indicator.
In order to use this script, the default candles must be hidden via Chart Settings->Symbol Body, Borders and Wick.
I recommend hide Body only and set the Borders and Wick with a low transparency. So the default candles are still visible after you turn off this script.
Cari dalam skrip untuk "rsi"

RSI Divergence 2.0RSI Divergence script will paint green or red lines depending on which way the asset is moving. The code is accessible and can be viewed. I have added alerts and the ability to change the source for slow and fast RSI values.
I have yielded better results using OHLC4 rather than the regular closing candles. As you can see it is working well with COINBASE:BTCUSD and works on all timeframes.
Best of luck!

Divergence OBV RSI[mado]Divergence screener for OBV RSI
Regular Bullish: "D" navy label
Hidden Bullish: "H" navy label
Regular Bearish: "D" red label
Hidden Bearish: "H" red label

RSI Oscillator by mattzabRSI-Oscillator is designed to be highly visual, based on strategies that recognize the RSI above 50 to be positive strength, and below 50 to be weakness.
Midpoint is 50, above is blue, below is red.
pooya AVG RSIThis is an RSI range for the most popular index in FOREX:
EUR
USD
GBP
JPY
AUD
CAD
CHF
NZD
comment your opinion
RSI + STOCHRSI - combinedRSI + Stoch RSI combined script
Very usable for free accounts with indicator limits.
Use 2 indicators as 1


RSI with BBs by EddieRSI based on ohlc4 (instead of close) with bollinger bands applied
red/green area = Delta Rsi and BBbase
use upper and lower bb bands as better oversold/overbought signal on high timeframes

RSI Indicator (multi-timeframe)RSI indicator that lets you show a second timeframe. Blue is the current timeframe, red is the "other" timeframe you select. TradingView allows you to input any timeframe, but it generally works best with a longer timeframe than what your chart is using. (E.g. use the 1-hour timeframe along with a 15-minute chart; or the daily timeframe along with a 1-hour chart; or the weekly timeframe along with a daily chart.) This will help you spot divergences at multiple timeframes.
You can turn off the Multi-Timeframe and just use it as a basic RSI indicator. There's an optional signal line for the current timeframe, and optional overbought/oversold highlights on both timeframes.

RSI+STOCHRSI StrategyRSI + STOCHASTIC RSI combination . It is useful for 5 min charts .
Profitable in EOS/BTC and BTC/USDT , don't apply all cryptocurrency.

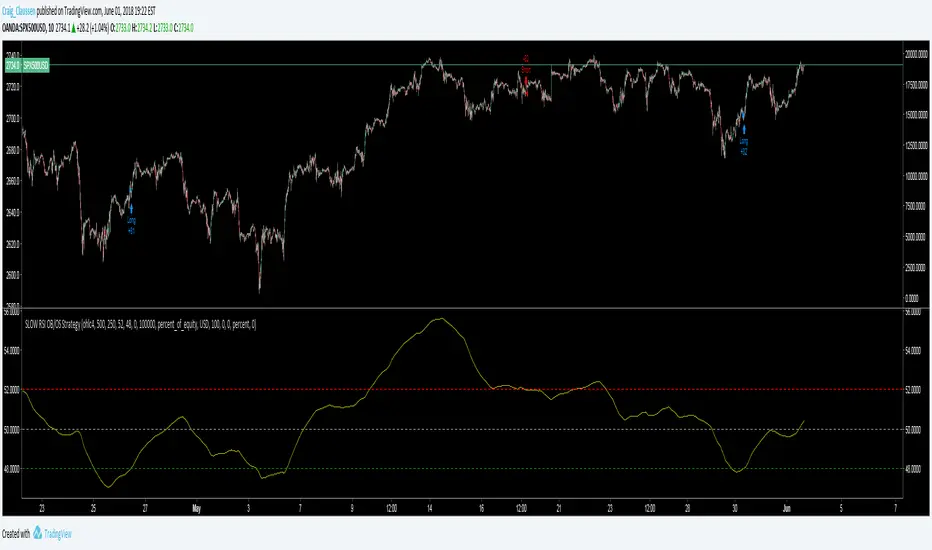
SLOW RSI OB/OS StrategySlowing the RSI down opens up a whole new world of possibilities.
This concept can work for a lot of TA indicators including the MACD.
See script source code for further description. Feel free to add pyramid trades at your own discretion in your format menu.
No this doesn't repaint!
RSI BitfinexRSI applied to BTC longs/shorts ratio on Bitfinex. You can use the oscillator as you'd use RSI:
- Divergences
- Oversold/overbought signals
- R/S on the indicator
- Trend indication
- etc


RSI Divergence Overlay with BGRSI Divergence Overlay with Bullish (Green) and Bearish (Red) notations


RSI 7 avec fenêtre en haut à droiteRsi 7 survente 80 avec fenêtre en haut a droite. En vert en dessous de 80 en rouge au dessus

RSI potente 2.0rsi mas refinado e indicadores correctos a corto ,mediano y largo plazo .. el mejor indicador
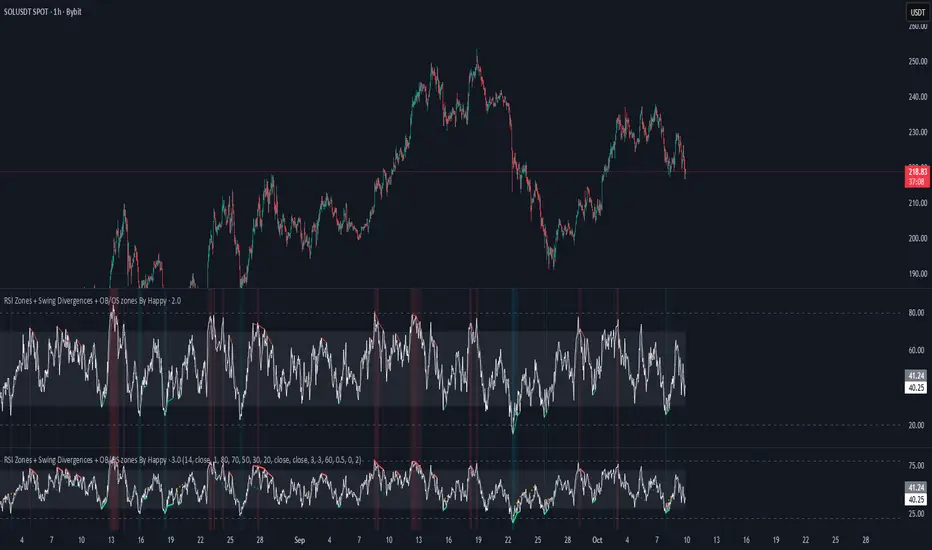
RSI Zones + Swing Divergences + OB/OS zones By HappyRsi with + divergences/ convergences + OB/OS zones
hidden bull/bear