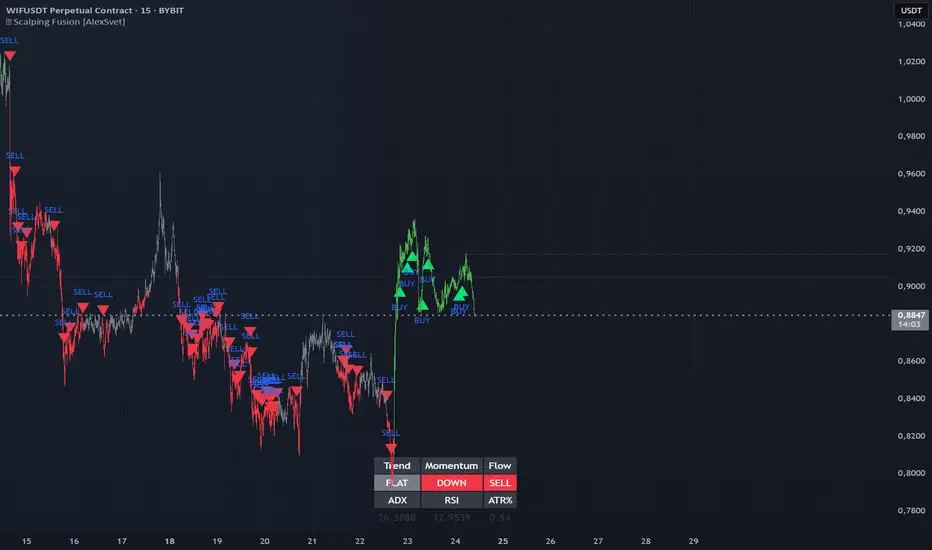
⛓️ Scalping Fusion [AlexSvet]An indicator with a table that takes into account the trend for scalping trading.Penunjuk Pine Script®oleh as11127235
Three-Step 9:30 Range Scalping# Three-Step 9:30 Range Scalping Strategy Rules ## Step 1: Mark the Levels (9:30 AM) - Wait for the **first 5-minute candle** starting at 9:30 AM EST to close - Mark the **HIGH** and **LOW** of this candle - Switch to **1-minute chart** for trading ## Step 2: Find Your Entry (Trade for 1 hour only: 9:30-10:30 AM) ### BREAK Entry - Need: **Fair Value Gap (FVG)** + **ANY** of the 3 FVG candles closes outside the range - FVG = Gap between candle wicks (3-candle pattern) ### TRAP Entry - Need: Break outside range → Retest back inside → Close back outside again ### REVERSAL Entry - Need: Failed break in one direction → Opposite FVG back into the range ## Step 3: Trade Management ### Stop Loss: - **Break/Trap**: Low/High of first candle that closed outside the range - **Reversal**: Low/High of first candle in the FVG pattern ### Take Profit: - **Always 2:1 risk-to-reward ratio** - If you risk $100, you make $200 ## Key Rules: - ✅ **Body close** outside range (not just wicks) - ✅ Trade on **1-minute chart** only - ✅ Only trade **first hour** (9:30-10:30 AM EST) - ✅ **Fixed 2:1** take profit every time - ✅ One strategy, stay consistent **That's it. No complicated indicators, no higher timeframe bias, no guesswork.**Strategi Pine Script®oleh nicolasnourgt94
FlowStateTrader FlowState Trader - Advanced Time-Filtered Strategy ## Overview FlowState Trader is a sophisticated algorithmic trading strategy that combines precision entry signals with intelligent time-based filtering and adaptive risk management. Built for traders seeking to achieve their optimal performance state, FlowState identifies high-probability trading opportunities within user-defined time windows while employing dynamic trailing stops and partial position management. ## Core Strategy Philosophy FlowState Trader operates on the principle that peak trading performance occurs when three elements align: **Focus** (precise entry signals), **Flow** (optimal time windows), and **State** (intelligent position management). This strategy excels at finding reversal opportunities at key support and resistance levels while filtering out suboptimal trading periods to keep traders in their optimal flow state. ## Key Features ### 🎯 Focus Entry System **Support/Resistance Zone Trading**: - Dynamic identification of key price levels using configurable lookback periods - Entry signals triggered when price interacts with these critical zones - Volume confirmation ensures genuine breakout/reversal momentum - Trend filter alignment prevents counter-trend disasters **Entry Conditions**: - **Long Signals**: Price closes above support buffer, touches support level, with above-average volume - **Short Signals**: Price closes below resistance buffer, touches resistance level, with above-average volume - Optional trend filter using EMA or SMA for directional bias confirmation ### ⏰ FlowState Time Filtering System **Comprehensive Time Controls**: - **12-Hour Format Trading Windows**: User-friendly AM/PM time selection - **Multi-Timezone Support**: UTC, EST, PST, CST with automatic conversion - **Day-of-Week Filtering**: Trade only weekdays, weekends, or both - **Lunch Hour Avoidance**: Automatically skips low-volume lunch periods (12-1 PM) - **Visual Time Indicators**: Background coloring shows active/inactive trading periods **Smart Time Features**: - Handles overnight trading sessions seamlessly - Prevents trades during historically poor performance periods - Customizable trading hours for different market sessions - Real-time trading window status in dashboard ### 🛡️ Adaptive Risk Management **Multi-Level Take Profit System**: - **TP1**: First profit target with optional partial position closure - **TP2**: Final profit target for remaining position - **Flexible Scaling**: Choose number of contracts to close at each level **Dynamic Trailing Stop Technology**: - **Three Operating Modes**: - **Conservative**: Earlier activation, tighter trailing (protect profits) - **Balanced**: Optimal risk/reward balance (recommended) - **Aggressive**: Later activation, wider trailing (let winners run) - **ATR-Based Calculations**: Adapts to current market volatility - **Automatic Activation**: Engages when position reaches profitability threshold ### 📊 Intelligent Position Sizing **Contract-Based Management**: - Configurable entry quantity (1-1000 contracts) - Partial close quantities for profit-taking - Clear position tracking and P&L monitoring - Real-time position status updates ### 🎨 Professional Visualization **Enhanced Chart Elements**: - **Entry Zone Highlighting**: Clear visual identification of trading opportunities - **Dynamic Risk/Reward Lines**: Real-time TP and SL levels with price labels - **Trailing Stop Visualization**: Live tracking of adaptive stop levels - **Support/Resistance Lines**: Key level identification - **Time Window Background**: Visual confirmation of active trading periods **Dual Dashboard System**: - **Strategy Dashboard**: Real-time position info, settings status, and current levels - **Performance Scorecard**: Live P&L tracking, win rates, and trade statistics - **Customizable Sizing**: Small, Medium, or Large display options ### ⚙️ Comprehensive Customization **Core Strategy Settings**: - **Lookback Period**: Support/resistance calculation period (5-100 bars) - **ATR Configuration**: Period and multipliers for stops/targets - **Reward-to-Risk Ratios**: Customizable profit target calculations - **Trend Filter Options**: EMA/SMA selection with adjustable periods **Time Filter Controls**: - **Trading Hours**: Start/end times in 12-hour format - **Timezone Selection**: Four major timezone options - **Day Restrictions**: Weekend-only, weekday-only, or unrestricted - **Session Management**: Lunch hour avoidance and custom periods **Risk Management Options**: - **Trailing Stop Modes**: Conservative/Balanced/Aggressive presets - **Partial Close Settings**: Enable/disable with custom quantities - **Alert System**: Comprehensive notifications for all trade events ### 📈 Performance Tracking **Real-Time Metrics**: - Net profit/loss calculation - Win rate percentage - Profit factor analysis - Maximum drawdown tracking - Total trade count and breakdown - Current position P&L **Trade Analytics**: - Winner/loser ratio tracking - Real-time performance scorecard - Strategy effectiveness monitoring - Risk-adjusted return metrics ### 🔔 Alert System **Comprehensive Notifications**: - Entry signal alerts with price and quantity - Take profit level hits (TP1 and TP2) - Stop loss activations - Trailing stop engagements - Position closure notifications ## Strategy Logic Deep Dive ### Entry Signal Generation The strategy identifies high-probability reversal points by combining multiple confirmation factors: 1. **Price Action**: Looks for price interaction with key support/resistance levels 2. **Volume Confirmation**: Ensures sufficient market interest and liquidity 3. **Trend Alignment**: Optional filter prevents counter-trend positions 4. **Time Validation**: Only trades during user-defined optimal periods 5. **Zone Analysis**: Entry occurs within calculated buffer zones around key levels ### Risk Management Philosophy FlowState Trader employs a three-tier risk management approach: 1. **Initial Protection**: ATR-based stop losses set at strategy entry 2. **Profit Preservation**: Trailing stops activate once position becomes profitable 3. **Scaled Exit**: Partial profit-taking allows for both security and potential ### Time-Based Edge The time filtering system recognizes that not all trading hours are equal: - Avoids low-volume, high-spread periods - Focuses on optimal liquidity windows - Prevents trading during news events (lunch hours) - Allows customization for different market sessions ## Best Practices and Optimization ### Recommended Settings **For Scalping (1-5 minute charts)**: - Lookback Period: 10-20 - ATR Period: 14 - Trailing Stop: Conservative mode - Time Filter: Major session hours only **For Day Trading (15-60 minute charts)**: - Lookback Period: 20-30 - ATR Period: 14-21 - Trailing Stop: Balanced mode - Time Filter: Extended trading hours **For Swing Trading (4H+ charts)**: - Lookback Period: 30-50 - ATR Period: 21+ - Trailing Stop: Aggressive mode - Time Filter: Disabled or very broad ### Market Compatibility - **Forex**: Excellent for major pairs during active sessions - **Stocks**: Ideal for liquid stocks during market hours - **Futures**: Perfect for index and commodity futures - **Crypto**: Effective on major cryptocurrencies (24/7 capability) ### Risk Considerations - **Market Conditions**: Performance varies with volatility regimes - **Timeframe Selection**: Lower timeframes require tighter risk management - **Position Sizing**: Never risk more than 1-2% of account per trade - **Backtesting**: Always test on historical data before live implementation ## Educational Value FlowState serves as an excellent learning tool for: - Understanding support/resistance trading - Learning proper time-based filtering - Mastering trailing stop techniques - Developing systematic trading approaches - Risk management best practices ## Disclaimer This strategy is for educational and informational purposes only. Past performance does not guarantee future results. Trading involves substantial risk of loss and is not suitable for all investors. Users should thoroughly backtest the strategy and understand all risks before live trading. Always use proper position sizing and never risk more than you can afford to lose. --- *FlowState Trader represents the evolution of systematic trading - combining classical technical analysis with modern risk management and intelligent time filtering to help traders achieve their optimal performance state through systematic, disciplined execution.*Strategi Pine Script®oleh TradeManager_PRO11149
🔍 Confirmed Scalping Signals (Stoch+EMA+Supertrend)🔍 Confirmed Scalping Signals (Stoch+EMA+Supertrend)Penunjuk Pine Script®oleh shaonahamed65386
AUD/USD 1-Min Scalping Strategy with LabelsHere’s a complete TradingView Pine Script v5 for the 1-minute AUD/USD scalping strategy we just discussed. This strategy uses: EMA 13 and EMA 26 for trend filtering Bollinger Bands for volatility extremes RSI (4) for momentum confirmationStrategi Pine Script®oleh Borderrrr946
Time-Price Velocity [QuantAlgo]🟢 Overview The Time-Price Velocity indicator uses advanced velocity-based analysis to measure the rate of price change normalized against typical market movement, creating a dynamic momentum oscillator that identifies market acceleration patterns and momentum shifts. Unlike traditional momentum indicators that focus solely on price change magnitude, this indicator incorporates time-weighted displacement calculations and ATR normalization to create a sophisticated velocity measurement system that adapts to varying market volatility conditions. This indicator displays a velocity signal line that oscillates around zero, with positive values indicating upward price velocity and negative values indicating downward price velocity. The signal incorporates acceleration background columns and statistical normalization to help traders identify momentum shifts and potential reversal or continuation opportunities across different timeframes and asset classes. 🟢 How It Works The indicator's key insight lies in its time-price velocity calculation system, where velocity is measured using the fundamental physics formula: velocity = priceChange / timeWeight The system normalizes this raw velocity against typical price movement using Average True Range (ATR) to create market-adjusted readings: normalizedVelocity = typicalMove > 0 ? velocity / typicalMove : 0 where "typicalMove = ta.atr(lookback)" provides the baseline for normal price movement over the specified lookback period. The Time-Price Velocity indicator calculation combines multiple sophisticated components. First, it calculates acceleration as the change in velocity over time: acceleration = normalizedVelocity - normalizedVelocity Then, the signal generation applies EMA smoothing to reduce noise while preserving responsiveness: signal = ta.ema(normalizedVelocity, smooth) This creates a velocity-based momentum indicator that combines price displacement analysis with statistical normalization, providing traders with both directional signals and acceleration insights for enhanced market timing. 🟢 How to Use 1. Signal Interpretation and Threshold Zones Positive Values (Above Zero): Time-price velocity indicating bullish momentum with upward price displacement relative to normalized baseline Negative Values (Below Zero): Time-price velocity indicating bearish momentum with downward price displacement relative to normalized baseline Zero Line Crosses: Velocity transitions between bullish and bearish regimes, indicating potential trend changes or momentum shifts Upper Threshold Zone: Area above positive threshold (default 1.0) indicating strong bullish velocity and potential reversal point Lower Threshold Zone: Area below negative threshold (default -1.0) indicating strong bearish velocity and potential reversal point 2. Acceleration Analysis and Visual Features Acceleration Columns: Background histogram showing velocity acceleration (the rate of change of velocity), with green columns indicating accelerating velocity and red columns indicating decelerating velocity. The interpretation depends on trend context: red columns in downtrends indicate strengthening bearish momentum, while red columns in uptrends indicate weakening bullish momentum Acceleration Column Height: The height of each column represents the magnitude of acceleration, with taller columns indicating stronger acceleration or deceleration forces Bar Coloring: Optional price bar coloring matches velocity direction for immediate visual trend confirmation Info Table: Real-time display of current velocity and acceleration values with trend arrows and change indicators 3. Additional Features: Confirmed vs Live Data: Toggle between confirmed (closed) bar analysis for stable signals or current bar inclusion for real-time updates Multi-timeframe Adaptability: Velocity normalization ensures consistent readings across different chart timeframes and asset volatilities Alert System: Built-in alerts for threshold crossovers and direction changes 🟢 Examples with Preconfigured Settings Default : Balanced configuration suitable for most timeframes and general trading applications, providing optimal balance between sensitivity and noise filtering for medium-term analysis. Scalping : High sensitivity setup with shorter lookback period and reduced smoothing for ultra-short-term trades on 1-15 minute charts, optimized for capturing rapid momentum shifts and frequent trading opportunities. Swing Trading : Extended lookback period with enhanced smoothing and higher threshold for multi-day positions, designed to filter market noise while capturing significant momentum moves on 1-4 hour and daily timeframes. Penunjuk Pine Script®oleh QuantAlgo55276
Clarix 5m Scalping Breakout StrategyPurpose A 5-minute scalping breakout strategy designed to capture fast 3-5 pip moves, using premium/discount zone filters and market bias conditions. How It Works The script monitors price action in 5-minute intervals, forming a 15-minute high and low range by tracking the highs and lows of the first 3 consecutive 5-minute candles starting from a custom time. In the next 3 candles, it waits for a breakout above the 15m high or below the 15m low while confirming market bias using custom equilibrium zones. Buy signals trigger when price breaks the 15m high while in a discount zone Sell signals trigger when price breaks the 15m low while in a premium zone The strategy simulates trades with fixed 3-5 pip take profit and stop loss values (configurable). All trades are recorded in a backtest table with live trade results and an automatically updated win rate. Features Designed exclusively for the 5-minute timeframe Custom 15-minute high/low breakout logic Premium, Discount, and Equilibrium zone display Built-in backtest tracker with live trade results, statistics, and win rate Customizable start time, take profit, and stop loss settings Real-time alerts on breakout signals Visual markers for trade entries and failed trades Consistent win rate exceeding 90–95% on average when following market conditions Usage Tips Use strictly on 5-minute charts for accurate signal performance. Avoid during high-impact news releases. Important: Once a trade is opened, manually set your take profit at +3 to +5 pips immediately to secure the move, as these quick scalps often hit the target within a single candle. This prevents missed exits during rapid price action.Penunjuk Pine Script®oleh Maryam_Alghamdi22187
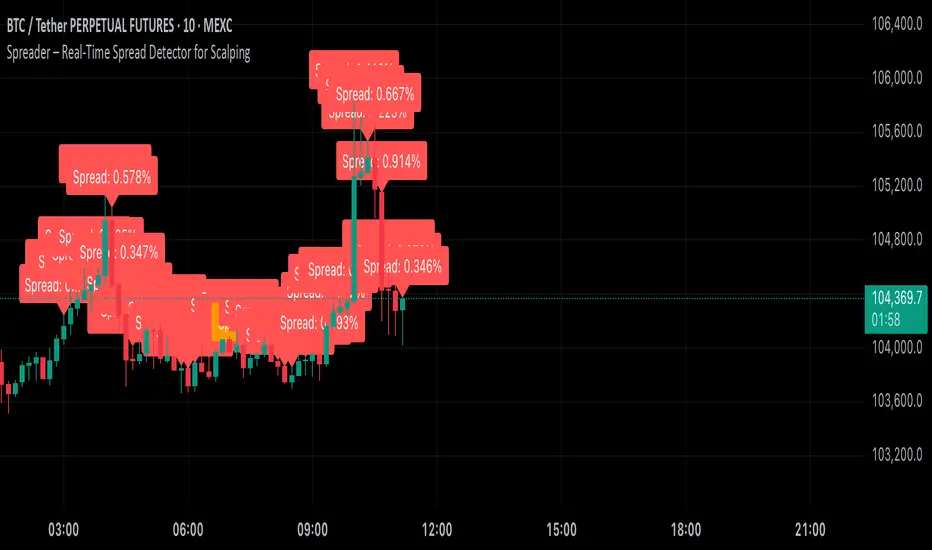
Spreader – Real-Time Spread Detector for ScalpingSpreader is a professional tool built for scalpers and intraday traders, designed to visually display live bid-ask spread on your chart. By showing you the true market friction in real time, it helps you avoid poor entries and reduce immediate trade losses. Penunjuk Pine Script®oleh safak3026760
ChopFlow ATR Scalp StrategyA lean, high-velocity scalp framework for NQ and other futures that blends trend clarity, volume confirmation, and adaptive exits to give you precise, actionable signals—no cluttered bands or lagging indicators. ⸻ 🔍 Overview This strategy locks onto rapid intraday moves by: • Filtering for directional momentum with the Choppiness Index (CI) • Confirming conviction via On-Balance Volume (OBV) against its moving average • Automatically sizing stops and targets with a multiple of the Average True Range (ATR) It’s designed for scalp traders who need clean, timely entries without wading through choppy noise. ⸻ ⚙️ Key Features & Inputs 1. ATR Length & Multiplier • Controls exit distances based on current volatility. 2. Choppiness Length & Threshold • Measures trend strength; only fires when the market isn’t “stuck in the mud.” 3. OBV SMA Length • Smoothes volume flow to confirm genuine buying or selling pressure. 4. Custom Session Hours • Avoid overnight gaps or low-liquidity periods. All inputs are exposed for rapid tuning to your preferred scalp cadence. 🚀 How It Works 1. Long Entry triggers when: • CI < threshold (strong trend) • OBV > its SMA (positive volume flow) • You’re within the defined session 2. Short Entry mirrors the above (CI < threshold, OBV < SMA) 3. Exit uses ATR × multiplier for both stop-loss and take-profit ⸻ 🎯 Usage Tips • Start with defaults (ATR 14, multiplier 1.5; CI 14, threshold 60; OBV SMA 10). • Monitor signal frequency, then tighten/loosen CI or OBV look-back as needed. • Pair with a fast MA crossover or price-action trigger if you want even sharper timing. • Backtest across different sessions (early open vs. power hours) to find your edge. ⸻ ⚠️ Disclaimer This script is provided “as-is” for educational and research purposes. Always paper-trade any new setup extensively before deploying live capital, and adjust risk parameters to your personal tolerance. ⸻ Elevate your scalp game with ChopFlow ATR—where trend, volume, and volatility converge for clear, confident entries. Happy scalping!Strategi Pine Script®oleh TheFuturesPlaybookTelah dikemas kini 155
Triple Confirmation Scalper v2 - Alarm CompatibleTriple Confirmation Scalper Strategy A high-probability scalping strategy combining trend momentum, overbought/sold conditions, and volume confirmation to filter low-noise signals. 📊 Strategy Logic Trend Direction Dual EMA crossover (9 & 21 periods) for momentum and trend bias. Overbought/Oversold Zones RSI (14-period) to avoid entries at extremes. Volume Spike Filter OBV + 20-period volume average to confirm breakout validity. Dynamic Risk Management Stop-loss: Adaptive to recent price action (5-candle low/high ±1%). Take-profit: 1.5% target (1.5:1 risk/reward). 🔍 Advanced Features Precision VWAP (20-period, HLC3-based) for dynamic S/R levels. Visual Aids: EMA/VWAP bands + trend-colored background. Volume spike alerts. TradingView Alerts pre-configured for long/short signals. ⚙️ Default Settings Commission: 0.1% factored into backtests. Mode: Supports both long/short positions. ⚠️ Disclaimer This is a technical analysis tool, not financial advice. Past performance ≠ future results. Test thoroughly in a demo account. Adjust parameters (e.g., EMA periods, RSI thresholds) to match your risk tolerance. ✅ TradingView Compliance Notes: No exaggerated claims (e.g., "100% win rate"). Clear disclaimer included. Focus on objective strategy logic (no promotional language). Penunjuk Pine Script®oleh prepheadrus46
Institutional Quantum Momentum Impulse [BullByte]## Overview The Institutional Quantum Momentum Impulse (IQMI) is a sophisticated momentum oscillator designed to detect institutional-level trend strength, volatility conditions, and market regime shifts. It combines multiple advanced technical concepts, including: - Quantum Momentum Engine (Hilbert Transform + MACD Divergence + Stochastic Energy) - Fractal Volatility Scoring (GARCH + Keltner-based volatility) - Dynamic Adaptive Bands (Self-adjusting thresholds based on efficiency) - Market Phase Detection (Volume + Momentum alignment) - Liquidity & Cumulative Delta Analysis The indicator provides a Z-score normalized momentum reading, making it ideal for mean-reversion and trend-following strategies. --- ## Key Features ### 1. Quantum Momentum Core - Combines Hilbert Transform, MACD divergence, and Stochastic Energy into a single composite momentum score. - Normalized using a Z-score for statistical significance. - Smoothed with EMA/WMA/HMA for cleaner signals. ### 2. Dynamic Adaptive Bands - Upper/Lower bands adjust based on volatility and efficiency ratio . - Acts as overbought/oversold zones when momentum reaches extremes. ### 3. Market Phase Detection - Identifies bullish , bearish , or neutral phases using: - Volume-Weighted MA alignment - Fractal momentum extremes ### 4. Volatility & Liquidity Filters - Fractal Volatility Score (0-100 scale) shows market instability. - Liquidity Check ensures trades are taken in favorable spread conditions. ### 5. Dashboard & Visuals - Real-time dashboard with key metrics: - Momentum strength, volatility, efficiency, cumulative delta, and market regime. - Gradient coloring for intuitive momentum visualization . --- ## Best Trade Setups ### 1. Trend-Following Entries - Signal : - QM crosses above zero + Market Phase = Bullish + ADX > 25 - Cumulative Delta rising (buying pressure) - Confirmation : - Efficiency > 0.5 (strong momentum quality) - Liquidity = High (tight spreads) ### 2. Mean-Reversion Entries - Signal : - QM touches upper band + Volatility expanding - Market Regime = Ranging (ADX < 25) - Confirmation : - Efficiency < 0.3 (weak momentum follow-through) - Cumulative Delta divergence (price high but delta declining) ### 3. Breakout Confirmation - Signal : - QM holds above zero after a pullback - Market Phase shifts to Bullish/Bearish - Confirmation : - Volatility rising (expansion phase) - Liquidity remains high --- ## Recommended Timeframes - Intraday (5M - 1H): Works well for scalping & swing trades. - Swing Trading (4H - Daily): Best for trend-following setups. - Position Trading (Weekly+): Useful for macro trend confirmation. --- ## Input Customization - Resonance Factor (1.0 - 3.618 ): Adjusts MACD divergence sensitivity. - Entropy Filter (0.382/0.50/0.618) : Controls stochastic damping. - Smoothing Type (EMA/WMA/HMA) : Changes momentum responsiveness. - Normalization Period : Adjusts Z-score lookback. --- The IQMI is a professional-grade momentum indicator that combines institutional-level concepts into a single, easy-to-read oscillator. It works across all markets (stocks, forex, crypto) and is ideal for traders who want: ✅ Early trend detection ✅ Volatility-adjusted signals ✅ Institutional liquidity insights ✅ Clear dashboard for quick analysis Try it on TradingView and enhance your trading edge! 🚀 Happy Trading! - BullBytePenunjuk Pine Script®oleh BullByteTelah dikemas kini 88541
Quarterly Theory ICT 03 [TradingFinder] Precision Swing Points🔵 Introduction Precision Swing Point (PSP) is a divergence pattern in the closing of candles between two correlated assets, which can indicate a potential trend reversal. This structure appears at market turning points and highlights discrepancies between the price behavior of two related assets. PSP typically forms in key timeframes such as 5-minute, 15-minute, and 90-minute charts, and is often used in combination with Smart Money Concepts (SMT) to confirm trade entries. PSP is categorized into Bearish PSP and Bullish PSP : Bearish PSP : Occurs when an asset breaks its previous high, and its middle candle closes bullish, while the correlated asset closes bearish at the same level. This divergence signals weakness in the uptrend and a potential price reversal downward. Bullish PSP : Occurs when an asset breaks its previous low, and its middle candle closes bearish, while the correlated asset closes bullish at the same level. This suggests weakness in the downtrend and a potential price increase. 🟣 Trading Strategies Using Precision Swing Point (PSP) PSP can be integrated into various trading strategies to improve entry accuracy and filter out false signals. One common method is combining PSP with SMT (divergence between correlated assets), where traders identify divergence and enter a trade only after PSP confirms the move. Additionally, PSP can act as a liquidity gap, meaning that price tends to react to the wick of the PSP candle, making it a favorable entry point with a tight stop-loss and high risk-to-reward ratio. Furthermore, PSP combined with Order Blocks and Fair Value Gaps in higher timeframes allows traders to identify stronger reversal zones. In lower timeframes, such as 5-minute or 15-minute charts, PSP can serve as a confirmation for more precise entries in the direction of the higher timeframe trend. This is particularly useful in scalping and intraday trading, helping traders execute smarter entries while minimizing unnecessary stop-outs. 🔵 How to Use PSP is a trading pattern based on divergence in candle closures between two correlated assets. This divergence signals a difference in trend strength and can be used to identify precise market turning points. PSP is divided into Bullish PSP and Bearish PSP, each applicable for long and short trades. 🟣 Bullish PSP A Bullish PSP forms when, at a market turning point, the middle candle of one asset closes bearish while the correlated asset closes bullish. This discrepancy indicates weakness in the downtrend and a potential price reversal upward. Traders can use this as a signal for long (buy) trades. The best approach is to wait for price to return to the wick of the PSP candle, as this area typically acts as a liquidity level. f PSP forms within an Order Block or Fair Value Gap in a higher timeframe, its reliability increases, allowing for entries with tight stop-loss and optimal risk-to-reward ratios. 🟣 Bearish PSP A Bearish PSP forms when, at a market turning point, the middle candle of one asset closes bullish while the correlated asset closes bearish. This indicates weakness in the uptrend and a potential price decline. Traders use this pattern to enter short (sell) trades. The best entry occurs when price retests the wick of the PSP candle, as this level often acts as a resistance zone, pushing price lower. If PSP aligns with a significant liquidity area or Order Block in a higher timeframe, traders can enter with greater confidence and place their stop-loss just above the PSP wick. Overall, PSP is a highly effective tool for filtering false signals and improving trade entry precision. Combining PSP with SMT, Order Blocks, and Fair Value Gaps across multiple timeframes allows traders to execute higher-accuracy trades with lower risk. 🔵 Settings Mode : 2 Symbol : Identifies PSP and PCP between two correlated assets. 3 Symbol : Compares three assets to detect more complex divergences and stronger confirmation signals. Second Symbol : The second asset used in PSP and correlation calculations. Third Symbol : Used in three-symbol mode for deeper PSP and PCP analysis. Filter Precision X Point : Enables or disables filtering for more precise PSP and PCP detection. This filter only identifies PSP and PCP when the base asset's candle qualifies as a Pin Bar. Trend Effect : By changing the Trend Effect status to "Off," all Pin bars, whether bullish or bearish, are displayed regardless of the current market trend. If the status remains "On," only Pin bars in the direction of the main market trend are shown. Bullish Pin Bar Setting : Using the "Ratio Lower Shadow to Body" and "Ratio Lower Shadow to Higher Shadow" settings, you can customize your bullish Pin bar candles. Larger numbers impose stricter conditions for identifying bullish Pin bars. Bearish Pin Bar Setting : Using the "Ratio Higher Shadow to Body" and "Ratio Higher Shadow to Lower Shadow" settings, you can customize your bearish Pin bar candles. Larger numbers impose stricter conditions for identifying bearish Pin bars. 🔵 Conclusion Precision Swing Point (PSP) is a powerful analytical tool in Smart Money trading strategies, helping traders identify precise market turning points by detecting divergences in candle closures between correlated assets. PSP is classified into Bullish PSP and Bearish PSP, each playing a crucial role in detecting trend weaknesses and determining optimal entry points for long and short trades. Using the PSP wick as a key liquidity level, integrating it with SMT, Order Blocks, and Fair Value Gaps, and analyzing higher timeframes are effective techniques to enhance trade entries. Ultimately, PSP serves as a complementary tool for improving entry accuracy and reducing unnecessary stop-outs, making it a valuable addition to Smart Money trading methodologies.Penunjuk Pine Script®oleh TFlab55607
Static price-range projection by symbolThis indicator shows you a predefined range to the right of the last candle of your chart. This range is custom and can be changed for a handful of symbols that you can choose. This scale will help you determining if the market is providing a reasonable range before you enter a trade or if the market isn't actually moving as much as you might think. This is particularly useful if you are into scalping and have to consider commission or spread in your trades. Since all symbols have different price ranges in which they move this indicator doesn't make sense to just have "a one size fits all" approach. That's why you can choose up to 6 symbols and set the range that you want to have shown for each when you pull it up on the chart. Using my default values that means for when the NQ (Nasdaq future) is on the chart you will see a range of 20 handles projected. When you change the the ES (S&P500 future) you will instead see 5 handles. While the number is different that is somewhat of an equal move in both symbols. There also is an option to set a default price range for all other symbols that are not selected if it is needed. However the display of the scale on anything else than the 6 selected symbols can also be turned off. There are options provided on how exactly you want to indicator to determine if the chart symbol matches one of the selected symbols. You can enable it to make sure the exchange/broker is the exact same as selected. It can check for only the symbol root to match the selection. Specifically for futures this means that while ES1! might be selected, anything ES (ES1!, ES2!, ESH2025, ESM2025, ESM2022, ...) will be a match to the selection) On the painted scale it is possible to not just show this range extended into each direction once. Per default you will have 3 segments of it in each direction. This can be reduced to just 1 or increased. If you chose a high number of segments or a large range make sure to use the "Scale price chart only" option on your chart scale to not have the symbols price candles squished together by the charts auto scaling. And last but not least the indicator options provide some possibilities to change the appearance of the printed price range scale in case you disagree with my design.Penunjuk Pine Script®oleh Remote-TradingTelah dikemas kini 45
Sideways Scalper Peak and BottomUnderstanding the Indicator This indicator is designed to identify potential peaks (tops) and bottoms (bottoms) within a market, which can be particularly useful in a sideways or range-bound market where price oscillates between support and resistance levels without a clear trend. Here's how it works: RSI (Relative Strength Index): Measures the speed and change of price movements to identify overbought (above 70) and oversold (below 30) conditions. In a sideways market, RSI can help signal when the price might be due for a reversal within its range. Moving Averages (MAs): The Fast MA and Slow MA provide a sense of the short-term and longer-term average price movements. In a sideways market, these can help confirm if the price is at the upper or lower extremes of its range. Volume Spike: Looks for significant increases in trading volume, which might indicate a stronger move or a potential reversal point when combined with other conditions. Divergence: RSI divergence occurs when the price makes a new high or low, but the RSI does not, suggesting momentum is weakening, which can be a precursor to a reversal. How to Use in a Sideways Market Identify the Range: First, visually identify the upper resistance and lower support levels of the sideways market on your chart. This indicator can help you spot these levels more precisely by signaling potential peaks and bottoms. Peak Signal : When to Look: When the price approaches the upper part of the range. Conditions: The indicator will give a 'Peak' signal when: RSI is over 70, indicating overbought conditions. There's bearish divergence (price makes a higher high, but RSI doesn't). Volume spikes, suggesting strong selling interest. Price is above both Fast MA and Slow MA, indicating it's at a potentially high point in the range. Action: This signal suggests that the price might be at or near the top of its range and could reverse downwards. A trader might consider selling or shorting here, expecting the price to move towards the lower part of the range. Bottom Signal: When to Look: When the price approaches the lower part of the range. Conditions: The indicator will give a 'Bottom' signal when: RSI is below 30, indicating oversold conditions. There's bullish divergence (price makes a lower low, but RSI doesn't). Volume spikes, suggesting strong buying interest. Price is below both Fast MA and Slow MA, indicating it's at a potentially low point in the range. Action: This signal suggests that the price might be at or near the bottom of its range and could reverse upwards. A trader might consider buying here, expecting the price to move towards the upper part of the range. Confirmation: In a sideways market, false signals can occur due to the lack of a strong trend. Always look for confirmation: Volume Confirmation: A significant volume spike can add confidence to the signal. Price Action: Look for price action like candlestick patterns (e.g., doji, engulfing patterns) that confirm the reversal. Time Frame: Consider using this indicator on multiple time frames. A signal on a shorter time frame (like 15m or 1h) might be confirmed by similar conditions on a longer time frame (4h or daily). Risk Management: Since this is designed for scalping in a sideways market: Set Tight Stop-Losses: Due to the quick nature of reversals in range-bound markets, place stop-losses close to your entry to minimize loss. Take Profit Levels: Set profit targets near the opposite end of the range or use a trailing stop to capture as much of the move as possible before it reverses again. Practice: Before trading with real money, practice with this indicator on historical data or in a paper trading environment to understand how it behaves in different sideways market scenarios. Key Points for New Traders Patience: Wait for all conditions to align before taking a trade. Sideways markets require patience as the price might hover around these levels for a while. Not All Signals Are Equal: Sometimes, even with all conditions met, the market might not reverse immediately. Look for additional context or confirmation. Continuous Learning: Understand that this indicator, like any tool, isn't foolproof. Learn from each trade, whether it's a win or a loss, and adjust your strategy accordingly. By following these guidelinesPenunjuk Pine Script®oleh Trading_Indicator_ProTelah dikemas kini 44881
Multi Stochastic AlertHello Everyone, I have created a Multi Stochastic Alert based on Scalping Strategy The Strategy uses below 4 Stochastic indicator: 1. Stochastic (9,3) 2. Stochastic (14,3) 3. Stochastic (40,4) 4. Stochastic (60,10) Trade entry become active when all of these goes below 20 or above 80, In this indicator you don't need to use all 4, this will show red and green background whenever all of them goes below 20 or above 80. As shown in picture below, it works better when script is making a channel, Our indicator shows green or red signal, we wait for RSI Divergence and we enter. We book when blue line (9,3) goes above 80, as shown by arrow, and trail rest at breakeven or your own trailing method Same Situation shown for Short side. We book 50% when Blue line (9,3) Goes below 20 and trail rest at breakeven or your own trailing method Happy trading, Let me know if any improvements required. Penunjuk Pine Script®oleh IMStockwala55177
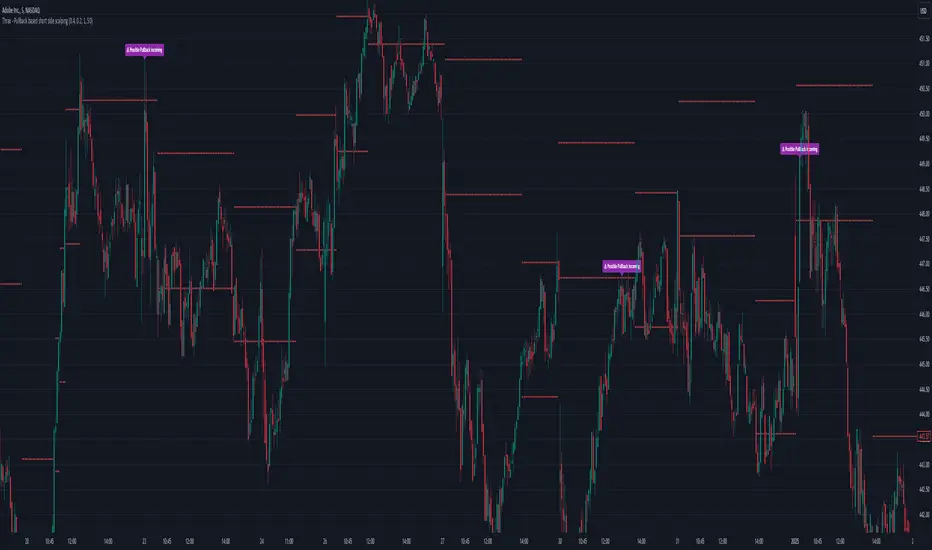
Thrax - Pullback based short side scalping⯁ This indicator is built for short trades only. ⤞ Pullback based scalping is a strategy where a trader anticipates a pullback and makes a quick scalp in this pullback. This strategy usually works in a ranging market as probability of pullbacks occurrence in ranging market is quite high. ⤞ The strategy is built by first determining a possible candidate price levels having high chance of pullbacks. This is determined by finding out multiple rejection point and creating a zone around this price. A rejection is considered to be valid only if it comes to this zone after going down by a minimum pullback percentage. Once the price has gone down by this minimum pullback percentage multiple times and reaches the zone again chances of pullback goes high and an indication on chart for the same is given. ⯁ Inputs ⤞ Zone-Top : This input parameter determines the upper range for the price zone. ⤞ Zone bottom : This input parameter determines the lower range for price zone. ⤞ Minimum Pullback : This input parameter determines the minimum pullback percentage required for valid rejection. Below is the recommended settings ⤞ Lookback : lookback period before resetting all the variables ⬦Below is the recommended settings across timeframes ⤞ 15-min : lookback – 24, Pullback – 2, Zone Top Size %– 0.4, Zone Bottom Size % – 0.2 ⤞ 5-min : lookback – 50, pullback – 1% - 1.5%, Zone Top Size %– 0.4, Zone Bottom Size % – 0.2 ⤞ 1-min : lookback – 100, pullback – 1%, Zone Top Size %– 0.4, Zone Bottom Size % – 0.2 ⤞ Anything > 30-min : lookback – 11, pullback – 3%, Zone Top Size %– 0.4, Zone Bottom Size % – 0.2 ✵ This indicator gives early pullback detection which can be used in below ways 1. To take short trades in the pullback. 2. To use this to exit an existing position in the next few candles as pullback may be incoming. 📌 Kindly note, it’s not necessary that pullback will happen at the exact point given on the chart. Instead, the indictor gives you early signals for the pullback ⯁ Trade Steup 1. Wait for pullback signal to occur on the chart. 2. Once the pullback warning has been displayed on the chart, you can either straight away enter the short position or wait for next 2-4 candles for initial sign of actual pullback to occurrence. 3. Once you have initiated short trade, since this is pullback-based strategy, a quick scalp should be made and closed as price may resume it’s original direction. If you have risk appetite you can stay in the trade longer and trial the stops if price keeps pulling back. 4. You can zone top as your stop, usually zone top + some% should be used as stop where ‘some %’ is based on your risk appetite. 5. It’s important to note that this indicator gives early sings of pullback so you may actually wait for 2-3 candles post ‘Pullback warning’ occurs on the chart before entering short trade.Penunjuk Pine Script®oleh thraxalgoTelah dikemas kini 74
Volume Footprint Voids [BigBeluga]Volume Footprint Voids is a unique tool that uses lower timeframe calculation to plot different styles of single candle POC. This indicator is very powerful for scalping and finding very precise entry and exits, spotting potential trapped traders, and more. Unlike many other volume profiles, this aims to plot single candle profiles as well as their own footprints. 🔶 FEATURES The script includes the following settings: Windows: Plotting style and calculations Coloring modes Display modes lower-timeframe calculations 🔶 CALCULATION In the image above we can see how the script calculates each level position that will serve as a calculation process to see how much volume/closes there are within the levels. In the image above, we can have a more clear example of how we count each candle close. We use the prior screenshot as an example, after setting each level we will use the lower-timeframe input to measure the amount of closes within the ranges. Depending on the lot size, the box will be larger or smaller, usually the POC will always have the highest box size. NOTE: Size is the starting point, always from the low of the candle. To find more voids, select a closer LTF to the current one you're using. To find fewer voids, select a timeframe away from your current one. Due to Pine Script limitations, we are only able to plot a certain amount of footprints, and we can't plot the whole history chart. POC will be the largest block displayed, indicating the time point of control Gray areas are closes above the average Black are Void or imbalance that price will fill in the future, like FVG The image above shows an incorrect size input that will lead to bad calculations, while on the other side, a correct size input that will lead to a clear vision and better calculation. 🔶 WINDOWS The "▲▼" Mode will display delta buyers and delta sellers coloring with voids as black. It also offers a gradient mode for a beautier visualization The "Total Volume" mode will display the net volume within the lot size (closes within the levels). This is useful to spot possible highest net volume within the same highest lot size. The "POC + Gaps" will show both POC and Gaps as the highest block while all the rest will be considered as the smaller block. This is useful to see where the highest lot were and if there are higher or lower imbalances within the candle The last option "Gaps" will simply display the gaps as the highest block, while the POC as the lowest block. This is useful to have a better view of the gaps areas 🔶 EXAMPLE This is one of the most basic examples of how this script can be used. POC at the bottom creating a strong support area as price holds and creates higher voids gap that price fills while rising. 🔶 SETTINGS Users have full control over the script, from colors to choosing the lower-timeframe inputs to disabling the lot size.Penunjuk Pine Script®oleh BigBeluga4444 6.6 K
Bank Nifty ScalpingThis indicator is designed for scalping purposes. Users have the option to input the desired source and enable or disable the following indicators: Multiple EMA (Exponential moving average) Simultaneously displays multiple moving averages to quickly identify shifts in momentum and obtain confirmation from slower-moving averages. By default, the EMA display settings are configured to show the 20-day EMA and the 200-day EMA. However, users have the flexibility to modify the display settings according to their preferences. This means that users can customize the indicator to show the EMA values of their choice, such as EMA 50 and EMA 100. VWAP ( Volume weighted average price ) Default value is set to ‘hl2’ A bullish trend is indicated when the price is above the Volume Weighted Average Price (VWAP), while a bearish trend is indicated when the price is below the VWAP. VWMA ( Volume weighted moving average ) In the VWMA (Volume Weighted Moving Average) indicator, a default value of 20 is used. If the price is higher than the VWMA, it typically indicates a bullish trend. Conversely, if the price is lower than the VWMA, it suggests a bearish trend. The VWMA takes into account both price and volume, providing a weighted average that can help identify shifts in market sentiment. Multiple SuperTrends Default value is 10 and 2 / 10 and 3 A bullish trend is identified when the price is above the SuperTrend indicator, whereas a bearish trend is observed when the price is below the SuperTrend indicator. Camarilla Pivot Points (Level 3 and 4 only) Levels 3 and 4 serve as crucial support and resistance levels, acting as the final line of defense against strong trends. These levels are expected to generate reversals, where price often changes direction. CPR ( Central Pivot Points) The Daily Central Pivot Point Indicator is a popular tool used in technical analysis. It calculates several levels based on the previous day's high, low, and closing prices. Strong Volume The user has the ability to set the average volume for Nifty and BankNifty indices to calculate strong volume. Elder Impulse System The Impulse System, developed by Alexander Elder and discussed in his book "New Trading for a Living," is a censorship trading system designed to determine whether a trade should be allowed or prohibited. Additionally, it can be used to identify when a trend is starting to weaken. The Impulse System relies on the following factors: 1. Slope of a Fast Exponential Moving Average (EMA): The fast EMA's slope reflects the price's inertia or momentum. 2. Slope of the Moving Average Convergence Divergence (MACD): The MACD's slope indicates the strength or power of the price movement. Based on these factors, the Impulse System categorizes candles or price bars into three colors: * Green Candle: When both the fast EMA and MACD are rising, indicating upward momentum. * Red Candle: When both the fast EMA and MACD are declining, suggesting downward momentum. * Blue Candle: In all other cases where the conditions for green or red candles are not met, representing a neutral or uncertain market condition. By applying the Impulse System, traders can gain insights into the market trend, its strength, and potential shifts in momentum, helping them make informed trading decisions. Happy Trading Penunjuk Pine Script®oleh DanSibTelah dikemas kini 3333798
3 Fib EMAs To Scalp Them AllThe "3 Fib EMAs To Scalp Them All" was made in order to clear up when we should look for shorts, longs, or walk away. Also it can alert you when a trend starts, or when there is a possible reversal. I use it for scalping/day trading in 5m-1h timeframes. 1. EMAs: By default, the indicator uses Fibonacci numbers (21, 55, 233), but you can change them. 2. Color Changes: The color of the Micro EMA line changes depending on its relation to the Mid and Macro EMAs. When Micro EMA < Mid < Macro EMA, it turns red, indicating a potential bearish trend - that's when you should look for shorts When Micro EMA > Mid > Macro EMA, it turns green, indicating a potential bullish trend - that's when you should look for longs A white Micro EMA is when you need to take some rest, enjoy your coffee, and avoid overtrading. 3. Signals: The indicator provides visual signals in the form of diamonds and crosses and corresponding alert signals. A red diamond above the bar signals a potential beginning of a downtrend A red cross above the bar signals the end of the downtrend and can be used as a signal for a possible reversal up/breakout. A green diamond below the bar signals a potential beginning of a downtrend, A green cross below the bar signals the end of the uptrend and can be used as a signal for a possible reversal down/breakout. 4. Alerts: For algo traders and people who prefer to stay away from the monitor... there are alerts for every signal. Friendly note: Don't blindly follow the signals for your long and short entries. The signals only pop up when the EMA cross value gets a confirmation. A smart move would be to wait for a retracement to the EMA line and use momentum indicators like market cipher B to pinpoint those ideal entry points.Penunjuk Pine Script®oleh JohannCoffeeTelah dikemas kini 55900
Exhaustion Improved Scalping Consolidation and Squeeze IndicatorThis custom indicator, called " Exhaustion & Improved Scalping Consolidation and Squeeze Indicator," is designed to help traders identify potential trading opportunities in the context of price consolidations, squeezes, and momentum exhaustion. It is an overlay indicator that combines several popular technical analysis tools, including the Relative Strength Index (RSI), Moving Average Convergence Divergence (MACD), Bollinger Bands, Keltner Channels, and Rate of Change (ROC). By analyzing these metrics, the indicator aims to provide visual cues on price charts to support better decision-making in the markets. Use Case for Trading: Consolidation Detection: The indicator identifies periods of price consolidation, which typically occur when a market is experiencing low volatility and trading in a narrow range. During these periods, the RSI value is between 45 and 55, the MACD histogram is close to zero, and the ROC value is low. The indicator highlights these consolidation periods by coloring the price bars yellow. Traders can use this information to anticipate potential breakouts and prepare for a possible trend initiation. Squeeze Detection: The indicator detects squeezes by comparing the Bollinger Bands and Keltner Channels. A squeeze occurs when the Bollinger Bands are within the Keltner Channels, indicating that price volatility is decreasing. The indicator colors the price bars orange during a squeeze, which can be a signal for traders to watch for an upcoming increase in volatility and potential trend expansion. Momentum Exhaustion Detection: The indicator identifies exhaustion in momentum by analyzing the RSI and MACD histogram. When the RSI is above 70, indicating overbought conditions, and the MACD histogram is decreasing, it may signal that the current upward momentum is losing strength. The indicator colors the price bars white in these situations. Traders can use this information to potentially exit long positions or prepare for a trend reversal.Penunjuk Pine Script®oleh brhodes8811131
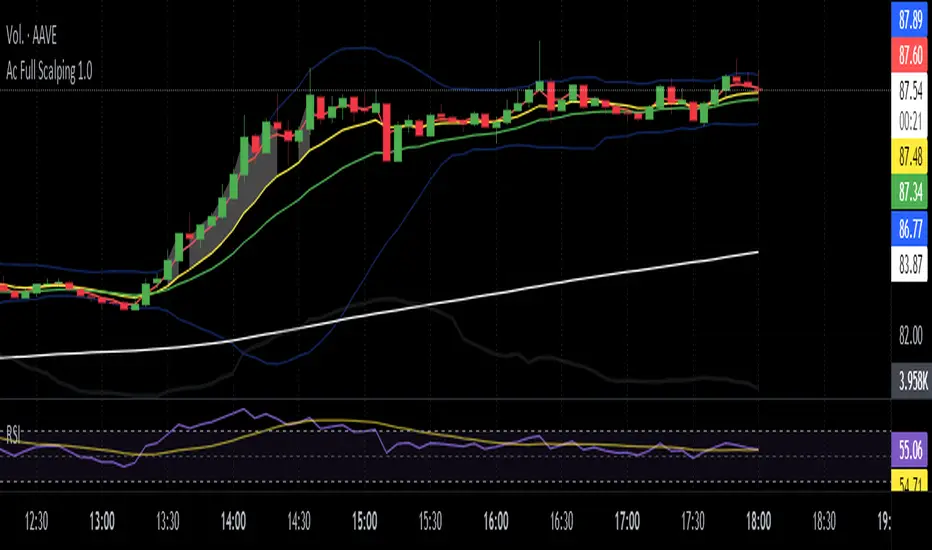
Ac Full Scalping 1.0These unified indicators are used for a 5-minute scalping strategy. We regularly look for the RSI to be overbought and the price to be outside the bollinger bands as the main analysis. This serves as a search protocol, to then analyze the price action by visually assisting us with 4 exponential moving averages to see wear or breakout of a move. It also adds the distance from the price close to the 10-period exponential moving average, developed in two modes where you can mark a background color where the event occurs, or you can choose a shadow that is drawn from the exponential moving average to the closing price. These two modes can be activated or deactivated so that each person can choose the most visually comfortable way to observe that distance, it is recommended to use one at a time and not both at the same time. The distance indicator can also be used to change the distance percentage. The percentage as a minimum value admits 0.50%, but it is recommended to use it above 0.80% to make the analysis more effective. People can also change colors of exponential moving averages, but it is not recommended, and the period cannot be changed to keep the analysis more specific. The RSI indicator should be added separately, as it is used to see overbought values and divergences. The other indicators are unified but can be turned on or off for better analysis. As a summary, what is sought with this type of unified indicators is the attrition, break or retracement in 5-minute time frame to open only short trades.Penunjuk Pine Script®oleh lideramotivaTelah dikemas kini 97
Dual Bollinger Band Mean ReversionSimple but solid mean reversion indicator with sl and tp levels. Most of the code is based on the built in bollinger bands script. Designed for scalping 1-5 minute timeframes. The indicator consists of two sets of bollinger bands. Price has to close below the lower (fast) bollinger band, above the moving average of the (slower) bollinger band. If price now closes above the lower (fast) bb, the indicator draws a label at the open of the next candle (which would be a potential entry point). Take profit becomes the upper bollinger band, stop loss the same distance below the open of the candle. I've built in a simple backtesting function that calculates the potential win/loss-ratio. Loss and profit levels are 1:1. Exit strategy could be improved on. Adjusting the lengths depending on the asset proves to be a good idea. The slower bollinger bands can help to identify ranging markets and/or trends following regular bollinger bands theory. Feel free to comment with any changes that you'd like to be made. Penunjuk Pine Script®oleh pb-algo236
Entry helperHello traders, This is a script I use daily as a scalper and it helps me a lot, maybe it can help you, this is why I am sharing it! PART 1 - DESCRIPTION This program is specifically designed to help scalpers but can be used for all types of trading but won't be as useful. This script is what I call an entry helper as it calculates dynamically the position size, stop loss and take profit levels and more. When scalping and placing market entry orders, the price can move significantely while you are calculating your position size according to your stop loss, capital, risk and especially close price that changes very quickly, this results in a risk that is not ideally controlled and personally was a source of frustration and stress. I wanted to enter my quantity and stop loss values as fast as possible and make the process easier. This script automates the calculation of the position size, stop loss and take profit levels according the the users input and prints the data visibly on the screen so it is easy to copy by the trader. It allows the trader to be confident that his risk is as controlled as possible. The script is easy to use and set up, this guide will help you if you have any difficulies or questions. PART 2 - HOW TO USE THE SCRIPT - SET THE CAPITAL SETTINGS 1 - Set your capital value in $ - SET THE TRADE SETTINGS 2 - Set your trade side (BUY or SELL) 3 - Set you desired risk in % of your capital - ENTRY SETTINGS 4 - Set your entry from 2 different options |MARKET| (default option) This option will place the entry level at the last available price |LIMIT| This option allows you to input a fixed price level for the entry - STOP LOSS SETTINGS 5 - Select your stop loss placement from 4 different options |EXTREMA STOP LOSS| (default option) This option will place the stop loss at the highest/lowest (extrema) price level within the last N candles |ATR EXTREMA| This option uses the same price level as the EXTREMA STOP LOSS but will add/soustract the last ATR value (calculated on the N last candles) multiplied by a coefficient that you input |TICKS EXTREMA| This option uses the same price level as the EXTREMA STOP LOSS but will add/soustract a number of ticks that you input |PRICE LEVEL| This option allows you to input a fixed price level for the stop loss - TAKE PROFIT SETTINGS 6 - Select your take profit from 3 different options |NONE| (default option) This option will not display any take profit level, I have added this option as I don't have take profit targets |RR| This option uses a risk to reward ratio (reward/risk) that you input, it will automatically calculate the take profit level that corresponds |PRICE LEVEL| This option allows you to input a fixed price level for the take profit - QUANTITY AND FEE SETTINGS 7 - Set the quantity settings, it represents the quantity in a lot (usually 100 000 in forex, 100 in stocks 1 for crypto currencies) 8 - Set the fee per quantity (turning lot) - VISUAL SETTINGS 9 - Show or remove the tab - TAB SETTINGS 10 - Select the data that you want to display in the tab (the tab will adapt automatically) NOTES: The vertical dashed line shows what candle has been used for the calculation of the stop loss, it allows you to visualize what candle the script has selected in case of an EXTREMA stop loss option. I hope this helps you out! Any suggestions are welcome and I hope that the guide is clear enough. Happy trading!Penunjuk Pine Script®oleh seangoy4588 1.6 K