RV-Scalping 34EAV ChannelWorks well with 1/3/5/15 min & above
//34 Exponential Moving Average of the Close
//34 Exponential Moving Average of the High
//34 Exponential Moving Average of the Low
//https://www.forexstrategiesresources.com/scalping-forex-strategies/106-1-min-scalping-with-34-exponential-moving-average-channel/
// When price is above the MAs (Moving Averages) we are only looking to buy as price comes back to the MAs.
// And when price is below the MAs, we are only looking to sell when price comes back to the MAs
// What we’re looking for when price pulls back to the MAs is for it to hold and then show that it is going to continue.
// We look for this continuation signal in terms of a strong, momentumdriven bar.
// 1) – Wait for pullback
// 2) – Enter when momentum comes into market
// 3) – Exit when momentum slows
// When the market has already moved a significant amount that day – Lets not enter in the same direct expecting a further move.
Cari dalam skrip untuk "scalping"

Urban TowersI translated a scalping system by Navin Prithyani into pine and want to share it with you.
Navin has a lot of resources for the system online including an extensive +60m video explaining the ins and outs.
Including links is against the house rules, so you'll have to DYOR.
Quick Criteria Overview:
---
- Can see through EMAs
- Entry above the signal candle
- Stop below the signal candle
- Targets include 1:1, trailing stop, and psychological levels
Why not give it a whirl? Back test it and share your results.
This is a fairly mechanical scalping system to be used on lower time frames.
I have programmed alerts into the system so you don't have to stare at your screen all day.
Happy profits y'all, enjoy the scalper.
Peace.

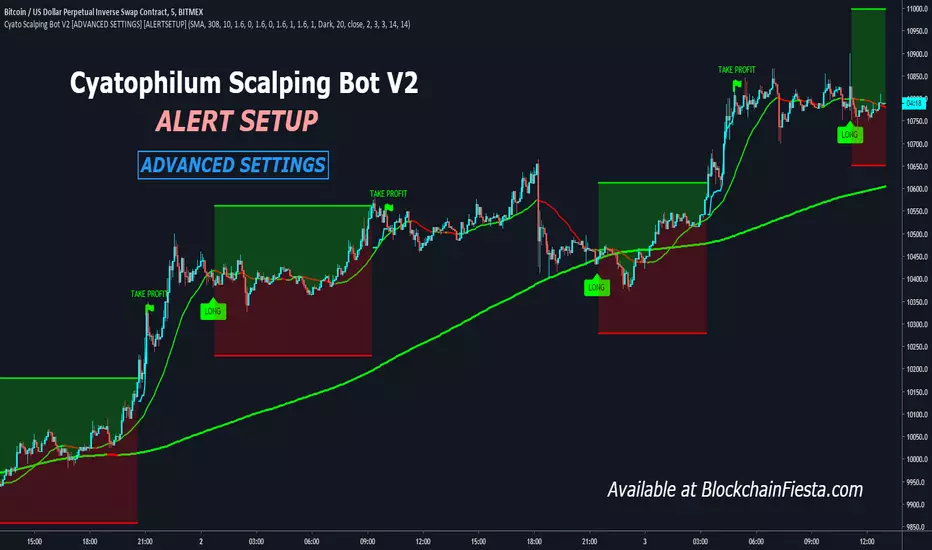
Cyatophilum Scalping Bot V2 [ADVANCED SETTINGS] [ALERTSETUP]Advanced Settings version of Cyatophilum Scalping Bot V2
For people who like tweaking settings =)
ADX and DI + CMF - Mutation [Redbeard]Hello,
this indicator was mainly made for my scalping indicator which you can find on my profile.
It displays:
- ADX and DI
- CMF
It has implemented additional functions and formulas which count the results of the lines different.
Best to use on lower Timeframe!!!!
Especially when you use it with my scalping indicator, then 1min timeframe is best!

Gold24fx IndicatorGold24fx
Class : hybrid – trend oscillator
Trading type : scalping
Time frame : 5 min
Purpose : detection of optimal buy entry points
Level of aggressiveness : high
Indicator « Gold24fx » was developed for scalping trading in Gold market. It can be used to define optimal buy entry points when the bullish sentiments prevail.
Indicator « Gold24fx » is based on unique author algorithm. It allows to provide quantitative assessments of current market sentiments as well as to visualize them. Also «Gold24fx» can detect divergences between current market price and fair value of the Gold for a specific moment of time. Local undervaluation of the Gold is a reason to generate a buy signal in situation when market is controlled by the bulls.
Thus Indicator «Gold24fx» provides sufficient data to the trader for the successful trading in the Gold market.
Structure of the indicator
Indicator consists of the following elements:
- Market sentiments curve – is presented with 3 color gammas: blue color (bullish sentiments are dominating), red color (bearish sentiments are dominating), green color (flat is present in the market),
- Red cross on the curve – a signal in favor of contraindications for buy trades. Can be related with bearish sentiments in the market or local overbought of the Gold;
- Green triangle on the curve – is a buy signal for short term Gold trades. It appears when the bullish market sentiments are prevail and asset is temporarily undervalued.
Rules of trading
Rules of trading are very simple. Blue color of the curve evidences in favor of bullish market sentiments. When the buy signal appears (green triangle on the curve) long position in Gold should be opened.

bitradercrossEl indicador bitradercross, es un indicador basado en el Índice Medio de Movimiento Direccional ( ADX ) es una herramienta de análisis técnico usada para medir la fuerza de la tendencia. El indicador direccional positivo ( DI ) y el indicador direccional negativo ( -DI ) acompañan a la línea ADX . realzando la dirección de la tendencia.
Usados en conjunto forman un sistema de trading que es capaz de determinar tanto la dirección como la fuerza de la tendencia. El indicador consiste en tres líneas: la propia ADX (línea azul), una línea DI (línea verde), y una línea -DI (línea roja). El DI mide la fuerza de la tendencia alcista, mientras que el -DI mide la intensidad del movimiento bajista. La línea ADX muestra la fuerza de la tendencia en general creciendo tanto en las tendencias alcistas como bajistas.
Cuando el DI está por encima del -DI , se dice que los alcistas tienen el dominio direccional. De forma alternativa, cuando el -DI es más alto que el DI , el dominio direccional pertenece a los bajistas.
Es importante entender que el ADX (línea azul) muestra solo la fuerza de la tendencia y no la dirección de la tendencia. La dirección de la tendencia puede en cambio determinarse mirando al DI y el -DI (líneas roja y verde).
¿Cómo usarlo en el trading?
Operar con la tendencia reduce los riesgos e incrementa los beneficios potenciales. Es por esto que muchos traders prefieren consultar la fuerza de la tendencia con ayuda del ADX antes de invertir su dinero. Hay dos formas principales de usar el indicador:
El Cruce de DI
Cuando las líneas direccionales del positivo y negativo se cruzan, normalmente significa que la tendencia está cambiando. Esta información puede usarse para determinar puntos de entrada óptimos. Para los inversores que utilicen este sistema de trading, las señales son las siguientes:
(Compra) cuando el DI cruce el -DI , es mas efectivo, mas fuerte cuando toca o cruza la linea amarilla solida en el nivel de 27 y la tendencia general sea alcista.
El disparo se da en la linea de 20 punteada.
(Venta) cuando el -DI cruce el DI , es mas efectivo, más fuerte cuando toca o cruza la linea amarilla solida en el nivel de 27 y la tendencia sea bajista general sea bajista.
Valor de Fuerza Tendencia ADX
0-20 Tendencia Ausente o Débil
21-26 Disparo
27-50 Tendencia Fuerte
50-75 Tendencia muy Fuerte
75-100 Tendencia Extremadamente Fuerte
El bitradercross es un indicador de análisis técnico verdaderamente único, que combinado con otros indicadores, puede convertirse en la estrategia de trading definitiva en manos de un trader.
Recomendado para scalping en temporalidad de 5 min
swing day 1hora. Esta configurado para una operacion optima.
Acompañelo con el indicador bitraderScalper.
Con mucho cariño Bitrader4.0
_________________________________
The bitradercross indicator, is an indicator based on the Mean Directional Movement Index ( ADX ) is a technical analysis tool used to measure the strength of the trend. The positive directional indicator ( DI ) and the negative directional indicator ( -DI ) accompany the ADX line. enhancing the direction of the trend.
Used together they form a trading system that is able to determine both the direction and strength of the trend. The indicator consists of three lines: the ADX itself (blue line), a DI line (green line), and a -DI line (red line). The DI measures the strength of the uptrend, while the -DI measures the intensity of the bearish movement. The ADX line shows the strength of the overall trend growing in both bullish and bearish trends.
When the DI is above the -DI , it is said that the bulls have the directional domain. Alternatively, when the -DI is higher than the DI , the directional domain belongs to the bears.
It is important to understand that the ADX (blue line) shows only the strength of the trend and not the direction of the trend. The direction of the trend can instead be determined by looking at the DI and the -DI (red and green lines).
How to use it in trading?
Operating with the trend reduces the risks and increases the potential benefits. This is why many traders prefer to consult the strength of the trend with the help of the ADX before investing their money. There are two main ways to use the indicator:
1) The Cross of DI
When the directional lines of the positive and negative intersect, it usually means that the trend is changing. This information can be used to determine optimal entry points. For investors who use this trading system, the signals are the following:
(Buy) when the DI crosses the -DI , it is more effective, stronger when it touches or crosses the solid yellow line at the level of 27 and the general trend is bullish .
The shot is given in the line of 20 dashed.
(Sale) when the -DI crosses the DI , it is more effective, stronger when it touches or crosses the solid yellow line at the level of 27 and the general bearish trend is bearish .
Strength Value ADX Trend
0-20 Absent or Weak Trend
21-26 Shot
27-50 Strong Trend
50-75 Very Strong Trend
75-100 Extremely Strong Trend
The bitradercross is a truly unique indicator of technical analysis , which combined with other indicators, can become the definitive trading strategy in the hands of a trader.
Recommended for scalping 5-minute and 1 hour.
It is configured for an optimal operation.
Accompany it with the bitraderScalper indicator.
With love Bitrader4.0

fiercebitraderEl indicador fiercebitrader, es un indicador basado en el Índice Medio de Movimiento Direccional (ADX) es una herramienta de análisis técnico usada para medir la fuerza de la tendencia. El indicador direccional positivo ( DI) y el indicador direccional negativo (-DI) acompañan a la línea ADX. realzando la dirección de la tendencia.
Usados en conjunto forman un sistema de trading que es capaz de determinar tanto la dirección como la fuerza de la tendencia. El indicador consiste en tres líneas: la propia ADX (línea azul), una línea DI (línea verde), y una línea -DI (línea roja). El DI mide la fuerza de la tendencia alcista, mientras que el -DI mide la intensidad del movimiento bajista. La línea ADX muestra la fuerza de la tendencia en general creciendo tanto en las tendencias alcistas como bajistas.
Cuando el DI está por encima del -DI, se dice que los alcistas tienen el dominio direccional. De forma alternativa, cuando el -DI es más alto que el DI, el dominio direccional pertenece a los bajistas.
Es importante entender que el ADX (línea azul) muestra solo la fuerza de la tendencia y no la dirección de la tendencia. La dirección de la tendencia puede en cambio determinarse mirando al DI y el -DI (líneas roja y verde).
¿Cómo usarlo en el trading?
Operar con la tendencia reduce los riesgos e incrementa los beneficios potenciales. Es por esto que muchos traders prefieren consultar la fuerza de la tendencia con ayuda del ADX antes de invertir su dinero. Hay dos formas principales de usar el indicador:
El Cruce de DI
Cuando las líneas direccionales del positivo y negativo se cruzan, normalmente significa que la tendencia está cambiando. Esta información puede usarse para determinar puntos de entrada óptimos. Para los inversores que utilicen este sistema de trading, las señales son las siguientes:
(Compra) cuando el DI cruce el -DI , es mas efectivo, mas fuerte cuando toca o cruza la linea amarilla solida en el nivel de 27 y la tendencia general sea alcista.
El disparo se da en la linea de 20 punteada.
(Venta) cuando el -DI cruce el DI , es mas efectivo, más fuerte cuando toca o cruza la linea amarilla solida en el nivel de 27 y la tendencia sea bajista general sea bajista.
Valor de Fuerza Tendencia ADX
0-20 Tendencia Ausente o Débil
21-26 Disparo
27-50 Tendencia Fuerte
50-75 Tendencia muy Fuerte
75-100 Tendencia Extremadamente Fuerte
El fiercebitrader es un indicador de análisis técnico verdaderamente único, que combinado con otros indicadores, puede convertirse en la estrategia de trading definitiva en manos de un trader.
Recomendado para scalping en temporalidad de 5 min
swing day 1hora. Esta configurado para una operacion optima.
Acompañelo con el indicador bitradertracker.
Con mucho cariño Bitrader4.0
_________________________________
The fiercebitrader indicator, is an indicator based on the Mean Directional Movement Index (ADX) is a technical analysis tool used to measure the strength of the trend. The positive directional indicator (DI) and the negative directional indicator (-DI) accompany the ADX line. enhancing the direction of the trend.
Used together they form a trading system that is able to determine both the direction and strength of the trend. The indicator consists of three lines: the ADX itself (blue line), a DI line (green line), and a -DI line (red line). The DI measures the strength of the uptrend, while the -DI measures the intensity of the bearish movement. The ADX line shows the strength of the overall trend growing in both bullish and bearish trends.
When the DI is above the -DI, it is said that the bulls have the directional domain. Alternatively, when the -DI is higher than the DI, the directional domain belongs to the bears.
It is important to understand that the ADX (blue line) shows only the strength of the trend and not the direction of the trend. The direction of the trend can instead be determined by looking at the DI and the -DI (red and green lines).
How to use it in trading?
Operating with the trend reduces the risks and increases the potential benefits. This is why many traders prefer to consult the strength of the trend with the help of the ADX before investing their money. There are two main ways to use the indicator:
1) The Cross of DI
When the directional lines of the positive and negative intersect, it usually means that the trend is changing. This information can be used to determine optimal entry points. For investors who use this trading system, the signals are the following:
(Buy) when the DI crosses the -DI, it is more effective, stronger when it touches or crosses the solid yellow line at the level of 27 and the general trend is bullish.
The shot is given in the line of 20 dashed.
(Sale) when the -DI crosses the DI, it is more effective, stronger when it touches or crosses the solid yellow line at the level of 27 and the general bearish trend is bearish.
Strength Value ADX Trend
0-20 Absent or Weak Trend
21-26 Shot
27-50 Strong Trend
50-75 Very Strong Trend
75-100 Extremely Strong Trend
The fiercebitrader is a truly unique indicator of technical analysis, which combined with other indicators, can become the definitive trading strategy in the hands of a trader.
Recommended for scalping 5-minute and 1 hour.
It is configured for an optimal operation.
Accompany it with the bitradertracker indicator.
With love Bitrader4.0

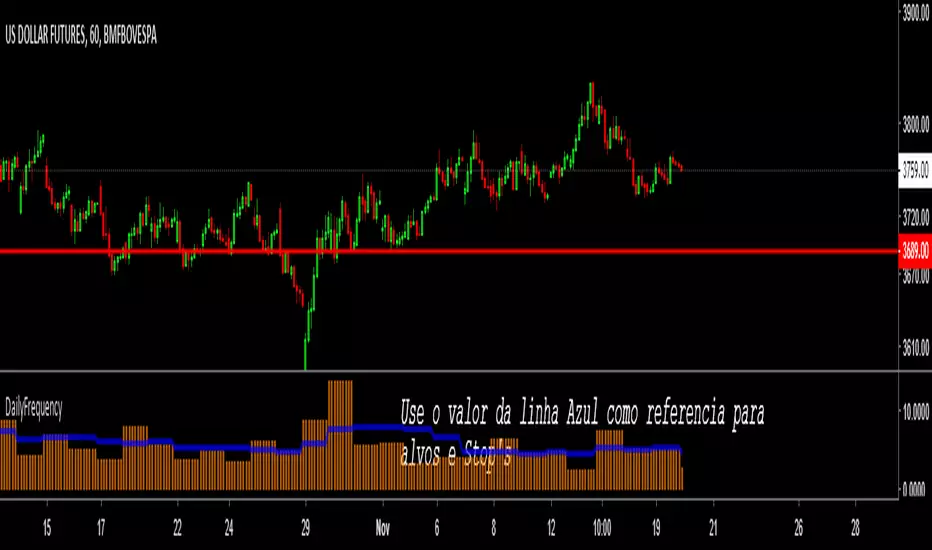
DailyFrequency - Oscilação Média de Movimentos (for Scalping) Um indicador que tira a media de oscilação dos ultimos dias e divide para projetar uma expectativa para as oscilaçoes do mercado no curtissimo prazo, muito util para planejar alvos e Stop's de scalping realistas e possiveis. Use o valor da linha Azul.
Aumente sua acertitividade no Scalping buscando objetivos realistas dentro do mercado com essa ferramenta !
BlockGain Ver 1.1Recommend for scalping in timeframe 15min and 1H
Recomendado para scalping en timeframe de 15 min y 1H .

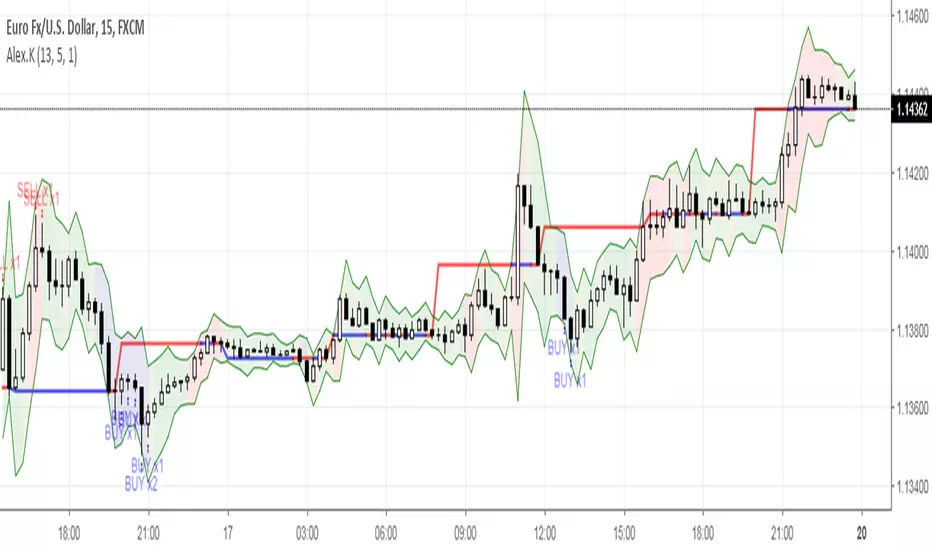
Alex.KAlex.K
Class : trend indicator
Trading type : scalping, intraday trading
Time frame : 5-15 min
Purpose : work in trend, search for reversal points
Level of aggressiveness : standard
Indicator «Alex.K» is developed for short-term intraday trading purposes. It is optimized for time frames from 5 to 15 minutes and can be a useful tool for scalping trading.
Specific feature of this indicator is ban for trades against basic trend. This significantly reduces the number of trades, but increases their quality. Still recommended time frames are rather short, so indicator «Alex.K» can generate up to 10 and more trades per day (it depends on time frame, for example 15 min frame generates nearly 10 trades per day, but 5 min frame increases this number to 15-20 trades per day). Also frequency of trades can be managed with indicator parameters. So it can easily be adopted for individual purposes and type of trading.
Indicator «Alex.K» is based on two blocks of technical analysis methods: trend and oscillatory. Trend block is used to detect prevailing tendency (only trades in direction of basic tendency are allowed). Oscillatory block is responsible for the entry points (buy trades are allowed only from oversold zones and sell trades – from overbought zones).
To increase the efficiency of the indicator it has elements of serial trading (used to increase of the overall position).
Structure of the indicator
Indicator consists of colored zones and level lines:
- level lines (red/blue lines) – show the most likely points of price reverse. The direction of reverse depends on color of the line. Red line indicates the resistance level. Blue line – the level of support;
- profit lines (green lines) – show the most favorable profit size for the current trade. For the buy trades the upper green line should be used. For the sell trades – the bottom green line;
- colored zones between profit lines – shows the degree of price deviation from the equilibrium price;
• green zone – deviations are insignificant or absent;
• blue zone – deviations are present. Price enters buy zone;
• red zone - deviations are present. Price enters sell zone.
Rules of trading
When price enters blue/red zone it is a signal about entering the overbought/oversold zone, but buy/sell signals appear only in the direction of prevailing tendency. To ease the trading process “buy”/”sell” signals appear on the chart.
Indicator «Alex.K» uses 3 levels of signals:
- х1 - signal for trade with basic volume. It is displayed on the chart with marker «х1»;
- х2 - signal for trade with double volume. It is displayed on the chart with marker «х2»;
- х3 – signal for trade with triple volume. It is displayed on the chart with marker «х3».
Signals for sell are marked with «sell», buy signals – with «buy».
Profits are set near the opposite green line (for buy trades – bottom line, for sell trades – upper line). Positions can be held till the price enters overbought zone (case of buy trades) or oversold zone (case of sell trades).
Tersus Bollinger Bands Scalping Indicator V1.1Tersus Scalping Indicator
Tersus Scalping Indicator places buy and sell signals for Bitcoin in key areas using Bollinger Bands, Moving Averages, and Trend Analysis.
This indicator is very easy to use and makes for a great second opinion when trading.
The buy and sell positions are marked with B for buy and S for sell, in addition adds to position are market with red and green triangles.
The Bollinger Bands show general constriction and turn from red to green depending on market conditions. Red meaning bearish market, and green meaning bullish.
There are a number of lines all over the place and at first glance they can seem daunting. This is what they mean. The green and yellow dotted lines mark sell target stages 1 and 2, and buy target stages 1 and 2. The red dotted line is your buy and sell stop. The light blue is your buy and sell entry.
The candles also change color depending on if things are over sold or over bought using the Stochastic RSI. Purple for overbought and yellow/orange for oversold. The bars will also change to light blue during entry.
This should be limited to the 15 minute time frame for now. I have noticed some very good signals on the daily and some other time frames but this was written for 15 so don't expect it to be as accurate.
For purchasing information please direct message me.

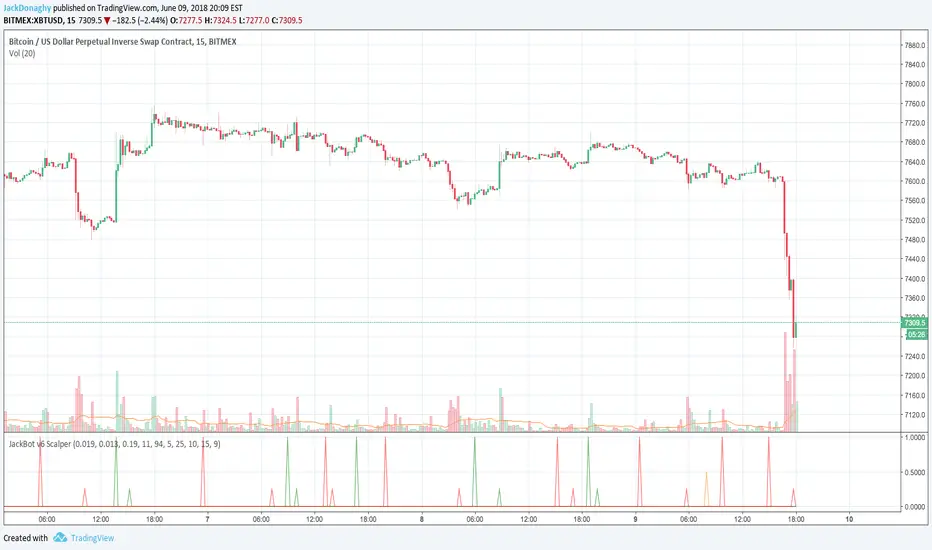
JackBot Scalper v6Jackbot Scalper v6 Update
In Version 6, Jackbot has improved performance on higher time frames with close to 85% success rate on 1-hour times frames and 70% success rate on 15-minute time frames.
Who
I am Jack Donaghy, a crypto trader and wealth strategist at an international asset management firm. I have traded billions in assets for clients and have grown a portfolio of personal assets by nearly 2200% within the last 1.5 years from trading. I originally invested in cryptocurrencies in November of 2016 and have been catching waves ever since. This bot is for those interested in scalping methods.
What
Jackbot Pro Scalper is a scalping study for Bitcoin that operates on small timeframes. It has a 60-70% success rate and operates with the goal of maximizing gains while minimizing losses. This bot works well with leveraged strategies as it pursues both long and short positions. While I primarily use the bot on BitMex, I have seen good success on Bitfinex with various USDT pairs including VEN and ETH.
When
With v6, the best results have come from 13, 15, and 17-minute charts with incredible success found on the 1-hour charts.
How
The bot works by 1. Defining its entry point. 2. Defining a take profit 3. Defining a stop loss. The magic of the bot is that it will not close a trade at the take profit, if volume and price are increasing, it will hold the exit until another indicator determines a reversal of the trend. More than that would ruin the logic so you will just have to see for yourself.
To Trade
Large Spikes = Entries (Green = Long, Red = Short)
Small Spikes = Take Profit (Green = Long Exit, Red = Short Exit)
Medium Spikes = Stop Loss (Purple = Long SL, Yellow = Short SL)
Previous Results
Backtested, Jackbot v6 shows that with 1 Bitcoin (unleveraged) you can make about 12K in a 1.5 month period. My personal experience was trading a test amount of Bitcoin on a particularly good run at 25x leverage using 25% of a test portfolio It went from 0.015 Bitcoin to 0.091 within 10 days. See ibb.co (This test was from V5.4 which V6 has improved upon.)
Disclaimer: This strategy is by no means perfect and not every trade will be a winner. It is a tool in your belt, not a perfect 100% trader. Previously, results show with a 25x leveraged position, the losses are ~20% before it will cut off the trade, however, the gains can be 40%+ (As the bot continues to run in certain conditions, it will often pick up major moves and hold them for longer.) It can have bad runs and a slew of poor entries, especially in tight volatile ranges.
PLEASE NOTE: This strategy can struggle with chop following major moves, if you are manually entering, consider other market conditions before entry if the price is in a tight range.
Cost
Jackbot will be offered for 0.1 Bitcoin and will be limited to the first 100 people who apply.
TPAmacd — Free by TPA OG💎 TPAmacd — Free by TPA OG
Professional Divergence Detection for Confident Technical Analysis
🧭 Overview
TPAmacd is an advanced divergence-analysis tool built for traders who value precision, adaptability, and clarity.
It automatically identifies bullish and bearish divergences on the MACD histogram, confirms momentum shifts, and provides a clean, customizable visual framework — helping you interpret market transitions with greater confidence.
⚙️ Key Features
- Auto-detected Bullish / Bearish Divergences — instantly highlights potential momentum shifts.
- Multi-Timeframe Compatibility — analyze divergences seamlessly across any chart period.
- Histogram Reversal Alerts — get notified as momentum changes direction.
- Customizable Settings — choose between EMA / SMA, set color themes, and adjust visual precision.
- Efficient, Lightweight Design — optimized for clarity and performance on all devices.
📈 Why Traders Choose TPAmacd
- Professional-grade divergence mapping
- Intuitive design — minimal clutter, maximum context
- Adaptable for scalping, swing, or long-term analysis
- Clear alerts and smooth integration with your workflow
⚠️ Important Disclaimer
This script is provided for educational and informational purposes only.
It does not constitute financial, investment, or trading advice.
No indicator, including TPAmacd or any related tools by TPA OG, can guarantee accuracy or profitability.
All trading involves risk, and past performance is not indicative of future results.
Always perform independent analysis and use appropriate risk-management practices before placing any trade.

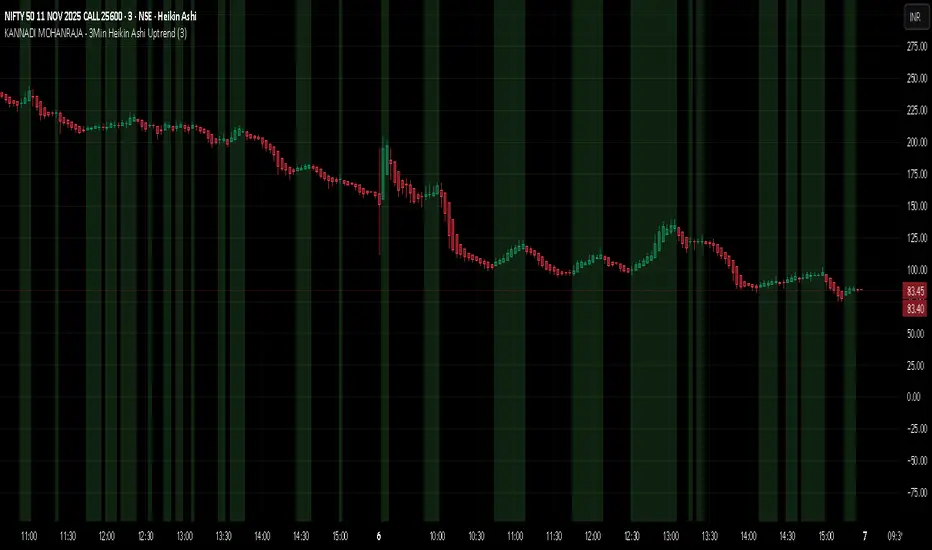
KANNADI MOHANRAJA SCALPING INDICATORThis indicator is designed by Kannadi Mohanraja to help traders visually identify uptrend conditions using 3-minute Heikin Ashi candles only.
🔍 Concept:
Heikin Ashi candles smooth price movements and help traders identify the market direction clearly.
When a Heikin Ashi candle closes above its open (green candle), it indicates potential bullish momentum.
⚙️ How it Works:
The script requests Heikin Ashi data from the 3-minute timeframe.
When the Heikin Ashi close price is greater than the open, it highlights the background in green to signal a potential uptrend.
A small “BUY” triangle appears below bars during these uptrend phases.
🧠 Purpose:
This script helps traders quickly recognize uptrend phases visually without using multiple indicators.
It’s ideal for scalpers and short-term traders who use Heikin Ashi charts for smooth price action confirmation.
⚠️ Note:
This indicator uses only Heikin Ashi candles — no other indicators are included.
Works best on charts set to 3-minute timeframe.
Use this as a visual guide, not as standalone trading advice.
#HeikinAshi #Uptrend #KannadiMohanraja #PineScriptV6 #Scalping
//@version=6
// © Kannadi Mohanraja
// This script is open-source and free to use for educational and analytical purposes.
// You may copy, modify, or share it with proper credit to the original author.
// Not intended as financial advice. Use at your own risk.
3 Min Scalping MSE (No Repeat Signals) Aazam JaniThis indicator is designed for 3-minute scalping setups that combine EMA alignment to generate high-probability Buy and Sell signals — while preventing duplicate entries until the opposite signal appears.

Binary Options Gold Scalping [TradingFinder] 1 & 5 Min Strategy🔵 Introduction
In binary options trading, price movements are often driven by the market’s tendency to reach key liquidity zones. These areas include Liquidity, Fair Value Gaps (FVGs), and Order Blocks (OBs), zones where a large number of pending orders are concentrated.
When price reaches one of these zones, it typically enters a Liquidity Sweep phase to collect available liquidity. After this process, the market often reacts sharply, either reversing direction or continuing its move with renewed momentum. Understanding this cycle forms the foundation of most smart money-based binary options strategies.
In this analytical approach, a Liquidity Sweep is usually seen as a False Breakout, often recognized through a distinctive candle confirmation pattern. The pattern appears when price briefly breaks a level to trigger stops, then quickly returns within range. This formation is one of the most reliable reversal signals for short-term trades and plays a central role in many binary options strategies.
After a liquidity sweep, price often returns to Fair Value Gap (FVG) or Order Block (OB) areas to restore balance in the market. These are zones where institutional orders are typically placed, and reactions around them can create high-probability trade setups. In binary options trading, this quick reaction following a sweep and retrace into an FVG or OB provides one of the best entry opportunities for short-term trades.
By combining the concepts of Liquidity Sweep, Fair Value Gap, and Order Block, traders can build a precise binary options strategy based on smart money behavior, allowing them to identify market reversals with greater confidence and enter at the optimal moment.
Bullish Setup :
Bearish Setup :
🔵 How to Use
This indicator is built on the Smart Money Concept (SMC) framework and serves as a core tool for accurately detecting Liquidity Sweeps, Order Blocks, and Fair Value Gaps in binary options trading.
Its logic is simple yet powerful : when price reaches high-interest liquidity zones and shows reversal signs, the indicator issues an entry signal immediately after a Candle Confirmation is complete.
Signals only activate when both the market structure and the candle confirmation pattern align, ensuring high accuracy in spotting genuine reversals.
🟣 Long Position
A bullish signal appears when the market, after a downward move, reaches sell-side liquidity zones where liquidity has built up below previous lows. In such conditions, a bullish Order Block or Fair Value Gap often exists in the same region, acting as a potential reversal point.
When the indicator detects the presence of liquidity, an imbalance zone (FVG), and a valid candle confirmation simultaneously, it triggers a green Call signal.
In a binary options strategy, the best entry moment is immediately after the candle confirmation closes, as this is when the probability of reversal is highest and the market tends to react strongly within the next few candles.
In the example below, after the liquidity sweep and candle confirmation, price quickly rallied, resulting in a Binary Win setup.
🟣 Short Position
A bearish signal occurs when price, after an upward move, reaches an area of buy-side liquidity and collects liquidity above recent highs. At this stage, the market is typically overbought and ready to reverse. If a bearish Order Block or Fair Value Gap exists in the same area and a candle confirmation pattern forms, the indicator displays a red Put signal.
This setup is highly accurate because multiple structural confirmations occur simultaneously : liquidity has been absorbed, price is rebalancing, and the confirmation candle has closed.
In binary options trading, this is the ideal moment to enter a Put (Sell) position, as the price reaction to the downside is usually quick and decisive.
In the example chart, the indicator generated a bearish signal right after the candle confirmation and completion of the liquidity sweep, price then dropped within minutes, resulting in another Binary Win.
🔵 Settings
Time Frame : Select the desired timeframe for analysis. If left blank, the indicator uses the chart’s current timeframe.
Swing Period : Defines how many candles are used to detect structural pivots (swing highs and lows). A higher value increases accuracy but reduces the number of signals.
Candle Pattern : Enables candle-based confirmation logic. When turned on, the indicator issues signals only if a valid reversal pattern is detected. You can also choose the confirmation filter strength, tighter filters show fewer but more precise signals.
🔵 Conclusion
A deep understanding of Liquidity Sweeps, Order Blocks, and Fair Value Gaps can make a decisive difference between ordinary and professional traders in the binary options market.
This indicator, combining smart money logic with candle confirmation, is one of the most precise tools for detecting true market reversals. When liquidity is collected and structural reversal signs emerge, the indicator automatically recognizes the price reaction and generates a reliable Call or Put signal.
Using this tool alongside market structure analysis and FVG detection allows traders to enter high-probability setups while filtering out false breakouts. For that reason, this binary options strategy is not only suitable for short-term trading but also valuable for understanding deeper smart-money behavior across timeframes.
Ultimately, success with this system comes down to two key principles: understanding the logic of the liquidity sweep and waiting for the candle confirmation to close. When these two conditions align, the indicator can pinpoint the best entry points with remarkable precision, helping you build a structured, intelligent, and profitable binary options strategy.

Grizzly Brahman · PRO SCALPERGrizzly Brahman TMAX 4 is a fourth-generation Trend-Momentum-Adaptive Crossover system built to identify true intraday direction and volatility alignment before price acceleration begins.
It combines adaptive moving-average bands, momentum filtration, and trend-fill logic to produce crystal-clear long/short zones directly on the chart.
Preset Modes
“Aggressive / Balanced / Disciplined” presets optimize responsiveness for scalping, intra-day, or swing conditions.
Session Shading & ORB Levels
Optional overlays for Opening Range Breakout, Pre-Market High/Low, and Previous Day High/Low to frame liquidity targets.
Heikin Ashi Compatibility
Optimized to read momentum flow cleanly on Heikin Ashi charts for false-breakout filtering.
Momentum Bands
Adaptive outer bands act as over-extension or “take-profit” zones — similar to ATR channels but smoothed for consistency.
How to Use
Identify Trend Zone — watch for color fill change and TMA alignment.
Enter on Marker Confirmation — green triangle = long momentum confirm, red triangle = short.
Manage Risk around outer TMA/ATR band touches or when color intensity fades.
Combine with GB Set-Up & Confirmation (lower pane) for dual-signal entry validation.
Luxy BIG beautiful Dynamic ORBThis is an advanced Opening Range Breakout (ORB) indicator that tracks price breakouts from the first 5, 15, 30, and 60 minutes of the trading session. It provides complete trade management including entry signals, stop-loss placement, take-profit targets, and position sizing calculations.
The ORB strategy is based on the concept that the opening range of a trading session often acts as support/resistance, and breakouts from this range tend to lead to significant moves.
What Makes This Different?
Most ORB indicators simply draw horizontal lines and leave you to figure out the rest. This indicator goes several steps further:
Multi-Stage Tracking
Instead of just one ORB timeframe, this tracks FOUR simultaneously (5min, 15min, 30min, 60min). Each stage builds on the previous one, giving you multiple trading opportunities throughout the session.
Active Trade Management
When a breakout occurs, the indicator automatically calculates and displays entry price, stop-loss, and multiple take-profit targets. These lines extend forward and update in real-time until the trade completes.
Cycle Detection
Unlike indicators that only show the first breakout, this tracks the complete cycle: Breakout → Retest → Re-breakout. You can see when price returns to test the ORB level after breaking out (potential re-entry).
Failed Breakout Warning
If price breaks out but quickly returns inside the range (within a few bars), the label changes to "FAILED BREAK" - warning you to exit or avoid the trade.
Position Sizing Calculator
Built-in risk management that tells you exactly how many shares to buy based on your account size and risk tolerance. No more guessing or manual calculations.
Advanced Filtering
Optional filters for volume confirmation, trend alignment, and Fair Value Gaps (FVG) to reduce false signals and improve win rate.
Core Features Explained
### 1. Multi-Stage ORB Levels
The indicator builds four separate Opening Range levels:
ORB 5 - First 5 minutes (fastest signals, most volatile)
ORB 15 - First 15 minutes (balanced, most popular)
ORB 30 - First 30 minutes (slower, more reliable)
ORB 60 - First 60 minutes (slowest, most confirmed)
Each level is drawn as a horizontal range on your chart. As time progresses, the ranges expand to include more price action. You can enable or disable any stage and assign custom colors to each.
How it works: During the opening minutes, the indicator tracks the highest high and lowest low. Once the time period completes, those levels become your ORB high and low for that stage.
### 2. Breakout Detection
When price closes outside the ORB range, a label appears:
BREAK UP (green label above price) - Price closed above ORB High
BREAK DOWN (red label below price) - Price closed below ORB Low
The label shows which ORB stage triggered (ORB5, ORB15, etc.) and the cycle number if tracking multiple breakouts.
Important: Signals appear on bar close only - no repainting. What you see is what you get.
### 3. Retest Detection
After price breaks out and moves away, if it returns to test the ORB level, a "RETEST" label appears (orange). This indicates:
The original breakout level is now acting as support/resistance
Potential re-entry opportunity if you missed the first breakout
Confirmation that the level is significant
The indicator requires price to move a minimum distance away before considering it a valid retest (configurable in settings).
### 4. Failed Breakout Detection
If price breaks out but returns inside the ORB range within a few bars (before the breakout is "committed"), the original label changes to "FAILED BREAK" in orange.
This warns you:
The breakout lacked conviction
Consider exiting if already in the trade
Wait for better setup
Committed Breakout: The indicator tracks how many bars price stays outside the range. Only after staying outside for the minimum number of bars does it become a committed breakout that can be retested.
### 5. TP/SL Lines (Trade Management)
When a breakout occurs, colored horizontal lines appear showing:
Entry Line (cyan for long, orange for short) - Your entry price (the ORB level)
Stop Loss Line (red) - Where to exit if trade goes against you
TP1, TP2, TP3 Lines (same color as entry) - Profit targets at 1R, 2R, 3R
These lines extend forward as new bars form, making it easy to track your trade. When a target is hit, the line turns green and the label shows a checkmark.
Lines freeze (stop updating) when:
Stop loss is hit
The final enabled take-profit is hit
End of trading session (optional setting)
### 6. Position Sizing Dashboard
The dashboard (bottom-left corner by default) shows real-time information:
Current ORB stage and range size
Breakout status (Inside Range / Break Up / Break Down)
Volume confirmation (if filter enabled)
Trend alignment (if filter enabled)
Entry and Stop Loss prices
All enabled Take Profit levels with percentages
Risk/Reward ratio
Position sizing: Max shares to buy and total risk amount
Position Sizing Example:
If your account is $25,000 and you risk 1% per trade ($250), and the distance from entry to stop loss is $0.50, the calculator shows you can buy 500 shares (250 / 0.50 = 500).
### 7. FVG Filter (Fair Value Gap)
Fair Value Gaps are price inefficiencies - gaps left by strong momentum where one candle's high doesn't overlap with a previous candle's low (or vice versa).
When enabled, this filter:
Detects bullish and bearish FVGs
Draws semi-transparent boxes around these gaps
Only allows breakout signals if there's an FVG near the breakout level
Why this helps: FVGs indicate institutional activity. Breakouts through FVGs tend to be stronger and more reliable.
Proximity setting: Controls how close the FVG must be to the ORB level. 2.0x means the breakout can be within 2 times the FVG size - a reasonable default.
### 8. Volume & Trend Filters
Volume Filter:
Requires current volume to be above average (customizable multiplier). High volume breakouts are more likely to sustain.
Set minimum multiplier (e.g., 1.5x = 50% above average)
Set "strong volume" multiplier (e.g., 2.5x) that bypasses other filters
Dashboard shows current volume ratio
Trend Filter:
Only shows breakouts aligned with a higher timeframe trend. Choose from:
VWAP - Price above/below volume-weighted average
EMA - Price above/below exponential moving average
SuperTrend - ATR-based trend indicator
Combined modes (VWAP+EMA, VWAP+SuperTrend) for stricter filtering
### 9. Pullback Filter (Advanced)
Purpose:
Waits for price to pull back slightly after initial breakout before confirming the signal.
This reduces false breakouts from immediate reversals.
How it works:
- After breakout is detected, indicator waits for a small pullback (default 2%)
- Once pullback occurs AND price breaks out again, signal is confirmed
- If no pullback within timeout period (5 bars), signal is issued anyway
Settings:
Enable Pullback Filter: Turn this filter on/off
Pullback %: How much price must pull back (2% is balanced)
Timeout (bars): Max bars to wait for pullback (5 is standard)
When to use:
- Choppy markets with many fake breakouts
- When you want higher quality signals
- Combine with Volume filter for maximum confirmation
Trade-off:
- Better signal quality
- May miss some valid fast moves
- Slight entry delay
How to Use This Indicator
### For Beginners - Simple Setup
Add the indicator to your chart (5-minute or 15-minute timeframe recommended)
Leave all default settings - they work well for most stocks
Watch for BREAK UP or BREAK DOWN labels to appear
Check the dashboard for entry, stop loss, and targets
Use the position sizing to determine how many shares to buy
Basic Trading Plan:
Wait for a clear breakout label
Enter at the ORB level (or next candle open if you're late)
Place stop loss where the red line indicates
Take profit at TP1 (50% of position) and TP2 (remaining 50%)
### For Advanced Traders - Customized Setup
Choose which ORB stages to track (you might only want ORB15 and ORB30)
Enable filters: Volume (stocks) or Trend (trending markets)
Enable FVG filter for institutional confirmation
Set "Track Cycles" mode to catch retests and re-breakouts
Customize stop loss method (ATR for volatile stocks, ORB% for stable ones)
Adjust risk per trade and account size for accurate position sizing
Advanced Strategy Example:
Enable ORB15 only (disable others for cleaner chart)
Turn on Volume filter at 1.5x with Strong at 2.5x
Enable Trend filter using VWAP
Set Signal Mode to "Track Cycles" with Max 3 cycles
Wait for aligned breakouts (Volume + Trend + Direction)
Enter on retest if you missed the initial break
### Timeframe Recommendations
5-minute chart: Scalping, very active trading, crypto
15-minute chart: Day trading, balanced approach (most popular)
30-minute chart: Swing entries, less screen time
60-minute chart: Position trading, longer holds
The indicator works on any intraday timeframe, but ORB is fundamentally a day trading strategy. Daily charts don't make sense for ORB.
DEFAULT CONFIGURATION
ON by Default:
• All 4 ORB stages (5/15/30/60)
• Breakout Detection
• Retest Labels
• All TP levels (1/1.5/2/3)
• TP/SL Lines (Detailed mode)
• Dashboard (Bottom Left, Dark theme)
• Position Size Calculator
OFF by Default (Optional Filters):
• FVG Filter
• Pullback Filter
• Volume Filter
• Trend Filter
• HTF Bias Check
• Alerts
Recommended for Beginners:
• Leave all defaults
• Session Mode: Auto-Detect
• Signal Mode: Track Cycles
• Stop Method: ATR
• Add Volume Filter if trading stocks
Recommended for Advanced:
• Enable ORB15 + ORB30 only (disable 5 & 60)
• Enable: Volume + Trend + FVG
• Signal Mode: Track Cycles, Max 3
• Stop Method: ATR or Safer
• Enable HTF Daily bias check
## Settings Guide
The settings are organized into logical groups. Here's what each section controls:
### ORB COLORS Section
Show Edge Labels: Display "ORB 5", "ORB 15" labels at the right edge of the levels
Background: Fill the area between ORB high/low with color
Transparency: How see-through the background is (95% is nearly invisible)
Enable ORB 5/15/30/60: Turn each stage on or off individually
Colors: Assign colors to each ORB stage for easy identification
### SESSION SETTINGS Section
Session Mode: Choose trading session (Auto-Detect works for most instruments)
Custom Session Hours: Define your own hours if needed (format: HHMM-HHMM)
Auto-Detect uses the instrument's natural hours (stocks use exchange hours, crypto uses 24/7).
### BREAKOUT DETECTION Section
Enable Breakout Detection: Master switch for signals
Show Retest Labels: Display retest signals
Label Size: Visual size for all labels (Small recommended)
Enable FVG Filter: Require Fair Value Gap confirmation
Show FVG Boxes: Display the gap boxes on chart
Signal Mode: "First Only" = one signal per direction per day, "Track Cycles" = multiple signals
Max Cycles: How many breakout-retest cycles to track (6 is balanced)
Breakout Buffer: Extra distance required beyond ORB level (0.1-0.2% recommended)
Min Distance for Retest: How far price must move away before retest is valid (2% recommended)
Min Bars Outside ORB: Bars price must stay outside for committed breakout (2 is balanced)
### TARGETS & RISK Section
Enable Targets & Stop-Loss: Calculate and show trade management
TP1/TP2/TP3 checkboxes: Select which profit targets to display
Stop Method: How to calculate stop loss placement
- ATR: Based on volatility (best for most cases)
- ORB %: Fixed % of ORB range
- Swing: Recent swing high/low
- Safer: Widest of all methods
ATR Length & Multiplier: Controls ATR stop distance (14 period, 1.5x is standard)
ORB Stop %: Percentage beyond ORB for stop (20% is balanced)
Swing Bars: Lookback period for swing high/low (3 is recent)
### TP/SL LINES Section
Show TP/SL Lines: Display horizontal lines on chart
Label Format: "Short" = minimal text, "Detailed" = shows prices
Freeze Lines at EOD: Stop extending lines at session close
### DASHBOARD Section
Show Info Panel: Display the metrics dashboard
Theme: Dark or Light colors
Position: Where to place dashboard on chart
Toggle rows: Show/hide specific information rows
Calculate Position Size: Enable the position sizing calculator
Risk Mode: Risk fixed $ amount or % of account
Account Size: Your total trading capital
Risk %: Percentage to risk per trade (0.5-1% recommended)
### VOLUME FILTER Section
Enable Volume Filter: Require volume confirmation
MA Length: Average period (20 is standard)
Min Volume: Required multiplier (1.5x = 50% above average)
Strong Volume: Multiplier that bypasses other filters (2.5x)
### TREND FILTER Section
Enable Trend Filter: Require trend alignment
Trend Mode: Method to determine trend (VWAP is simple and effective)
Custom EMA Length: If using EMA mode (50 for swing, 20 for day trading)
SuperTrend settings: Period and Multiplier if using SuperTrend mode
### HIGHER TIMEFRAME Section
Check Daily Trend: Display higher timeframe bias in dashboard
Timeframe: What TF to check (D = daily, recommended)
Method: Price vs MA (stable) or Candle Direction (reactive)
MA Period: EMA length for Price vs MA method (20 is balanced)
Min Strength %: Minimum strength threshold for HTF bias to be considered
- For "Price vs MA": Minimum distance (%) from moving average
- For "Candle Direction": Minimum candle body size (%)
- 0.5% is balanced - increase for stricter filtering
- Lower values = more signals, higher values = only strong trends
### ALERTS Section
Enable Alerts: Master switch (must be ON to use any alerts)
Breakout Alerts: Notify on ORB breakouts
Retest Alerts: Notify when price retests after breakout
Failed Break Alerts: Notify on failed breakouts
Stage Complete Alerts: Notify when each ORB stage finishes forming
After enabling desired alert types, click "Create Alert" button, select this indicator, choose "Any alert() function call".
## Tips & Best Practices
### General Trading Tips
ORB works best on liquid instruments (stocks with good volume, major crypto pairs)
First hour of the session is most important - that's when ORB is forming
Breakouts WITH the trend have higher success rates - use the trend filter
Failed breakouts are common - use the "Min Bars Outside" setting to filter weak moves
Not every day produces good ORB setups - be patient and selective
### Position Sizing Best Practices
Never risk more than 1-2% of your account on a single trade
Use the built-in calculator - don't guess your position size
Update your account size monthly as it grows
Smaller accounts: use $ Amount mode for simplicity
Larger accounts: use % of Account mode for scaling
### Take Profit Strategy
Most traders use: 50% at TP1, 50% at TP2
Aggressive: Hold through TP1 for TP2 or TP3
Conservative: Full exit at TP1 (1:1 risk/reward)
After TP1 hits, consider moving stop to breakeven
TP3 rarely hits - only on strong trending days
### Filter Combinations
Maximum Quality: Volume + Trend + FVG (fewest signals, highest quality)
Balanced: Volume + Trend (good quality, reasonable frequency)
Active Trading: No filters or Volume only (many signals, lower quality)
Trending Markets: Trend filter essential (indices, crypto)
Range-Bound: Volume + FVG (avoid trend filter)
### Common Mistakes to Avoid
Chasing breakouts - wait for the bar to close, don't FOMO into wicks
Ignoring the stop loss - always use it, move it manually if needed
Over-leveraging - the calculator shows MAX shares, you can buy less
Trading every signal - quality > quantity, use filters
Not tracking results - keep a journal to see what works for YOU
## Pros and Cons
### Advantages
Complete all-in-one solution - from signal to position sizing
Multiple timeframes tracked simultaneously
Visual clarity - easy to see what's happening
Cycle tracking catches opportunities others miss
Built-in risk management eliminates guesswork
Customizable filters for different trading styles
No repainting - what you see is locked in
Works across multiple markets (stocks, forex, crypto)
### Limitations
Intraday strategy only - doesn't work on daily charts
Requires active monitoring during first 1-2 hours of session
Not suitable for after-hours or extended sessions by default
Can produce many signals in choppy markets (use filters)
Dashboard can be overwhelming for complete beginners
Performance depends on market conditions (trends vs ranges)
Requires understanding of risk management concepts
### Best For
Day traders who can watch the first 1-2 hours of market open
Traders who want systematic entry/exit rules
Those learning proper position sizing and risk management
Active traders comfortable with multiple signals per day
Anyone trading liquid instruments with clear sessions
### Not Ideal For
Swing traders holding multi-day positions
Set-and-forget / passive investors
Traders who can't watch market open
Complete beginners unfamiliar with trading concepts
Low volume / illiquid instruments
## Frequently Asked Questions
Q: Why are no signals appearing?
A: Check that you're on an intraday timeframe (5min, 15min, etc.) and that the current time is within your session hours. Also verify that "Enable Breakout Detection" is ON and at least one ORB stage is enabled. If using filters, they might be blocking signals - try disabling them temporarily.
Q: What's the best ORB stage to use?
A: ORB15 (15 minutes) is most popular and balanced. ORB5 gives faster signals but more noise. ORB30 and ORB60 are slower but more reliable. Many traders use ORB15 + ORB30 together.
Q: Should I enable all the filters?
A: Start with no filters to see all signals. If too many false signals, add Volume filter first (stocks) or Trend filter (trending markets). FVG filter is most restrictive - use for maximum quality but fewer signals.
Q: How do I know which stop loss method to use?
A: ATR works for most cases - it adapts to volatility. Use ORB% if you want predictable stop placement. Swing is for respecting chart structure. Safer gives you the most room but largest risk.
Q: Can I use this for swing trading?
A: Not really - ORB is fundamentally an intraday strategy. The ranges reset each day. For swing trading, look at weekly support/resistance or moving averages instead.
Q: Why do TP/SL lines disappear sometimes?
A: Lines freeze (stop extending) when: stop loss is hit, the last enabled take-profit is hit, or end of session arrives (if "Freeze at EOD" is enabled). This is intentional - the trade is complete.
Q: What's the difference between "First Only" and "Track Cycles"?
A: "First Only" shows one breakout UP and one DOWN per day maximum - clean but might miss opportunities. "Track Cycles" shows breakout-retest-rebreak sequences - more signals but busier chart.
Q: Is position sizing accurate for options/forex?
A: The calculator is designed for shares (stocks). For options, ignore the share count and use the risk amount. For forex, you'll need to adapt the lot size calculation manually.
Q: How much capital do I need to use this?
A: The indicator works for any account size, but practical day trading typically requires $25,000 in the US due to Pattern Day Trader rules. Adjust the "Account Size" setting to match your capital.
Q: Can I backtest this strategy?
A: This is an indicator, not a strategy script, so it doesn't have built-in backtesting. You can visually review historical signals or code a strategy script using similar logic.
Q: Why does the dashboard show different entry price than the breakout label?
A: If you're looking at an old breakout, the ORB levels may have changed when the next stage completed. The dashboard always shows the CURRENT active range and trade setup.
Q: What's a good win rate to expect?
A: ORB strategies typically see 40-60% win rate depending on market conditions and filters used. The strategy relies on positive risk/reward ratios (2:1 or better) to be profitable even with moderate win rates.
Q: Does this work on crypto?
A: Yes, but crypto trades 24/7 so you need to define what "session start" means. Use Session Mode = Custom and set your preferred daily reset time (e.g., 0000-2359 UTC).
## Credits & Transparency
### Development
This indicator was developed with the assistance of AI technology to implement complex ORB trading logic.
The strategy concept, feature specifications, and trading logic were designed by the publisher. The implementation leverages modern development tools to ensure:
Clean, efficient, and maintainable code
Comprehensive error handling and input validation
Detailed documentation and user guidance
Performance optimization
### Trading Concepts
This indicator implements several public domain trading concepts:
Opening Range Breakout (ORB): Trading strategy popularized by Toby Crabel, Mark Fisher and many more talanted traders.
Fair Value Gap (FVG): Price imbalance concept from ICT methodology
SuperTrend: ATR-based trend indicator using public formula
Risk/Reward Ratio: Standard risk management principle
All mathematical formulas and technical concepts used are in the public domain.
### Pine Script
Uses standard TradingView built-in functions:
ta.ema(), ta.atr(), ta.vwap(), ta.highest(), ta.lowest(), request.security()
No external libraries or proprietary code from other authors.
## Disclaimer
This indicator is provided for educational and informational purposes only. It is not financial advice.
Trading involves substantial risk of loss and is not suitable for every investor. Past performance shown in examples is not indicative of future results.
The indicator provides signals and calculations, but trading decisions are solely your responsibility. Always:
Test strategies on paper before using real money
Never risk more than you can afford to lose
Understand that all trading involves risk
Consider seeking advice from a licensed financial advisor
The publisher makes no guarantees regarding accuracy, profitability, or performance. Use at your own risk.
---
Version: 3.0
Pine Script Version: v6
Last Updated: October 2024
For support, questions, or suggestions, please comment below or send a private message.
---
Happy trading, and remember: consistent risk management beats perfect entry timing every time.

PRO Scalper(EN)
## What it is
**PRO Scalper** is an intraday price–action and liquidity map that helps you see where the market is likely to move **now**, not just where it has been.
It combines five building blocks that professional scalpers often watch together:
1. **Session Volume-Weighted Average Price (VWAP)** — the intraday “fair value” anchor.
2. **Opening Range** — the first minutes of the session that set the day’s balance.
3. **Trend filter** — higher-timeframe bias using **Exponential Moving Averages (EMA)** and optional **Average Directional Index (ADX)** strength.
4. **Two independent Supply/Demand zone engines** — zones are drawn from confirmed swing pivots, with midlines and **touch counters**.
5. **Order-flow style visuals**:
* **Delta bubbles** (green/red circles) show where buying or selling pressure was unusually strong, using a safe **delta proxy** (no external feeds).
* **Liquidity densities** (subtle rectangular bands) highlight clusters of large activity that often act as magnets or barriers and disappear when “eaten” by strong moves.
This mix gives you a **complete intraday picture**: the mean (VWAP), the day’s initial balance (Opening Range), the higher-timeframe push (trend filter), the nearby fuel or brakes (zones), and the live pressure points (bubbles and densities).
---
## Why these components
* **VWAP** tracks where the bulk of traded value sits. Price tends to rotate around it or accelerate away from it — a perfect compass for scalps.
* **Opening Range** frames the early auction. Many intraday breaks, fades and retests start at its boundaries.
* **EMA bias + ADX strength** separates trending conditions from chop, so you can keep only the zones that agree with the bigger push.
* **Pivot-based zones (two pairs at once)** are simple, objective and fast. Midlines help with confirmations; touch counters quantify how many times the zone was tested.
* **Bubbles and densities** add the “effort” layer: where the push appeared and where liquidity is concentrated. You see **where** a move is likely to continue or fail.
Together they reduce ambiguity: **context + level + effort** — all on one screen.
---
## How it works (plain language)
* **VWAP** resets each day and is calculated as the cumulative sum of typical price multiplied by volume divided by total volume.
* **Opening Range** is either automatic (a multiple of your chart timeframe) or a manual number of minutes. While it is forming, the highest high and lowest low are captured and plotted as the range.
* **Trend filter**
* **EMA Fast** and **EMA Slow** define directional bias.
* **ADX (optional)** adds “trend strength”: only when the Average Directional Index is above the chosen threshold do we treat the move as strong. You can source this from a higher timeframe.
* **Zones**
* There are **two independent pairs** of pivots at the same time (for example 10-left 10-right and 5-left 5-right).
* Each detected pivot creates a **Supply** (from a swing high) or **Demand** (from a swing low) box. Box depth = **zone depth × Average True Range** for adaptive sizing; the boxes **extend forward**.
* Midline (optional dashed line inside the box) is the “balance” of the zone.
* **“Only in trend”** mode can hide boxes that go against the higher-timeframe bias.
* The **touch counter** increases when price revisits the box. Labels show the pair name and the number of touches.
* **Bubbles**
* A safe **delta proxy** measures bar pressure (for example, range-weighted close vs open).
* A **quantile filter** shows only unusually large pressure: choose lookback and percentile, and the script draws a circle sized by intensity (green = bullish pressure, red = bearish).
* **Densities**
* The script marks heavy activity clusters as **subtle bands** around price (depth = fraction of Average True Range).
* If price **breaks** a density with volume above its moving average, the band **disappears** (“eaten”), which often precedes continuation.
---
## How to use — practical playbooks
> Recommended chart: crypto or index futures, one to five minutes. Use **one hour** or **fifteen minutes** for the higher-timeframe bias.
### 1) Trend pullback scalp (continuation)
1. Enable **Only in trend** zones.
2. In an uptrend: wait for a pullback into a **Demand** zone that overlaps with VWAP or sits just below the Opening Range midpoint.
3. Look for **green bubbles** near the zone’s bottom or a fresh **density** under price.
4. Enter on a candle closing **back above the zone midline**.
5. Stop-loss: below the bottom of the zone or a small multiple of Average True Range.
6. Targets: previous swing high, Opening Range high, fixed risk multiples, or VWAP.
Mirror the logic for downtrends using Supply zones, red bubbles and densities above price.
### 2) Reversion with liquidity sweep (fade)
1. Bias neutral or countertrend allowed.
2. Price **wicks through** a zone boundary (or an Opening Range line) and **closes back inside** the zone.
3. The bubble color often flips (absorption).
4. Enter toward the **inside** of the zone; stop beyond the sweep wick; first target = zone midline, second = opposite side of the zone or VWAP.
### 3) Opening Range break and retest
1. Wait for the Opening Range to complete.
2. A break with a large bubble suggests intent.
3. Look for a **retest** into a nearby zone aligned with VWAP.
4. Trade continuation toward the next zone or the session extremes.
### 4) Density “eaten” continuation
1. When a density band **disappears** on high volume, it often means the resting liquidity was consumed.
2. Trade in the direction of the break, toward the nearest opposing zone.
---
## Settings — quick guide
**Core**
* *ATR Length* — used for zone and density depths.
* *Show VWAP / Show Opening Range*.
* *Opening Range*: Auto (multiple of timeframe minutes) or Manual minutes.
**Trend Filter**
* *Mode*: Off, EMA only, or EMA with ADX strength.
* *Use higher timeframe* and its value.
* *EMA Fast / EMA Slow*, *ADX Length*, *ADX threshold*.
* *Plot EMA filter* to display the moving averages.
**Zones (two pairs)**
* *Pivot A Left / Right* and *Pivot B Left / Right*.
* *Zone depth × ATR*, *Extend bars*.
* *Show zone midline*, *Only in trend zones*.
* Labels automatically show the touch counters.
**Bubbles**
* *Show Bubbles*.
* *Quantile lookback* and *Quantile percent* (higher percent = stricter filter, fewer bubbles).
**Densities**
* *Metric*: absolute delta proxy or raw volume.
* *Quantile lookback / percent*.
* *Depth × ATR*, *Extend bars*, *Merge distance* (in ATR),
* *Break condition*: volume moving average length and multiplier,
* *Midline for densities* (optional dashed line).
---
## Tips and risk management
* This script **does not use external order-flow feeds**. Delta is a **proxy** suitable for TradingView; tune quantiles per symbol and timeframe.
* Do not trade every bubble. Combine **context (trend + VWAP + Opening Range)** with **level (zone)** and **effort (bubble/density)**.
* Set stop-losses beyond the zone or at a fraction of Average True Range. Predefine risk per trade.
* Backtest your rules with a strategy script before using real funds.
* Markets differ. Parameters that work on Bitcoin may not transfer to low-liquidity altcoins or stocks.
* Nothing here is financial advice. Scalping is high-risk; slippage and over-trading can quickly damage your account.
---
## What makes PRO Scalper unique
* Two **independent** zone engines run in parallel, so you can see both **larger structure** and **fine intraday levels** at the same time.
* Clean **“only in trend” rendering** — zones and midlines against the bias can be hidden, reducing clutter and hesitation.
* **Touch counters** convert “feel” into numbers.
* **Self-contained order-flow visuals** (bubbles and densities) that require no extra data sources.
* Careful defaults: subtle colors for densities, clearer zones, and responsive auto Opening Range.
---
(RU)
## Что это такое
**PRO Scalper** — это индикатор для внутридневной торговли, который показывает **контекст и ликвидность прямо сейчас**.
Он объединяет пять модулей, которыми профессиональные скальперы пользуются вместе:
1. **VWAP** — средневзвешенная по объему цена за сессию, «справедливая стоимость» дня.
2. **Opening Range** — первая часть сессии, задающая баланс дня.
3. **Фильтр тренда** — направление старшего таймфрейма по **экспоненциальным средним** и при желании по силе тренда **Average Directional Index**.
4. **Две независимые системы зон спроса/предложения** — зоны строятся от подтвержденных экстремумов (пивотов), имеют **среднюю линию** и **счетчик касаний**.
5. **Визуализация «ордер-флоу»**:
* **Пузыри дельты** (зеленые/красные круги) — места повышенного покупательного/продажного давления, рассчитанные через безопасный **прокси-дельты**.
* **Плотности ликвидности** (ненавязчивые прямоугольные ленты) — скопления объема, которые нередко притягивают цену или удерживают ее и исчезают, когда «разъедаются» сильным движением.
Итог — **полная картинка момента**: среднее (VWAP), баланс дня (Opening Range), старшая сила (фильтр тренда), ближайшие уровни топлива/тормозов (зоны), текущие точки усилия (пузыри и плотности).
---
## Почему именно эти элементы
* **VWAP** показывает, где сосредоточена стоимость; цена либо вращается вокруг него, либо быстро уходит — идеальный ориентир скальпера.
* **Opening Range** фиксирует ранний аукцион — от его границ часто начинаются пробои, возвраты и ретесты.
* **EMA + ADX** отделяют тренд от «пилы», позволяя оставлять на графике только зоны по направлению старшего таймфрейма.
* **Зоны от пивотов** просты, объективны и быстры; средняя линия помогает подтверждать разворот, счетчик касаний переводит субъективность в цифры.
* **Пузыри и плотности** добавляют слой «усилия»: где именно возник толчок и где сконцентрирована ликвидность.
Комбинация **контекста + уровня + усилия** уменьшает двусмысленность и ускоряет принятие решения.
---
## Как это работает (простыми словами)
* **VWAP** каждый день стартует заново: сумма «типичной цены × объем» делится на суммарный объем.
* **Opening Range** — автоматический (кратный минутам вашего таймфрейма) или вручную заданный период; пока он формируется, фиксируются максимум и минимум.
* **Фильтр тренда**
* Две экспоненциальные средние задают направление.
* **ADX** (по желанию) добавляет «силу». Источник можно взять со старшего таймфрейма.
* **Зоны**
* Одновременно работает **две пары** пивотов (например 10-лево 10-право и 5-лево 5-право).
* От пивота строится зона **предложения** (от максимума) или **спроса** (от минимума). Глубина зоны = **коэффициент × Average True Range**; зона тянется вперед.
* Внутри рисуется **средняя линия** (по желанию).
* Режим **«только по тренду»** скрывает зоны против старшего направления.
* **Счетчик касаний** увеличивается, когда цена снова входит в зону; подпись показывает пару и количество касаний.
* **Пузыри**
* Используется безопасный **прокси-дельты** — измерение «напряжения» внутри свечи.
* Через **квантильный фильтр** выводятся только необычно сильные места: настраиваются окно и процент квантиля; размер кружка — сила, цвет: зеленый покупатели, красный продавцы.
* **Плотности**
* Крупные активности отмечаются **ненавязчивыми прямоугольниками** (глубина — доля Average True Range).
* Если плотность **пробивается** объемом выше среднего, она **исчезает** — часто это предвещает продолжение.
---
## Как пользоваться — практические схемы
> Рекомендация: крипто или фьючерсы, таймфрейм 1–5 минут. Для старшего фильтра удобно взять **1 час** или **15 минут**.
### 1) Скальп на откат по тренду
1. Включите **«только по тренду»**.
2. В восходящем тренде дождитесь отката в **зону спроса**, желательно рядом с **VWAP** или серединой **Opening Range**.
3. Подтверждение — **зеленые пузыри** у нижней границы зоны или свежая **плотность** под ценой.
4. Вход после закрытия свечи **выше средней линии** зоны.
5. Стоп-лосс: за нижнюю границу зоны или небольшой множитель Average True Range.
6. Цели: предыдущий максимум, верх Opening Range, фиксированные R-множители, либо VWAP.
Для нисходящего тренда зеркально: зоны предложения, красные пузыри и плотности над ценой.
### 2) Контрдвижение с «выбиванием ликвидности»
1. Нейтральный или контртрендовый режим.
2. Цена **выносит хвостом** границу зоны (или линию Opening Range) и **закрывается обратно внутри**.
3. Цвет пузыря часто меняется (поглощение).
4. Вход внутрь зоны; стоп — за хвост выбивания; цели: средняя линия, противоположная граница зоны или VWAP.
### 3) Пробой Opening Range + ретест
1. Дождитесь завершения диапазона.
2. Сильный пробой с крупным пузырем — признак намерения.
3. Ищите **ретест** в зоне по тренду рядом с линией диапазона и VWAP.
4. Торгуйте продолжение к следующей зоне.
### 4) Продолжение после «съеденной» плотности
1. Когда прямоугольник плотности **исчезает** на повышенном объеме, это значит, что ликвидность поглощена.
2. Торгуйте в сторону пробоя к ближайшей противоположной зоне.
---
## Настройки — краткая шпаргалка
**Core**
— Длина Average True Range (для размеров зон и плотностей).
— Включение VWAP и Opening Range.
— Длина Opening Range: автоматическая (кратная минутам ТФ) или ручная.
**Trend Filter**
— Режим: выкл., только средние, либо средние + ADX.
— Источник со старшего таймфрейма и его значение.
— Длины средних, длина ADX и порог силы.
— Показать/скрыть линий средних.
**Zones (две пары одновременно)**
— Пара A: лев/прав; Пара B: лев/прав.
— Глубина зоны × Average True Range, продление по барам.
— Средняя линия, режим **«только по тренду»**.
— Подписи со счетчиком касаний.
**Bubbles**
— Вкл./выкл., окно поиска и процент квантиля (чем выше процент — тем реже пузыри).
**Densities**
— Метрика: абсолютная прокси-дельты или чистый объем.
— Окно/квантиль, глубина × Average True Range, продление,
— Порог объединения (в Average True Range),
— Условие «разъедания» по объему,
— Средняя линия плотности (по желанию).
---
## Советы и риски
* Индикатор **не использует внешние потоки ордер-флоу**. Дельта — **прокси**, подходящая для TradingView; подбирайте квантили под инструмент и таймфрейм.
* Не торгуйте каждый пузырь. Склейте **контекст (тренд + VWAP + Opening Range)** с **уровнем (зона)** и **усилием (пузырь/плотность)**.
* Стоп-лосс — за границей зоны или по Average True Range. Риск на сделку задавайте заранее.
* Перед реальными деньгами протестируйте правила в стратегии.
* Разные рынки ведут себя по-разному; настройки из Биткоина могут не подойти малоликвидным альткоинам или акциям.
* Это не инвестиционная рекомендация. Скальпинг — высокий риск; проскальзывание и переизбыток сделок быстро наносят ущерб капиталу.
---
## Чем уникален PRO Scalper
* Две **одновременные** системы зон показывают и **крупную структуру**, и **точные локальные уровни**.
* Режим **«только по тренду»** чистит экран от лишних уровней и ускоряет решение.
* **Счетчики касаний** дают количественную опору.
* **Самодостаточные визуализации усилия** (пузыри и плотности) — без сторонних источников данных.
* Аккуратная цветовая схема: плотности — мягко, зоны — ясно; Opening Range — адаптивный.
Пусть он станет вашей «картой местности» для быстрых и дисциплинированных решений внутри дня.

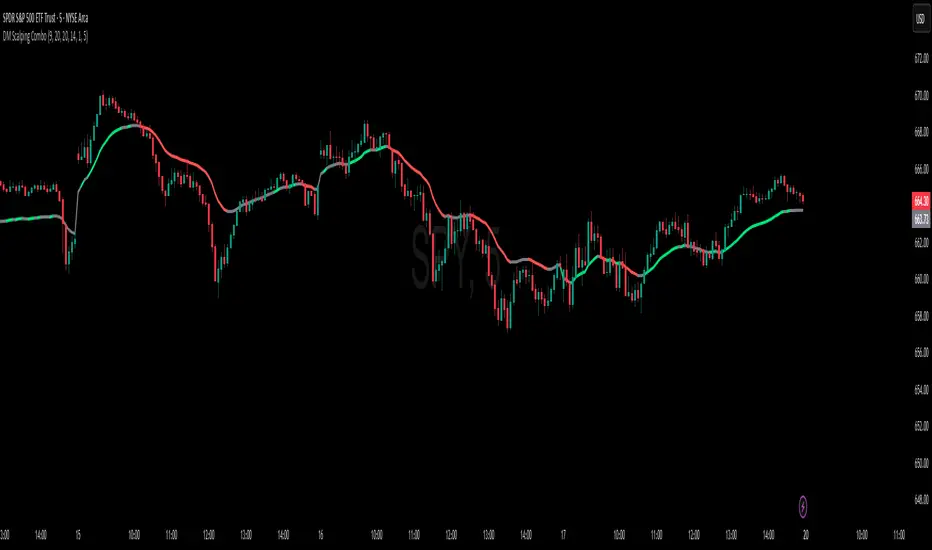
DM Scalping Combo (Price vs EMA9 • EMA20 • VWAP)Here’s a simple, tradeable way to use your indicator. I’ll give you two core “enter” playbooks (one momentum, one pullback), with exact triggers, invalidation, and targets. You can use either or both.
1) Momentum after consolidation (my top pick)
Idea: wait for a tight consolidation, then take the first aligned break when price is above/below the ema combo line. for bull enter green after consolidation break.
For bear enter red after consolidation break
MACD cross over Buy/SellThis Indicator is purely on buying and selling the Script based on the MACD crossover Signals, which can be used for Scalping and finding the trend of the script for short and long term. When the MACD Line crosses the Signal line upwards, the script will move towards higher, and will move towards Lower when it crosses downwards. It's simple. Particularly, when the MACD line Crosses above the zero line after crossing the Signal line, the momentum will be high. Whereas when the MACD line Crosses below the zero line after crossing the Signal line downward, the momentum of falling will be high.

Reversal Nexus Pro Suite — Smart Scalper/Swing Trader/Hybrid 📝 Description
The Reversal Suite (5–15m) is a dynamic price-action-driven indicator built for scalpers and intraday traders who want to catch high-probability reversals with precision.
This system combines SFP (Swing Failure Patterns), Volume Climax filters, EMA bias, and momentum confirmation logic — all customizable to match your personal trading style.
The default configuration is tuned for NASDAQ futures (NQ1!) and similar indices on 5–15-minute charts, but it can adapt seamlessly to crypto, forex, and equities.
⚙️ How It Works
The indicator looks for exhaustion points in price where:
Volume Climax confirms liquidity sweeps,
EMA bias determines directional filters (single or dual-EMA),
Reclaim and rejection mechanics confirm structure shifts,
Momentum thrust ensures strength on reversal confirmation.
Each setup requires multi-factor alignment to reduce noise and increase signal precision.
🧩 Default Custom Settings (Recommended Start)
Setting Value Description
Mode Custom Enables full manual control
Signals must align within N bars 6 Forces confluence across recent bars
TP1 / TP2 (R-Multiples) 1.5 / 2.5 Default reward zones
RSI Divergence Enabled Adds secondary reversal confirmation
Volume Climax Enabled Detects high-volume exhaustion
Vol SMA Length 21 Volume baseline calculation
Climax ≥ k × SMA 7 Strength multiplier for volume spikes
EMA Length 200 Trend bias reference
Bias Both Allows both long and short setups
Dual EMA Bias Enabled Uses fast (21) vs slow (100) bias tracking
Min Distance from EMA Bias 2.55% Filter to avoid signals too close to MAs
Reclaim Buffer After Sweep 0.22% Ensures valid break-and-reclaim setups
Max Bars for Retest 1 Tight retest condition
Momentum Thrust Confirm Enabled Ensures volume and price thrust
Body ≥ ATR -6 Controls candle thrust sizing
TR SMA Length 20 Measures dynamic volatility
Body ≥ k × TR-SMA -4.4 Confirms structure-based rejection
Opposite-Signal Exit Enabled Auto-clears opposite signals
Opposite Signal Window 5 bars Short-term conflict filter
Swing Lookback (SFP) 2 Finds recent liquidity highs/lows
Cooldown Bars After Signal 8 Prevents over-triggering
🟢 Inputs are fully adjustable, so traders can optimize for:
Scalping (lower EMA, smaller swing lookback)
Swing trading (higher EMA, larger retest window)
Aggressive vs conservative confirmations
🧭 Recommended Use
Works best on 5m–15m timeframes
Pair with VWAP or EMA cloud overlays for directional context
Use Trend Guard to align only with higher-timeframe trend
Ideal for indices, forex majors, and large-cap stocks
🚀 Highlights
✅ Smart confluence-based reversal detection
✅ Built-in retest and rejection logic
✅ Dual EMA and volume climax filters
✅ Customizable momentum thrust confirmation
✅ Optimized for scalpers and intraday swing traders
🧱 Suggested Layout
Chart type: Candlestick
Timeframe: 5m or 15m
Overlay: VWAP / EMA Cloud / ORB Zone
Optional filters: ATR Bands, Volume Profile (VPVR), Session Boxes
⚠️ Disclaimer
The Reversal Nexus Pro indicator is provided for educational and informational purposes only. It is not financial advice and should not be interpreted as a recommendation to buy, sell, or trade any financial instrument.
Trading involves significant risk and may not be suitable for all investors. Past performance does not guarantee future results. Always perform your own analysis and use proper risk management before placing any trades.
The author of this script is not responsible for any financial losses or decisions made based on the use of this tool.
By using this indicator, you acknowledge that you understand these terms and accept full responsibility for your own trading results.
© 2025. All rights reserved. Redistribution or resale of this indicator, in full or in part, is strictly prohibited without the author’s written consent.

TrendLock Pro 2 — Dual Trend Confirmation📊 TrendLock Pro 2 — Dual Trend Confirmation
🔒 Trade only when the trend is locked and confirmed
TrendLock Pro is a professional no-repaint indicator designed for traders who want to cut through market noise and only capture validated opportunities.
It combines two powerful filters:
TrendScope (current timeframe) → fast detection of momentum shifts through an intelligent RSI setup.
Flow Guard (higher timeframe) → directional filter that only confirms trades aligned with the macro trend.
👉 The result: you only enter when both trends agree , ensuring dual validation before every trade.
🚀 Key Features
✅ No Repaint : signals remain reliable once printed.
✅ Dual Validation : micro-trend (M1, M5…) confirmed by the macro-trend (M15, M30…).
✅ Smart Filters : reduces false signals against the main trend.
✅ Versatile : ideal for M1 scalping, intraday trading, or swing setups.
✅ Built-in Alerts : get notified only when confirmation is strong.
✅ Clear Visuals : green diamonds for confirmed LONGs, red diamonds for confirmed SHORTs.
🎯 Who is it for?
Scalpers seeking safer entries.
Day traders looking to avoid counter-trend traps.
Swing traders preferring cleaner, filtered setups.
💡 Usage Tips
📉 Using Heikin Ashi candles smooths signals and makes them easier to read.
🛡️ Always place your Stop Loss wisely: the indicator doesn’t predict the future but analyzes real-time multi-timeframe trends.
🎯 Avoid being too greedy with Take Profits — aim for balanced targets to maintain a strong win rate.
⚡ Two trends, one signal. Trade with confirmation.
