Buy / Sell Volume HeaderBuy / Sell Volume Header
Description
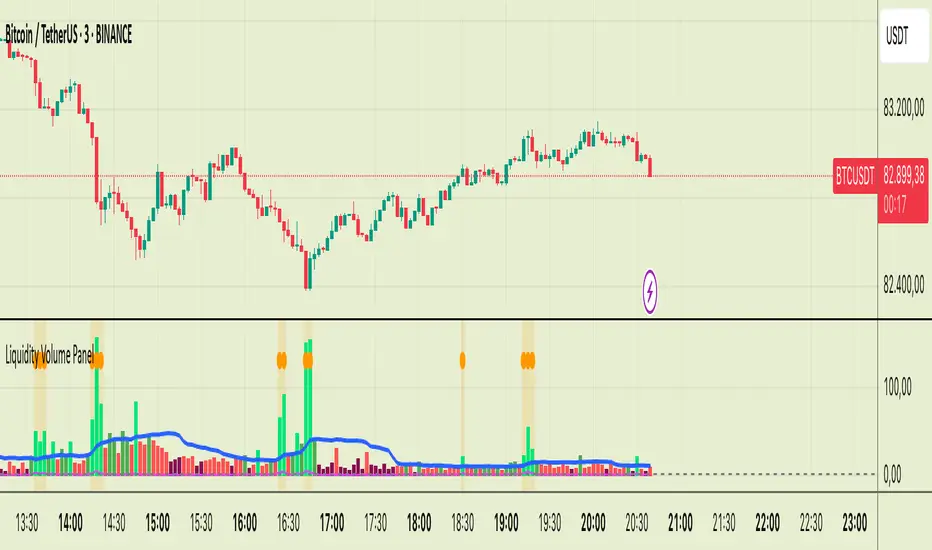
- Buy / Sell Volume Header displays real-time buying and selling volume with percentages in a clean dashboard at the top or bottom of your chart. The indicator calculates buying pressure as volume weighted toward the close relative to the bar's range, and selling pressure as volume weighted toward the high.
- Perfect for day traders and scalpers who need instant visual confirmation of buying vs selling pressure without cluttering their chart with additional panes.
Key Features:
- Real-time buy/sell volume split with percentages
- Customizable lookback period (1 bar for current, or sum multiple bars)
- Adjustable table position (top/bottom, left/center/right)
- Five size options (Tiny to Huge)
- Color-coded: Green (buying volume), Red (selling volume)
- Clean, minimal design that doesn't obstruct price action
Calculation Method:
- Buying Volume = Total Volume × (Close - Low) / (High - Low)
- Selling Volume = Total Volume × (High - Close) / (High - Low)
How to Use:
- Select header location (default: Top Right) and table size (default: Normal). Set lookback period to 1 for current bar only, or higher values to see cumulative volume over multiple bars.
Reading the Display:
- Green Box (Left): Buying volume and percentage of total
- Red Box (Right): Selling volume and percentage of total
- Numbers update in real-time on every tick
Trading Applications:
- Trend Confirmation:
- In uptrends, buying volume should consistently be >60%.
- In downtrends, selling volume should be >60%. Divergences warn of potential reversals.
Breakout Validation:
- Valid breakouts show 70%+ volume in breakout direction.
- Breakouts with <55% directional volume often fail.
Reversal Signals:
- When price makes new high but buying volume drops below 50%, watch for reversal. When price makes new low but selling volume drops below 50%, watch for bounce.
Scalping Entry:
- Enter long when buying volume spikes above 65-70% with price momentum. Enter short when selling volume spikes above 65-70% with price momentum.
Best Practices:
- Use lookback=1 for intraday scalping. Use lookback=3-5 for swing context. Combine with price action for confirmation. Volume percentages work best on liquid instruments (MNQ, MES, stocks with high volume).
NPR21
Disclaimer
The information and publications are not meant to be, and do not constitute, financial, investment, trading, or other types of advice or recommendations supplied or endorsed by TradingView.
Penunjuk Pine Script®