Scalping EMA ADX RSI with Buy/Sell AlertsThis is a study indicator that shows the entries in the strategy seen in one of the youtube channel so it does not belong to me. I can't tell who it is because it's against the House Rules to advertise but you can find out if you look for it on youtube. Default values of oscilators and ema adjusted as suggested. He says he got the best results in 5 min timeframe but i tried to make things as modifiable as possible so you can mess around with the settings and create your own strategy for different timeframes if you'd like. Suggested to use with normal candlestick charts. The blue line below indicates the ADX is above the selected threshold set in the settings named "Trend Ready Limit". You can set alerts for Buy, Sell or Buy/Sell signal together.
The entry strategy itself is pretty straight forward.
The rules for entry are as follows, the script will check all of this on auto and will give you buy or sell signal :
Recommended time frame: 5 min
For Long Entry:
- Check if price above the set EMA (Can disable this rule if you'd like in the settings)
- RSI is in Oversold
- ADX is above set "Trend Ready" threshold (Meaning there is a trend going on)
- Price must approve the trend of previous candles. This is bullish for buy entries and bearish for sell entries.
- Enter with stop loss below last swing low with 1:1 or 1.5:1 take profit ratio.
For Short Entry:
- Check if price below the set EMA (Can disable this rule if you'd like in the settings)
- RSI is in Overbought
- ADX is above set "Trend Ready" threshold (Meaning there is a trend going on)
- Price must approve the trend of previous candles. This is bullish for buy entries and bearish for sell entries.
- Enter with stop loss above last swing high with 1:1 or 1.5:1 take profit ratio.
This is my first indicator. Let me know if you want any updates. I am not sure if i can add everything but i'll try nonetheless.
Changed: Signals will check up to 2 candles before if the RSI is below or above the set value to show signal. This is because sometimes the entry signal is right but the response might be a bit late.
Cari dalam skrip untuk "scalping"

Scalping 2x MACDThis indicator allows you to plot 2 MACD's within one indicator.
Colors :
Pink for the MACD 1 with std settings 12 - 26 - 9
Green for MACD 2 with settign 5 - 15 - 1


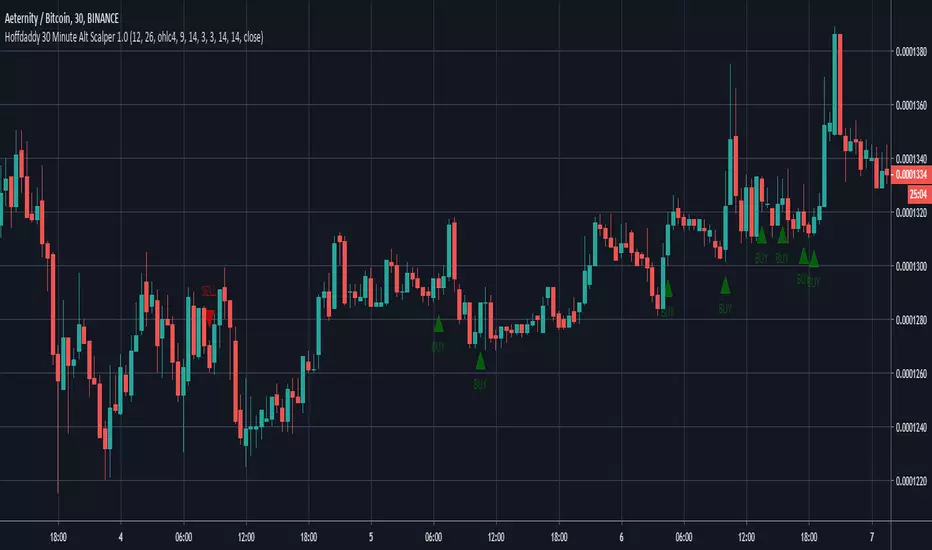
Hoffdaddy 30 Minute Alt Scalper 1.0Scalping indicator for bot trading on altcoins vs BTC. Works best on 30 minutes with minimal DCA, tight stop loss, and 1-2% take profit. No repaint, use candle close on alerts to avoid ghost signals.
PM for temporary access.
As always, I welcome feedback.
Scalping Basics, Indicator v2Auto-plots:
1) After/pre-market range
2) Y OHLC
3) YY OHLC
4) Ability to change background color to split the market into different sessions


Scalping QuantitativeThis is a tool designed to help with mean reverting trades but at the same time provide trend to determine direction. Bar coloring is based on a logarithmic oscillator with red meaning overbought and green meaning oversold.
By giving trend, it can help decide if a trade should be taken. This tool isn't designed for highly volatile markets.

Scalping RibbonCombination of 4 short sma's in one ribbon with optional parabolic sar ribbon color defined by long term ema


Scalping Criptomania EMA - VolumenVersión 1 - 15/02/2018
Indicadores utilizados :
- Ema 13 ( red )
- Ema 34 ( blue )
- Volumen MV : 10
- Bandas de bollinger
Entrada (flecha hacia arriba verde) : cruce hacia arriba y volumen mayor que mv(10)
Salida (flecha hacia abajo roja) : Cruza las bandas de bollinger y vuelve a bajar dará salida o vuelven a cruzar las ema.


Power Balance ForecasterHey trader buddy! Remember the old IBM 5150 on Wall Street back in the 80s? :) Well, I wanted to pay tribute to it with this retro-style code when MS DOS and CRT screens were the cutting edge of technology...
Analysis of the balance of power between buyers and sellers with price predictions
What This Indicator Does
The Power Balance Forecaster indicator analyzes the relationship between buyer and seller strength to predict future price movements. Here's what it does in detail:
Main Features:
Power Balance Analysis: Calculates real-time percentage of buyer power vs seller power
Price Predictions: Estimates next closing level based on current momentum
Market State Detection: Identifies 5 different market conditions
Visual Signals: Shows directional arrows and price targets
How the Trading Logic Works
Power Balance Calculation:
Analyzes Consecutive Bars - Counts consecutive bullish and bearish bars
Calculates Momentum - Uses ATR-normalized momentum to measure trend strength
Determines Market State - Assigns one of 5 market states based on conditions
Market States:
Bull Control: Strong uptrend (75% buyer power)
Bear Control: Strong downtrend (75% seller power)
Buying Pressure: Bullish pressure (65% buyer power)
Selling Pressure: Bearish pressure (65% seller power)
Balance Area: Market in equilibrium (50/50)
Prediction System:
Bullish Condition: Buyer power > 55% + Positive momentum = Bullish prediction
Bearish Condition: Seller power > 55% + Negative momentum = Bearish prediction
Price Target: Based on ATR multiplied by timeframe factor
Configurable Parameters:
Analysis Sensitivity (5-50): Controls how responsive the indicator is
Low values (5-15): More sensitive, ideal for scalping
High values (30-50): More stable, ideal for swing trading
Table Position: Choose from 9 positions to display the data table
Trading Signals:
Green Triangle ▲: Bullish signal, price expected to increase
Green Triangle ▼: Bearish signal, price expected to decrease
Dashed Line: Shows the price target projection
Label: Displays the exact target value
Recommended Timeframes:
Lower Timeframes (1-15 minutes):
Sensitivity: 10-20
Automatic Low TF mode
Higher Timeframes (1 hour - 1 day):
Sensitivity: 25-40
Automatic High TF mode
Important Notes:
Always use this indicator in combination with:
Market context analysis
Proper risk management
Confirmation from other indicators
Mandatory stop losses
The indicator works best in trending markets and may be less effective during extreme consolidation periods.

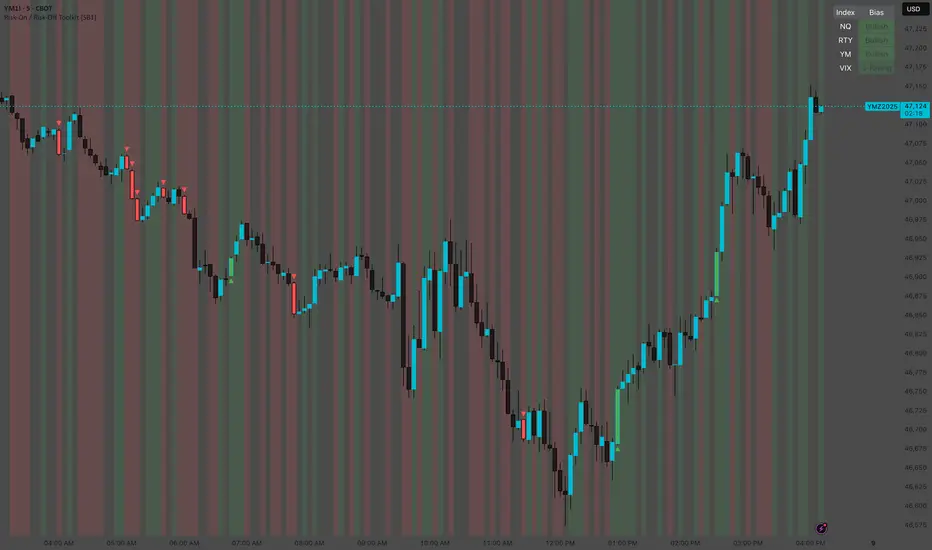
Risk-On / Risk-Off Toolkit [SB1] (NQ, RTY, YM) VIXDescription:
The Risk-On / Risk-Off Toolkit is a professional-grade market context indicator designed to help traders quickly identify broad market sentiment shifts and gauge risk appetite. By combining major US equity futures (NQ, RTY, YM) with VIX dynamics, this toolkit provides clear visual signals of “Risk-On” (bullish, lower volatility environment) and “Risk-Off” (bearish, higher volatility environment) conditions. This is ideal for traders using discretionary analysis, swing strategies, intraday scalping, or portfolio positioning decisions.
My Personal Thoughts: Utilize all 3 charts to Identify which is Leading and who is lagging between the 3 (NQ, RTY, YM) Key Features:
Futures Trend Analysis:
Monitors the Nasdaq 100 (NQ), Russell 2000 (RTY), and Dow Jones (YM) futures in real-time.
Determines bullish/bearish bias based on each futures contract’s current close relative to its open.
Identifies when all three indices are moving in sync, highlighting broad market directional alignment.
VIX Confirmation:
Integrates the CBOE Volatility Index (VIX) to gauge market risk sentiment.
Confirms Risk-On conditions when VIX is falling while all three futures are bullish.
Confirms Risk-Off conditions when VIX is rising while all three futures are bearish.
Optional background shading visually highlights Risk-On (green) and Risk-Off (red) conditions for quick, intuitive assessment.
Strong Body Candle Signals:
Detects high conviction candlestick moves where the body represents at least 85% of the total range.
Confirms whether the candle closes near its extreme (top for bullish, bottom for bearish) within 15% of the range.
Plots arrows for strong bullish or bearish candles:
Green triangle-up for bullish strong candles
Red triangle-down for bearish strong candles
Provides a visual cue for intraday or swing traders to confirm trend momentum without cluttering the chart with labels.
Alert System:
Alerts can be set for Risk-On alignment: all monitored futures are bullish and VIX is falling.
Alerts can also be set for Risk-Off alignment: all monitored futures are bearish and VIX is rising.
Ensures traders never miss shifts in broad market sentiment, suitable for both intraday and end-of-day review.
Table Summary:
Provides a top-right summary table of each monitored market and VIX:
Displays Index Name and Current Bias (Bullish/Bearish/Neutral).
Highlights bullish conditions in green and bearish conditions in red.
Includes VIX status as “↓ Falling”, “↑ Rising”, or “Flat”, providing a quick visual reference of volatility trends.
Customizable Visuals:
Control the visibility of strong candle arrows.
Maintains dynamic bar coloring for strong candle moves (green for bullish, red for bearish).
How to Use the Risk-On / Risk-Off Toolkit:
Trend Confirmation: Use the alignment of NQ, RTY, and YM to determine whether the overall market environment is bullish or bearish.
Risk Sentiment Filter: Use VIX confirmation to identify if traders are in a risk-on or risk-off sentiment. This is especially useful for adjusting position sizing, hedging, or timing entries.
Momentum Validation: Strong candle arrows indicate decisive moves, providing additional confirmation for trade entries, breakouts, or trend continuation.
Alerts & Visual Cues: Set alerts to be notified whenever Risk-On or Risk-Off conditions are met, helping you act in real-time.
Quick Reference: Use the summary table for a bird’s-eye view of market alignment across indices and VIX, avoiding the need to track multiple charts simultaneously.
Why This Indicator is Unique:
Combines three major US indices with volatility confirmation to identify true macro market sentiment shifts.
Provides both visual and alert-based signals for actionable insights.
The inclusion of strong candle arrows gives intraday and swing traders a clear, low-latency cue for high-probability moves.
Perfect for multi-timeframe analysis and adaptable to both short-term and long-term strategies.
Indicator Name Justification:
The name “Risk-On / Risk-Off Toolkit ” accurately reflects the core function: identifying broad market risk appetite and sentiment alignment across key indices with volatility confirmation. It communicates instantly that the tool helps traders understand when the market is favoring risk-taking (Risk-On) versus risk-aversion (Risk-Off).
Orderflow [Pro+] (DeadCat)This indicator introduces a sophisticated, multi-timeframe approach to detecting and visualizing Fair Value Gaps (FVGs)—also known as price imbalances—in order flow analysis. FVGs represent inefficiencies in price delivery where rapid buying or selling pressure creates a "gap" between candles, often signaling areas where price is likely to return to "fill" the imbalance due to unfilled liquidity. Unlike basic single-timeframe FVG tools that simply highlight gaps without context, this script layers in hierarchical time-based rules (HTF influencing LTF) to filter noise, enforce directional bias, and project dynamic support/resistance levels post-mitigation.
The core innovation lies in its bias-driven ecosystem: Higher timeframes (HTF) establish a "master bias" (bullish or bearish) upon FVG mitigation, which then governs lower timeframes (LTF) by suppressing conflicting FVGs or deleting overlapping ones. This creates a cascading structure where, for example, a bullish daily FVG might invalidate bearish 15-minute gaps above its bottom edge, promoting confluence across scales. Additionally, it incorporates dynamic swing tracking (updating highs/lows in real-time post-mitigation) and overlapping liquidity lines (projecting prior swings trapped within the FVG), turning static gap detection into a proactive order flow mapper.
This isn't a mere mashup of standard FVG logic (e.g., 3-candle imbalance checks) or swing detectors; the components synergize to simulate institutional order flow dynamics—prioritizing liquidity sweeps and bias alignment—reducing false signals in choppy markets. It's designed for traders seeking edge in scalping, swing, or position trading without repainting or lookahead bias in historical data.
Key Concepts Underlying the Calculations
FVG Detection Mechanism:
Uses a classic 3-candle imbalance filter: For a bullish FVG, the low of the current bar must gap above the high of the bar two periods ago (low > high ), with the prior bar's low dipping below that high (low < high ) to confirm inefficiency. The inverse applies for bearish FVGs (high < low , high > low ).
Introduces a BAG filter (Bias-Aligned Gap): Checks if the close of the confirming candle aligns with the gap's midpoint (e.g., close > midpoint for bullish), discarding "weak" gaps where price closes against the expected direction. This refines raw imbalances to those backed by momentum.
Swing Identification and Projection:
Tracks fixed swings (static high/low from the FVG formation bar) and dynamic swings (updating to new extremes post-mitigation, e.g., highest high since a bullish FVG touch).
Equal Range Lines (ERL): Post-mitigation, projects horizontal lines from fixed/dynamic swings as potential support (bullish) or resistance (bearish). These extend rightward until breached, with optional pre-tap visibility for anticipation.
Overlapping Liquidity: Scans the 5-bar lookback within the FVG range for trapped highs/lows, drawing a dotted line to highlight "engineered liquidity" zones where stops might cluster.
Hierarchical Bias Rules (HTF-LTF Interaction):
Once an FVG is mitigated (price touches its opposite edge, e.g., low piercing a bullish FVG's top), it activates a bias state for that timeframe (bullish: +1; bearish: -1), storing the gap's bounds as a reference.
LTF Suppression: New LTF FVGs opposing the HTF bias are blocked if they form in invalid zones (e.g., bearish LTF FVG bottom > bullish HTF bottom). Existing LTF FVGs are deleted if engulfed, partially overlapped, or directionally misaligned (6 overlap rules, including full engulfment or same-direction displacement).
Reset Triggers: Bias resets on opposing swing breaks (e.g., low < fixed swing in bullish state) or exhaustive mitigation (all FVGs filled), ensuring adaptability.
Mitigation and Extension Logic:
FVGs extend as semi-transparent boxes until fully mitigated (price closes beyond the far edge), then halt extension and optionally change color (e.g., red tint for filled zones).
Current-timeframe FVGs shift left by 2 bars to align with real-time bar indexing, avoiding visual lag.
These concepts draw from ICT (Inner Circle Trader) order flow principles—focusing on liquidity voids and bias hierarchies—but implement them programmatically with cross-TF validation, which isn't standard in most FVG scripts.
How It Works: Step-by-Step Signal Generation
Data Fetching: Pulls OHLCV from up to 6 user-defined timeframes (default: 15m, 1H, 4H, D, W, M) using request.security with barmerge to sync HTF bars to LTF without gaps.
FVG Formation: On each HTF bar close, scans for imbalances. If valid (post-bias filter), initializes state: clears prior opposing data, sets fixed/dynamic swings, and draws the box from formation time to infinity.
Ongoing Updates:
Boxes/labels/midlines extend rightward.
Swings update dynamically if new highs/lows form post-mitigation.
HTF bias propagates downward, pruning LTF noise in real-time.
Mitigation Check: On every LTF bar, tests if price pierces the nearest FVG edge. If so, activates bias, projects ERLs/overlaps, and cascades deletions.
Visualization: Boxes (FVGs) with midlines/labels; solid/dashed ERLs for swings; dotted overlaps. Optional table summarizes bias status (e.g., "▲ bullish IRL reacting" if price respects the level).
No future data is used—calculations are historical and real-time safe. Max limits (500 boxes/lines/labels) prevent overload.
How to Use It: Practical Application
Setup: Add to your chart (overlay=true). Enable 2-4 timeframes for confluence (e.g., 15m for entries, 1H/4H for bias). Set biases to "Auto" for dynamic detection, or "▲"/"▼" to force bullish/bearish filtering. Use universal colors for clean multi-TF overlays; tweak line styles/widths for visibility.
Interpretation:
Watch for FVGs: Bullish (upward gap, blue box) suggests buy-side inefficiency—expect pullbacks to fill from above. Bearish (downward gap) indicates sell pressure.
Bias Alignment: Green table status (e.g., "▲ reacting") signals strength; red ("failing") warns of reversal. Prioritize trades where LTF FVGs align with HTF bias.
Entry/Exit Ideas: Enter longs on bullish FVG mitigation (low touches top, ERL projects support). Target the box bottom or dynamic swing. Exit on bias reset (opposing break).
Risk Management: FVGs act as dynamic S/R. Use overlaps for stop placement (e.g., below trapped low). Avoid non-standard charts (Heikin Ashi) as signals distort.
Backtest with realistic slippage (0.1-0.5%) and risk <2% per trade. Past fills don't guarantee future ones—always combine with discretion.
Disclaimer: For educational purposes. Not financial advice. Verify in a demo account.

Pulsar Trading System-LITE📡 Pulsar Trading System
OVERVIEW
Pulsar is a comprehensive breakout trading system that combines dynamic support/resistance detection, trend filtering, and volume confirmation to identify high-probability entry opportunities. Unlike simple breakout indicators, Pulsar uses multi-timeframe analysis and adaptive ATR-based calculations to filter false signals and provide complete trade management from entry to exit.
WHAT MAKES THIS ORIGINAL
This indicator is unique in its integration of multiple complementary systems:
-Adaptive ATR Zones: Support and resistance levels are not static—they dynamically adjust based on current market volatility (ATR), creating entry zones that expand and contract with market conditions rather than using fixed price levels.
-Multi-Timeframe SuperTrend Filter: The trend filter operates on a higher timeframe than the chart (e.g., 5-minute SuperTrend on a 1-minute chart) to prevent counter-trend trades while maintaining granular entry precision. The visual ribbon with humorous warning text ("🚫 Don't Short - Trend is Your Friend! 📈") provides immediate trend awareness.
-Intelligent Cooldown System: After any trade exit (stop loss or take profit), the system enters a configurable cooldown period, preventing overtrading during choppy or consolidating market conditions—a critical feature often missing in breakout systems.
-Dynamic Trailing Stops: The trailing stop uses ATR multipliers to lock in profits while adapting to volatility, moving only in the favorable direction and never loosening.
-Comprehensive Dashboard: Real-time analysis displays trade status, entry prices, distances to targets in both points and ATR multiples, volume confirmation status, and cooldown countdown.
HOW IT WORKS
Core Detection Logic:
Pulsar identifies breakout opportunities by monitoring price interaction with dynamically calculated support and resistance levels:
Support/Resistance Calculation: Uses ta.lowest() and ta.highest() over a configurable lookback period to identify key levels, then adds ATR-based buffers (0.5 × ATR) to create entry zones.
Breakout Conditions:
Long Entry: Price closes above support buffer AND recent low touched support AND volume exceeds threshold
Short Entry: Price closes below resistance buffer AND recent high touched resistance AND volume exceeds threshold
SuperTrend Filter: A separate higher-timeframe SuperTrend calculation determines overall trend direction. Entries only trigger when breakout direction aligns with SuperTrend (bullish breakout + bullish trend, or bearish breakout + bearish trend).
Volume Confirmation: Current volume must exceed a configurable multiple of the 14-period SMA (default 1.0×) to confirm genuine interest in the breakout.
Cooldown Mechanism: After exit, the system tracks bars elapsed and blocks new signals until the cooldown period completes, preventing rapid-fire entries in ranging markets.
Trade Management:
Stop Loss: Calculated as entry zone ± (ATR × SL Multiplier)
Take Profit 1: Entry zone ± (ATR × TP1 Multiplier)
Take Profit 2: Entry zone ± (ATR × TP2 Multiplier)
Trailing Stop (optional): Updates every bar, moving the stop closer by maintaining distance of (ATR × Trailing Multiplier) from current price, but only in favorable direction
SuperTrend Calculation:
The SuperTrend uses standard methodology:
Upper Band = (High + Low) / 2 + (Multiplier × ATR)
Lower Band = (High + Low) / 2 - (Multiplier × ATR)
Direction changes when price crosses opposite band
The ribbon visualization adds a width offset (ATR × Ribbon Width) to create a filled zone rather than a single line.
HOW TO USE
Setup:
Add Pulsar to your chart (works best on liquid instruments like NQ, ES, CL)
Configure timeframe-specific settings (see recommendations below)
Enable SuperTrend Filter for trend-following mode, or disable for pure breakout mode
Set up alerts for Entry, TP1, TP2, and Stop Loss events
Recommended Settings by Timeframe:
1-Minute Charts:
Lookback Period: 10-15
SuperTrend Timeframe: 5 min
ATR Timeframe: 5 min (for stability)
Cooldown: 8-12 bars
Trailing Stop: Enabled with 0.8-1.0 multiplier
5-Minute Charts:
Lookback Period: 15-20
SuperTrend Timeframe: 15 min
ATR Timeframe: current chart
Cooldown: 5-8 bars
Trailing Stop: Optional
15-Minute+ Charts:
Lookback Period: 20-30
SuperTrend Timeframe: 1 hour
ATR Timeframe: current chart
Cooldown: 3-5 bars
Trailing Stop: Optional
Interpreting Signals:
Long/Short Zone Box: Green (long) or red (short) box appears when breakout conditions are met
Blue Entry Line: Shows your entry price
Red/Orange SL Line: Red = fixed stop, Orange = trailing stop (moves in real-time)
Green TP Lines: TP1 (closer) and TP2 (further) targets
SuperTrend Ribbon: Green = bullish trend (favor longs), Red = bearish trend (favor shorts)
Dashboard Status: Monitor trade state, distances, volume confirmation, and cooldown
Best Practices:
Use SuperTrend Filter: Significantly reduces false signals by avoiding counter-trend trades
Enable Cooldown on Fast Timeframes: Prevents overtrading on 1-5 minute charts
Volume Confirmation is Critical: Don't lower volume multiplier below 0.9 on futures
Use Higher Timeframe ATR: On 1-minute charts, use 5-minute ATR for stability
Avoid Major News Events: Disable during FOMC, NFP, CPI releases
Scale Out Strategy: Consider taking partial profits at TP1, letting remainder run to TP2
Parameter Optimization:
Start conservative and adjust based on results:
Too many stop-outs: Increase SL multiplier or SuperTrend multiplier
Missing good trades: Decrease volume multiplier or cooldown period
Too many false signals: Increase volume multiplier, lookback period, or cooldown
Profits not protected: Enable trailing stop or reduce trailing multiplier
KEY FEATURES
✅ Dynamic ATR-Based Zones: Entry, stop loss, and take profit levels automatically adjust to market volatility
✅ Multi-Timeframe Trend Filter: Uses higher timeframe SuperTrend to eliminate counter-trend trades
✅ Volume Confirmation: Filters low-volume false breakouts
✅ Intelligent Cooldown: Prevents overtrading with configurable post-trade waiting period
✅ Trailing Stop System: Optional dynamic stops that lock in profits using ATR distance
✅ Real-Time Dashboard: 13-row analysis showing trade status, targets, distances, volume, and cooldown
✅ Visual Ribbon Warnings: Humorous trend-following reminders on SuperTrend ribbon
✅ Complete Alert System: Notifications for entries, TP1, TP2, fixed stops, and trailing stops
✅ Customizable Visuals: Adjustable colors, dashboard position, text size, and line lengths
✅ Non-Repainting: Uses lookahead = barmerge.lookahead_off for all multi-timeframe calculations
SETTINGS EXPLAINED
SuperTrend Filter:
Enable: Toggle trend filtering on/off
Timeframe: Higher timeframe for trend analysis (recommended 3-5x chart timeframe)
ATR Period: Period for ATR calculation in SuperTrend (10-14 standard)
Multiplier: Distance from center band (2.5-3.5 for most markets)
Ribbon Width: Visual thickness of trend ribbon (0.2-0.5)
Core Parameters:
Lookback Period: Bars used to identify support/resistance (lower = more sensitive)
ATR Period: Bars for Average True Range calculation (14 is standard)
ATR Timeframe: Use higher timeframe ATR for smoother calculations on fast charts
Volume Multiplier: Required volume vs average (1.0 = average, 1.5 = 50% above average)
TP/SL:
SL Multiplier: Stop loss distance in ATR units (1.0-2.0 typical)
TP1 Multiplier: First target in ATR units (1.5-2.5 typical)
TP2 Multiplier: Second target in ATR units (2.0-3.5 typical)
Trailing Stop:
Enable: Activate dynamic trailing stop
Multiplier: Distance from current price in ATR units (0.8-1.5 typical)
Cooldown:
Enable: Prevent new signals after trade exit
Bars: Number of bars to wait before allowing next trade (higher on fast timeframes)
IMPORTANT NOTES
⚠️ Not a Holy Grail: No indicator is perfect. Pulsar is a tool that requires proper risk management, position sizing, and trading discipline.
⚠️ Backtest First: Test settings on historical data before live trading. Results vary by instrument, timeframe, and market conditions.
⚠️ Market Conditions Matter: Breakout systems perform best in trending markets. Consider reducing size or disabling during known choppy periods.
⚠️ Stop Loss is Mandatory: Always use the provided stop loss levels. Markets can move against you rapidly.
⚠️ Volume Data Required: This indicator requires volume data to function properly. It will display a warning if volume is unavailable.
⚠️ No Repainting: All multi-timeframe calls use non-repainting settings. What you see in real-time is what will be plotted historically.
TECHNICAL SPECIFICATIONS
Version: Pine Script v6
Type: Indicator (overlay = true)
Max Boxes: 500 (for zone visualization)
Max Lines: 500 (for TP/SL levels)
Max Labels: Unlimited (for annotations)
Repainting: None (uses lookahead = barmerge.lookahead_off)
COMPATIBLE INSTRUMENTS
Works best on liquid instruments with reliable volume data:
✅ Futures: NQ, MNQ, ES, MES, YM, MYM, RTY, M2K, CL, GC
✅ Forex: Major pairs (EUR/USD, GBP/USD, etc.)
✅ Stocks: Large-cap stocks with high volume
⚠️ Crypto: Works but requires higher ATR multipliers
❌ Low Volume Stocks: May produce unreliable signals
SUPPORT
For questions, suggestions, or to report issues, please comment below. I actively maintain this indicator and appreciate feedback from the community.
Enjoy trading with Pulsar! 🌟

AnchorPulse RWAP Universal ScalperWhat it is
AnchorPulse Scalper is an intraday indicator that reads price in real time through three ideas working together.
A live pivot engine that detects the current micro leg.
An Anchored Range Weighted Average Price that starts at each new leg or session.
An adaptive rhythm score that communicates a simple bias: Buy, Sell, or Wait.
The goal is clarity. You get one anchor line, soft bands that show stretch, discrete Buy and Sell marks, and a plain-language dashboard that says Trend, Phase, Bias, Momentum, Volatility, Stretch, ETA to next turn, and Regime. No external dependencies and no lookahead. It is designed for standard chart types on one to five minute timeframes across liquid symbols such as major FX, index futures, large cap stocks, and mainstream crypto pairs.
What makes it original
Most scalpers either track a fixed moving average or draw from a session VWAP. AnchorPulse does neither. The anchor resets at every new micro leg detected by a real time pivot engine that measures distance in units of ATR rather than in fixed points. This produces a responsive anchor that updates only when the market proves a leg has turned. On top of that, the rhythm timer keeps an average of how long legs usually last, so the indicator can treat the start and the end of a leg differently. Early in a leg it favors continuation signals. Late in a leg it watches for mean reversion. This mix of an ATR-based leg detector, a leg-anchored RWAP, and a rhythm aware bias is the core originality.
Plain explanation of the calculations
Pivot engine. While price travels up, the script tracks the highest high reached since the last pivot. If price pulls back from that extreme by at least a user defined fraction of ATR, the leg flips down. The reverse applies to down legs. The distance threshold is adaptive because ATR changes with volatility. A short cooldown in bars can prevent double flips on violent bars.
Anchored Range Weighted Average Price. From the first bar of each new leg the script accumulates a weighted average of the typical price, where the weight is the true range of each bar. The anchor can also reset at the start of a session and can ignore the very first session bar to avoid overweighting the open gap.
Progress and phase. The script measures how far price traveled from the last pivot relative to the reversal threshold. That is progress. At the same time it maintains an exponential average of leg duration in bars. The current leg age divided by that average is the age ratio. An age ratio below an adaptive early threshold means Early. Above an adaptive late threshold means Late. The thresholds drift with recent variability in leg length so they match the rhythm of the market.
Wick pressure and intrabar skew. Lower wick minus upper wick, normalized by ATR and smoothed, acts as tape pressure. The sign of close minus open, smoothed, is intrabar skew. They are combined into a compact momentum read.
Bands and stretch. The script computes the deviation of typical price from the anchor and builds soft bands around the anchor. Standard deviation is capped by a multiple of mean absolute error to avoid inflated bands just after a pivot.
Regime filter. You may optionally gate continuation entries when the higher timeframe EMA disagrees, or gate reversals when ADX shows strong trend.
Adaptive edge score. Progress and momentum are turned into percentile scores using a normal CDF of their rolling z scores. This yields a familiar zero to one hundred scale that is easier to read than raw values. Early in an up leg adds a small bonus to long bias. Early in a down leg adds a small bonus to short bias.
Gap cap. Signals are rejected if price is too far from the anchor. The cap is expressed as a fraction of price, which scales across symbols.
What you see on the chart
One white anchor line. Two transparent bands. Subtle green or orange background when a bias is active. Buy marks below bars and Sell marks above bars. Small triangles at pivots. Bar tint softly aligned with momentum. A compact table in the corner that tells you the state in plain language. On alert, a single JSON line can be sent to your alert channel with ticker, timeframe, trend, phase, bias, edge score, stretch, ETA in bars, and regime note.
How to use it in practice
Choose a liquid symbol and a one to five minute timeframe.
Keep the mode on Hybrid until you learn the personality of the market. If you notice long directional pushes, try Continuation mode. If you see frequent fades near the end of legs, try Reversal mode.
Read the table. Trend shows Up or Down according to the current leg. Phase shows Early, Mid, or Late from the rhythm timer. Bias shows Buy, Sell, or Wait once the signal rules and the gap cap are satisfied. Momentum reads Strong Up, Neutral, or Strong Down from wick pressure and skew. Volatility shows Calm, Average, or Wild relative to an ATR baseline. Stretch vs anchor prints the distance between close and the anchor as a percent of price. ETA shows how many bars remain to the average leg length if such a read is meaningful. Regime reflects the optional gate: None, HTF Up, HTF Down, Strong, or Soft.
Focus on the anchor. Continuation longs are stronger when price holds above the anchor in the first part of an up leg with positive momentum and adequate progress. Continuation shorts are the mirror case below the anchor. Reversal longs are stronger when a down leg is late, price crosses the anchor, and momentum flips positive. Reversal shorts are the mirror case in late up legs.
Respect the gap cap. When price is stretched far away from the anchor, skip signals and wait for re-alignment or a fresh leg.
Keep the chart clean. The script is designed to work on its own. If you add other tools, make sure they do not paint multiple backgrounds or heavy drawings that obscure the anchor and the bands.
Inputs explained with practical defaults
The script ships with sensible defaults and all inputs provide tooltips inside the indicator. The description here is included so traders who do not read code can still understand how to tune it.
Signal mode. Continuation uses early leg logic. Reversal uses late leg logic at anchor crosses. Hybrid allows both and lets the edge score decide.
ATR length and Pivot reversal in ATR. These govern flips. Shorter ATR and smaller reversal multiples yield faster turns and more signals. Longer and larger do the opposite. A middle ground such as ATR 50 with reversal 0.75 often reads well across liquid markets.
Rhythm smoothing length and Freeze bars after flip. The first sets how quickly the average leg length adapts. The second prevents double flips on wide bars. Values around 20 and 1 to 3 bars work well for most symbols.
Session hours, Session reset, and Skip first session bar. These are optional. Day sessions in equities can benefit from a reset and from skipping the first bar so the anchor is not dragged by the open gap. Round the session to your venue.
Wick pressure length and Intrabar skew length. They control how quickly the micro momentum reacts. Values between 6 and 12 for wick pressure and 4 to 10 for skew are common.
Early and Late thresholds and the Adaptive option. If you turn adaptation on, the thresholds drift with leg variability. The adaptiveness setting controls the strength of that drift.
Minimum progress and Maximum stretch vs anchor. The first ensures that continuation signals only occur once the leg moved a minimum distance from the last pivot. The second prevents chasing far from the anchor. As a rule, raise minimum progress when the market chops and reduce it on trend days. Keep stretch around one to two percent for many symbols, then adjust by product.
Regime filter. Higher timeframe EMA supports trend alignment. ADX supports a simple read on the strength of trend. Use one at a time or none, depending on your preference.
Adaptive scoring lookback. The percentile logic needs a modest window. Values near one hundred twenty bars tend to give stable ranks without lagging too much.
Band settings. Band length and width control the look of the soft channel around the anchor. The cap versus mean absolute error is there to keep the bands realistic just after flips.
Visual controls. Pick labels, triangles, or circles, and choose to mark only state changes if you prefer a very clean chart.
Why the dashboard uses plain language
Many traders prefer to reason in simple terms rather than in raw values. The table abstracts the math into natural categories such as Early versus Late, Calm versus Wild, or Strong Up versus Strong Down. The only numeric reads are Stretch and Edge score because these help in threshold decisions. Stretch is a percent of price so it scales across markets. Edge is a normalized score from zero to one hundred that reflects the combined progress, momentum, and phase. The table is intended to be the only element you need to glance at during a fast session once you learn the anchor and the band cues.
Design choices and integrity
No repaint. The script uses bar closes and standard Pine semantics with lookahead off in security calls. There are no offset tricks that move plotted values after the fact.
One background painter. Background tint is created by a single call to avoid vertical stripes.
Reset logic is explicit. The anchor resets at a pivot or at session start if that option is enabled. This is written to be transparent so you know why the anchor restarted.
Conservative defaults. Out of the box, the script is not tuned to over trade. It communicates bias rather than forcing entries.
Clean chart guidance. The tool is meant to be used on standard bars or candles. It is not intended for synthetic chart types such as Heikin Ashi, Renko, Kagi, Point and Figure, or Range for the purpose of signal generation.
How to read a few common situations
Breakout with strong follow through. Trend reads Up. Phase reads Early. Momentum reads Strong Up. Stretch sits inside the band. Bias shows Buy. This is the typical continuation long.
Extended push into exhaustion. Trend reads Up. Phase reads Late. Momentum cools. Stretch prints a high positive percent of price. Bias flips to Wait, sometimes to Sell after an anchor cross. This is the potential reversal short.
Mean reverting chop. Trend flips often. Phase hangs around Mid. Momentum flips sign frequently. Stretch hovers near zero. Bias often prints Wait. In this case you let the market speak and only act when the leg matures or when stretch spikes away from the anchor.
Trend day with strength. ADX filter reads Strong. Continuation is allowed. Reversal attempts are blocked. Bias favors the dominant direction.
Session open. If you selected a session reset and chose to skip the first bar, the anchor starts at the second bar and the first prints do not dominate the anchor.
Limits and realistic expectations
This indicator measures leg structure and micro pressure to suggest a bias. It is not a self-contained trading system. It does not size positions, pick stops, or set take profits. It does not promise accuracy or profits. In violent markets the pivot detector can flip and then flip back. Cooldown reduces this effect but cannot remove it. During news and illiquid hours the anchor can move very quickly. Wide slippage and spread can make any intraday approach impractical. These are standard realities of intraday trading and they also apply here.
Suggested workflows
Discretionary scalper. Keep the chart clean. Use the table to decide whether to engage, then work entries at the anchor or inside the band. Focus on position risk and a predefined stop level independent of the script.
Session specialist. If you trade a venue with strong sessions such as US equities or major FX sessions, enable the session reset. Many traders find the tool shines in the first two hours and the last hour of an active session.
Multi timeframe monitor. Keep AnchorPulse on one to five minutes and a simple higher timeframe EMA on a separate chart. If you prefer a single chart, switch the regime filter to HTF Trend and let the indicator handle it.
Alert driven workflow. Create alerts on Buy or Sell. The payload contains the essential context so you can log and review. Use the payload fields to build a small notebook of cases you like to take.
Why it is published as protected
The script contains original logic that relies on a compact set of calculations not commonly seen together. Publishing as protected keeps the logic intact while still giving the community full access through the Public Library.
Frequently asked questions
Does it repaint
No. The pivot flips on confirmed bars using ATR distance. The anchor, bands, and dashboard read from that state and do not shift after the bar closes.
What settings should I change first
Try the reversal distance in ATR and the minimum progress. These two govern how active or selective the tool becomes. If you see too many flips, raise the ATR multiple or the freeze bars. If you want faster action, lower them slightly.
What is a reasonable stretch cap
One to two percent of price is a useful starting point for many symbols. Thin products may need a larger cap. Extremely liquid products can often work with a smaller cap.
Should I use the regime filter
On days with persistent trend, the higher timeframe EMA filter or the ADX filter can help keep you with the flow. On rotational days, consider turning the filter off to allow more two sided action.
Can I use it on higher timeframes
The logic works on any timeframe, but the design and defaults target one to five minutes. If you go higher, adjust the ATR length, reversal distance, and rank lookback accordingly.
Can I combine it with volume
Yes. A simple volume filter that marks above average volume near the anchor can help you time entries. Keep the chart readable.
Risk notice and user responsibility
This indicator is a tool for research and education. It does not give investment advice, trade recommendations, or any guarantee of outcomes. All trading carries risk including the loss of capital. Past performance is not a reliable guide to future results. You are solely responsible for your trading decisions, for verifying that the indicator behaves as you expect on your data and platform settings, and for selecting appropriate risk controls such as position sizing, stops, and loss limits.
Summary
AnchorPulse Scalper is a concise way to read the market’s current leg, its anchor, and its rhythm. The pivot engine tells you direction. The leg-anchored RWAP shows where value sits for this micro move. The adaptive score simplifies momentum and progress into a familiar scale. The dashboard translates complex calculations into the plain words that scalpers actually use. If you prefer simple signals, enable alerts and let them flow into your log. If you prefer context, watch the anchor and bands as the leg evolves and let the rhythm guide your timing. Use it respectfully on a clean chart, stay realistic, and keep your own rules for risk.

Grothendieck-Teichmüller Geometric SynthesisDskyz's Grothendieck-Teichmüller Geometric Synthesis (GTGS)
THEORETICAL FOUNDATION: A SYMPHONY OF GEOMETRIES
The 🎓 GTGS is built upon a revolutionary premise: that market dynamics can be modeled as geometric and topological structures. While not a literal academic implementation—such a task would demand computational power far beyond current trading platforms—it leverages core ideas from advanced mathematical theories as powerful analogies and frameworks for its algorithms. Each component translates an abstract concept into a practical market calculation, distinguishing GTGS by identifying deeper structural patterns rather than relying on standard statistical measures.
1. Grothendieck-Teichmüller Theory: Deforming Market Structure
The Theory : Studies symmetries and deformations of geometric objects, focusing on the "absolute" structure of mathematical spaces.
Indicator Analogy : The calculate_grothendieck_field function models price action as a "deformation" from its immediate state. Using the nth root of price ratios (math.pow(price_ratio, 1.0/prime)), it measures market "shape" stretching or compression, revealing underlying tensions and potential shifts.
2. Topos Theory & Sheaf Cohomology: From Local to Global Patterns
The Theory : A framework for assembling local properties into a global picture, with cohomology measuring "obstructions" to consistency.
Indicator Analogy : The calculate_topos_coherence function uses sine waves (math.sin) to represent local price "sections." Summing these yields a "cohomology" value, quantifying price action consistency. High values indicate coherent trends; low values signal conflict and uncertainty.
3. Tropical Geometry: Simplifying Complexity
The Theory : Transforms complex multiplicative problems into simpler, additive, piecewise-linear ones using min(a, b) for addition and a + b for multiplication.
Indicator Analogy : The calculate_tropical_metric function applies tropical_add(a, b) => math.min(a, b) to identify the "lowest energy" state among recent price points, pinpointing critical support levels non-linearly.
4. Motivic Cohomology & Non-Commutative Geometry
The Theory : Studies deep arithmetic and quantum-like properties of geometric spaces.
Indicator Analogy : The motivic_rank and spectral_triple functions compute weighted sums of historical prices to capture market "arithmetic complexity" and "spectral signature." Higher values reflect structured, harmonic price movements.
5. Perfectoid Spaces & Homotopy Type Theory
The Theory : Abstract fields dealing with p-adic numbers and logical foundations of mathematics.
Indicator Analogy : The perfectoid_conv and type_coherence functions analyze price convergence and path identity, assessing the "fractal dust" of price differences and price path cohesion, adding fractal and logical analysis.
The Combination is Key : No single theory dominates. GTGS ’s Unified Field synthesizes all seven perspectives into a comprehensive score, ensuring signals reflect deep structural alignment across mathematical domains.
🎛️ INPUTS: CONFIGURING THE GEOMETRIC ENGINE
The GTGS offers a suite of customizable inputs, allowing traders to tailor its behavior to specific timeframes, market sectors, and trading styles. Below is a detailed breakdown of key input groups, their functionality, and optimization strategies, leveraging provided tooltips for precision.
Grothendieck-Teichmüller Theory Inputs
🧬 Deformation Depth (Absolute Galois) :
What It Is : Controls the depth of Galois group deformations analyzed in market structure.
How It Works : Measures price action deformations under automorphisms of the absolute Galois group, capturing market symmetries.
Optimization :
Higher Values (15-20) : Captures deeper symmetries, ideal for major trends in swing trading (4H-1D).
Lower Values (3-8) : Responsive to local deformations, suited for scalping (1-5min).
Timeframes :
Scalping (1-5min) : 3-6 for quick local shifts.
Day Trading (15min-1H) : 8-12 for balanced analysis.
Swing Trading (4H-1D) : 12-20 for deep structural trends.
Sectors :
Stocks : Use 8-12 for stable trends.
Crypto : 3-8 for volatile, short-term moves.
Forex : 12-15 for smooth, cyclical patterns.
Pro Tip : Increase in trending markets to filter noise; decrease in choppy markets for sensitivity.
🗼 Teichmüller Tower Height :
What It Is : Determines the height of the Teichmüller modular tower for hierarchical pattern detection.
How It Works : Builds modular levels to identify nested market patterns.
Optimization :
Higher Values (6-8) : Detects complex fractals, ideal for swing trading.
Lower Values (2-4) : Focuses on primary patterns, faster for scalping.
Timeframes :
Scalping : 2-3 for speed.
Day Trading : 4-5 for balanced patterns.
Swing Trading : 5-8 for deep fractals.
Sectors :
Indices : 5-8 for robust, long-term patterns.
Crypto : 2-4 for rapid shifts.
Commodities : 4-6 for cyclical trends.
Pro Tip : Higher towers reveal hidden fractals but may slow computation; adjust based on hardware.
🔢 Galois Prime Base :
What It Is : Sets the prime base for Galois field computations.
How It Works : Defines the field extension characteristic for market analysis.
Optimization :
Prime Characteristics :
2 : Binary markets (up/down).
3 : Ternary states (bull/bear/neutral).
5 : Pentagonal symmetry (Elliott waves).
7 : Heptagonal cycles (weekly patterns).
11,13,17,19 : Higher-order patterns.
Timeframes :
Scalping/Day Trading : 2 or 3 for simplicity.
Swing Trading : 5 or 7 for wave or cycle detection.
Sectors :
Forex : 5 for Elliott wave alignment.
Stocks : 7 for weekly cycle consistency.
Crypto : 3 for volatile state shifts.
Pro Tip : Use 7 for most markets; 5 for Elliott wave traders.
Topos Theory & Sheaf Cohomology Inputs
🏛️ Temporal Site Size :
What It Is : Defines the number of time points in the topological site.
How It Works : Sets the local neighborhood for sheaf computations, affecting cohomology smoothness.
Optimization :
Higher Values (30-50) : Smoother cohomology, better for trends in swing trading.
Lower Values (5-15) : Responsive, ideal for reversals in scalping.
Timeframes :
Scalping : 5-10 for quick responses.
Day Trading : 15-25 for balanced analysis.
Swing Trading : 25-50 for smooth trends.
Sectors :
Stocks : 25-35 for stable trends.
Crypto : 5-15 for volatility.
Forex : 20-30 for smooth cycles.
Pro Tip : Match site size to your average holding period in bars for optimal coherence.
📐 Sheaf Cohomology Degree :
What It Is : Sets the maximum degree of cohomology groups computed.
How It Works : Higher degrees capture complex topological obstructions.
Optimization :
Degree Meanings :
1 : Simple obstructions (basic support/resistance).
2 : Cohomological pairs (double tops/bottoms).
3 : Triple intersections (complex patterns).
4-5 : Higher-order structures (rare events).
Timeframes :
Scalping/Day Trading : 1-2 for simplicity.
Swing Trading : 3 for complex patterns.
Sectors :
Indices : 2-3 for robust patterns.
Crypto : 1-2 for rapid shifts.
Commodities : 3-4 for cyclical events.
Pro Tip : Degree 3 is optimal for most trading; higher degrees for research or rare event detection.
🌐 Grothendieck Topology :
What It Is : Chooses the Grothendieck topology for the site.
How It Works : Affects how local data integrates into global patterns.
Optimization :
Topology Characteristics :
Étale : Finest topology, captures local-global principles.
Nisnevich : A1-invariant, good for trends.
Zariski : Coarse but robust, filters noise.
Fpqc : Faithfully flat, highly sensitive.
Sectors :
Stocks : Zariski for stability.
Crypto : Étale for sensitivity.
Forex : Nisnevich for smooth trends.
Indices : Zariski for robustness.
Timeframes :
Scalping : Étale for precision.
Swing Trading : Nisnevich or Zariski for reliability.
Pro Tip : Start with Étale for precision; switch to Zariski in noisy markets.
Unified Field Configuration Inputs
⚛️ Field Coupling Constant :
What It Is : Sets the interaction strength between geometric components.
How It Works : Controls signal amplification in the unified field equation.
Optimization :
Higher Values (0.5-1.0) : Strong coupling, amplified signals for ranging markets.
Lower Values (0.001-0.1) : Subtle signals for trending markets.
Timeframes :
Scalping : 0.5-0.8 for quick, strong signals.
Swing Trading : 0.1-0.3 for trend confirmation.
Sectors :
Crypto : 0.5-1.0 for volatility.
Stocks : 0.1-0.3 for stability.
Forex : 0.3-0.5 for balance.
Pro Tip : Default 0.137 (fine structure constant) is a balanced starting point; adjust up in choppy markets.
📐 Geometric Weighting Scheme :
What It Is : Determines the framework for combining geometric components.
How It Works : Adjusts emphasis on different mathematical structures.
Optimization :
Scheme Characteristics :
Canonical : Equal weighting, balanced.
Derived : Emphasizes higher-order structures.
Motivic : Prioritizes arithmetic properties.
Spectral : Focuses on frequency domain.
Sectors :
Stocks : Canonical for balance.
Crypto : Spectral for volatility.
Forex : Derived for structured moves.
Indices : Motivic for arithmetic cycles.
Timeframes :
Day Trading : Canonical or Derived for flexibility.
Swing Trading : Motivic for long-term cycles.
Pro Tip : Start with Canonical; experiment with Spectral in volatile markets.
Dashboard and Visual Configuration Inputs
📋 Show Enhanced Dashboard, 📏 Size, 📍 Position :
What They Are : Control dashboard visibility, size, and placement.
How They Work : Display key metrics like Unified Field , Resonance , and Signal Quality .
Optimization :
Scalping : Small size, Bottom Right for minimal chart obstruction.
Swing Trading : Large size, Top Right for detailed analysis.
Sectors : Universal across markets; adjust size based on screen setup.
Pro Tip : Use Large for analysis, Small for live trading.
📐 Show Motivic Cohomology Bands, 🌊 Morphism Flow, 🔮 Future Projection, 🔷 Holographic Mesh, ⚛️ Spectral Flow :
What They Are : Toggle visual elements representing mathematical calculations.
How They Work : Provide intuitive representations of market dynamics.
Optimization :
Timeframes :
Scalping : Enable Morphism Flow and Spectral Flow for momentum.
Swing Trading : Enable all for comprehensive analysis.
Sectors :
Crypto : Emphasize Morphism Flow and Future Projection for volatility.
Stocks : Focus on Cohomology Bands for stable trends.
Pro Tip : Disable non-essential visuals in fast markets to reduce clutter.
🌫️ Field Transparency, 🔄 Web Recursion Depth, 🎨 Mesh Color Scheme :
What They Are : Adjust visual clarity, complexity, and color.
How They Work : Enhance interpretability of visual elements.
Optimization :
Transparency : 30-50 for balanced visibility; lower for analysis.
Recursion Depth : 6-8 for balanced detail; lower for older hardware.
Color Scheme :
Purple/Blue : Analytical focus.
Green/Orange : Trading momentum.
Pro Tip : Use Neon Purple for deep analysis; Neon Green for active trading.
⏱️ Minimum Bars Between Signals :
What It Is : Minimum number of bars required between consecutive signals.
How It Works : Prevents signal clustering by enforcing a cooldown period.
Optimization :
Higher Values (10-20) : Fewer signals, avoids whipsaws, suited for swing trading.
Lower Values (0-5) : More responsive, allows quick reversals, ideal for scalping.
Timeframes :
Scalping : 0-2 bars for rapid signals.
Day Trading : 3-5 bars for balance.
Swing Trading : 5-10 bars for stability.
Sectors :
Crypto : 0-3 for volatility.
Stocks : 5-10 for trend clarity.
Forex : 3-7 for cyclical moves.
Pro Tip : Increase in choppy markets to filter noise.
Hardcoded Parameters
Tropical, Motivic, Spectral, Perfectoid, Homotopy Inputs : Fixed to optimize performance but influence calculations (e.g., tropical_degree=4 for support levels, perfectoid_prime=5 for convergence).
Optimization : Experiment with codebase modifications if advanced customization is needed, but defaults are robust across markets.
🎨 ADVANCED VISUAL SYSTEM: TRADING IN A GEOMETRIC UNIVERSE
The GTTMTSF ’s visuals are direct representations of its mathematics, designed for intuitive and precise trading decisions.
Motivic Cohomology Bands :
What They Are : Dynamic bands ( H⁰ , H¹ , H² ) representing cohomological support/resistance.
Color & Meaning : Colors reflect energy levels ( H⁰ tightest, H² widest). Breaks into H¹ signal momentum; H² touches suggest reversals.
How to Trade : Use for stop-loss/profit-taking. Band bounces with Dashboard confirmation are high-probability setups.
Morphism Flow (Webbing) :
What It Is : White particle streams visualizing market momentum.
Interpretation : Dense flows indicate strong trends; sparse flows signal consolidation.
How to Trade : Follow dominant flow direction; new flows post-consolidation signal trend starts.
Future Projection Web (Fractal Grid) :
What It Is : Fibonacci-period fractal projections of support/resistance.
Color & Meaning : Three-layer lines (white shadow, glow, colored quantum) with labels showing price, topological class, anomaly strength (φ), resonance (ρ), and obstruction ( H¹ ). ⚡ marks extreme anomalies.
How to Trade : Target ⚡/● levels for entries/exits. High-anomaly levels with weakening Unified Field are reversal setups.
Holographic Mesh & Spectral Flow :
What They Are : Visuals of harmonic interference and spectral energy.
How to Trade : Bright mesh nodes or strong Spectral Flow warn of building pressure before price movement.
📊 THE GEOMETRIC DASHBOARD: YOUR MISSION CONTROL
The Dashboard translates complex mathematics into actionable intelligence.
Unified Field & Signals :
FIELD : Master value (-10 to +10), synthesizing all geometric components. Extreme readings (>5 or <-5) signal structural limits, often preceding reversals or continuations.
RESONANCE : Measures harmony between geometric field and price-volume momentum. Positive amplifies bullish moves; negative amplifies bearish moves.
SIGNAL QUALITY : Confidence meter rating alignment. Trade only STRONG or EXCEPTIONAL signals for high-probability setups.
Geometric Components :
What They Are : Breakdown of seven mathematical engines.
How to Use : Watch for convergence. A strong Unified Field is reliable when components (e.g., Grothendieck , Topos , Motivic ) align. Divergence warns of trend weakening.
Signal Performance :
What It Is : Tracks indicator signal performance.
How to Use : Assesses real-time performance to build confidence and understand system behavior.
🚀 DEVELOPMENT & UNIQUENESS: BEYOND CONVENTIONAL ANALYSIS
The GTTMTSF was developed to analyze markets as evolving geometric objects, not statistical time-series.
Why This Is Unlike Anything Else :
Theoretical Depth : Uses geometry and topology, identifying patterns invisible to statistical tools.
Holistic Synthesis : Integrates seven deep mathematical frameworks into a cohesive Unified Field .
Creative Implementation : Translates PhD-level mathematics into functional Pine Script , blending theory and practice.
Immersive Visualization : Transforms charts into dynamic geometric landscapes for intuitive market understanding.
The GTTMTSF is more than an indicator; it’s a new lens for viewing markets, for traders seeking deeper insight into hidden order within chaos.
" Where there is matter, there is geometry. " - Johannes Kepler
— Dskyz , Trade with insight. Trade with anticipation.

BlackScrum Swing Boxes 1/2/3 After seeing influencers selling their indicator suite's online, I decided to start making replicas of them, maybe mine are better, maybe they are worse. I use them in my day to day trading and they help me make money, hopefully they help you make money.
Not financial advice, Do Your Own Research.
Everything provided without warranty or liability. If you stuff up, learn from it, get better, we all make mistakes.
// BlackScrum — 1/2/3-Bar Swing Boxes (auto timeframe)
//
// DESCRIPTION
// This indicator displays three swing-direction boxes (1B, 2B, 3B) in the top-right corner of the chart.
// The boxes automatically adapt to the chart's timeframe (15m, 1H, 4H, 1D, etc.).
// Each box represents the direction of the most recently confirmed swing pivot:
// • 1B → 1-bar swing (fastest, most sensitive)
// • 2B → 2-bar swing (medium confirmation)
// • 3B → 3-bar swing (slowest, strongest confirmation)
//
// COLORS
// • GREEN = last confirmed swing pivot was a higher low (up swing)
// • RED = last confirmed swing pivot was a lower high (down swing)
// • GREY = no clear swing yet (fresh/transition area)
//
// CONFLUENCE
// • ALL GREEN = bullish alignment across 1B, 2B, 3B → strong trend continuation signal
// • ALL RED = bearish alignment across all three → strong downtrend continuation signal
//
// HOW TO USE (TRADEPLAY)
//
// 1) ENTRIES
// • Aggressive entry → enter when ALL GREEN prints on your timeframe.
// • Safer pullback entry → wait for 1B to briefly turn red during a green 2B/3B,
// then flip back to green. Enter on the re-flip.
// • Multi-timeframe filter:
// Take longs only when higher TF (e.g., 1H/4H) boxes are at least neutral-to-green.
//
// 2) EXITS
// • Weakness exit → when 1B flips against your position while 2B is neutral/red.
// • Full exit → when ALL RED prints.
// • Time stop → if price hasn’t moved after several bars of your execution timeframe.
//
// 3) STOP-LOSS / RISK
// • Place stops beyond the latest opposite swing used by 2B or 3B.
// • Add 0.5–1× ATR buffer if your market has stop-hunt volatility.
// • Always size position based on the distance to the swing stop.
//
// 4) WHEN TO IGNORE SIGNALS
// • Chop zones → 1B flipping repeatedly while 2B/3B disagree.
// • News candles → wait for pivots to confirm on the *closed* bar.
//
// 5) USING WITH OTHER TOOLS
// • With a trend ribbon (e.g., Larsson-style):
// Only take ALL GREEN longs when the ribbon is UP, and ALL RED shorts when ribbon is DOWN.
// • With a Fear & Greed index:
// Prefer longs when F&G > 60,
// Avoid longs when F&G < 40 unless countertrend scalping.
//
// 6) TIMEFRAME GUIDANCE
// • Scalping: 5m / 15m, confirmed by 1H or 4H boxes.
// • Swinging: 1H / 4H with daily filter.
// • Positioning: 1D with weekly confirmation.
//
// 7) INTERPRETATION CHEATSHEET
// • 1B green, 2B grey, 3B red → short-term bounce inside higher timeframe downtrend.
// • 1B/2B green, 3B grey → early trend reversal forming.
// • All grey → fresh swing area; wait for direction.
//
// 8) CUSTOMIZATION
// • len1 / len2 / len3 control sensitivity (higher = slower & cleaner).
// • Can add a timeframe header box (e.g., “15m / 4H / 1D”).
// • Can add a multi-timeframe grid (e.g., 15m | 1H | 4H | 1D each with 1B/2B/3B).
//
// ====================================================================================================

RSI 3 Time FrameRSI 3 Time Frames Indicator
Overview
The RSI 3 Time Frames Indicator is designed to provide traders with a comprehensive view of the Relative Strength Index (RSI) across three different timeframes: Ripple (short-term), Wave (medium-term), and Tide (long-term). By combining insights from multiple timeframes on a single chart, traders can identify momentum, overbought/oversold conditions, and confluence zones for better decision-making.
This indicator is highly customizable, enabling you to adjust RSI timeframes, line colors, thickness, and reference levels such as oversold/overbought areas.
Features
Multi-Timeframe RSI Analysis:
Ripple RSI: Captures short-term momentum (default: 5-minute RSI) for quick entries and scalping.
Wave RSI: Provides medium-term RSI perspective (default: 15-minute RSI) for day trading setups.
Tide RSI: Gives broader trends and momentum shifts (default: 60-minute RSI) suitable for swing trading.
Key RSI Reference Levels:
Horizontal lines show critical RSI levels to help traders interpret conditions:
Oversold Zone:
20 (Oversold Extreme) → Green dotted line.
30 (Oversold) → Green dotted line.
Neutral Zone:
40 (Neutral Low) → Orange dotted line.
50 (Midpoint) → Black dotted line.
60 (Neutral High) → Orange dotted line.
Overbought Zone:
70 (Overbought) → Red dotted line.
80 (Overbought Extreme) → Red dotted line.
Customizable Options:
Adjust RSI line color, width, and timeframes to fit your trading needs.
Customize horizontal level line colors and styles (dotted, dashed, or solid).
Easy-to-Interpret Design:
All RSI lines and reference levels are visualized clearly to help you identify overbought/oversold zones, neutral levels, and overall market momentum across multiple perspectives.
Recommended Use Cases
Scalping:
Use Ripple RSI (default: 5-minute timeframe) for short-term insights into momentum-driven setups.
Day Trading:
Use Wave RSI (default: 15-minute timeframe) to analyze medium-term trends and spot entries/exits.
Swing Trading:
Use Tide RSI (default: 60-minute timeframe) for longer-term momentum shifts and confluence zones.
Multi-Timeframe Confirmation :
Look for alignment among RSI values across Ripple, Wave, and Tide to increase confidence in your trades.
How to Use the RSI 3 Time Frames Indicator
Add the Indicator to Your Chart: Import the RSI 3 Time Frames Indicator into TradingView.
Customize Settings:
Choose Ripple, Wave, and Tide RSI timeframes according to your strategy (e.g., 5-minute for short-term, 15-minute for medium-term).
Modify line colors, styles, and thickness for better clarity.
Enable/disable RSI lines or reference levels based on preference.
Interpret RSI Values Across Timeframes:
Identify overbought levels (above 70) for potential reversals.
Spot oversold levels (below 30) for buying opportunities.
Use the neutral midpoint (50) for balanced momentum, indicating neither buyers nor sellers dominate.
Combine with Other Tools:
Enhance your trading strategy by using RSI signals with price action tools like support/resistance zones, trendlines, and candlestick patterns.
Example Scenario
Let’s say you’re trading Bitcoin (BTC/USD):
Ripple RSI shows momentum building but nearing overbought (above 70).
Wave RSI confirms shorter momentum trends (above 60).
Tide RSI shows divergence as the longer timeframe RSI is falling toward oversold (below 40).
This alignment across timeframes helps you make informed decisions, such as waiting for Ripple RSI to cool off before entering a longer-term trade based on the Tide RSI oversold condition.
Disclaimer
The RSI 3 Time Frames Indicator is provided for educational and informational purposes only. It is not intended as financial advice or as a definitive trading signal. This tool should not be used in isolation for decision-making. Trading is inherently risky, and while RSI can offer valuable insights into market trends, traders should use proper risk management strategies and include other tools such as volume-based indicators, price action, fundamental research, and macroeconomic analysis in their decision-making process.
Always test any new strategies in a simulated or paper trading environment before applying them to real markets. Remember to consult with a licensed financial professional if you’re unsure whether trading is suitable for your financial situation.
Key Benefits
Enhanced flexibility with customizable RSI settings.
Clear visualization of momentum across short, medium, and long-term timeframes.
Helps traders avoid tunnel vision by providing a multi-timeframe perspective.
Final Note
The RSI 3 Time Frames Indicator is a powerful, easy-to-use tool for traders who want to leverage RSI across multiple timeframes to pinpoint high-probability setups. Customize the settings based on your strategy and use this as a companion tool for your overall trading system.
We hope you enjoy using this indicator to improve your trading and analysis! Happy trading! 😊

Clean Multi-Indicator Alignment System
Overview
A sophisticated multi-indicator alignment system designed for 24/7 trading across all markets, with pure signal-based exits and no time restrictions. Perfect for futures, forex, and crypto markets that operate around the clock.
Key Features
🎯 Multi-Indicator Confluence System
EMA Cross Strategy: Fast EMA (5) and Slow EMA (10) for precise trend direction
VWAP Integration: Institution-level price positioning analysis
RSI Momentum: 7-period RSI for momentum confirmation and reversal detection
MACD Signals: Optimized 8/17/5 configuration for scalping responsiveness
Volume Confirmation: Customizable volume multiplier (default 1.6x) for signal validation
🚀 Advanced Entry Logic
Initial Full Alignment: Requires all 5 indicators + volume confirmation
Smart Continuation Entries: EMA9 pullback entries when trend momentum remains intact
Flexible Time Controls: Optional session filtering or 24/7 operation
🎪 Pure Signal-Based Exits
No Forced Closes: Positions exit only on technical signal reversals
Dual Exit Conditions: EMA9 breakdown + RSI flip OR MACD cross + EMA20 breakdown
Trend Following: Allows profitable trends to run their full course
Perfect for Swing Scalping: Ideal for multi-session position holding
📊 Visual Interface
Real-Time Status Dashboard: Live alignment monitoring for all indicators
Color-Coded Candles: Instant visual confirmation of entry/exit signals
Clean Chart Display: Toggle-able EMAs and VWAP with professional styling
Signal Differentiation: Clear labels for entries, X-crosses for exits
🔔 Alert System
Entry Notifications: Separate alerts for buy/sell signals
Exit Warnings: Technical breakdown alerts for position management
Mobile Ready: Push notifications to TradingView mobile app
Market Applications
Perfect For:
Gold Futures (GC): 24-hour precious metals trading
NASDAQ Futures (NQ): High-volatility index scalping
Forex Markets: Currency pairs with continuous operation
Crypto Trading: 24/7 cryptocurrency momentum plays
Energy Futures: Oil, gas, and commodity swing trades
Optimal Timeframes:
1-5 Minutes: Ultra-fast scalping during high volatility
5-15 Minutes: Balanced approach for most markets
15-30 Minutes: Swing scalping for trend following
🧠 Smart Position Management
Tracks implied position direction
Prevents conflicting signals
Allows trend continuation entries
State-aware exit logic
⚡ Scalping Optimized
Fast-reacting indicators with shorter periods
Volume-based confirmation reduces false signals
Clean entry/exit visualization
Minimal lag for time-sensitive trades
Configuration Options
All parameters fully customizable:
EMA Lengths: Adjustable from 1-30 periods
RSI Period: 1-14 range for different market conditions
MACD Settings: Fast (1-15), Slow (1-30), Signal (1-10)
Volume Confirmation: 0.5-5.0x multiplier range
Visual Preferences: Colors, displays, and table options
Risk Management Features
Clear visual exit signals prevent emotion-based decisions
Volume confirmation reduces false breakouts
Multi-indicator confluence improves signal quality
Optional time filtering for session-specific strategies
Best Use Cases
Futures Scalping: NQ, ES, GC during active sessions
Forex Swing Trading: Major pairs during overlap periods
Crypto Momentum: Bitcoin, Ethereum trend following
24/7 Automated Systems: Algorithmic trading implementation
Multi-Market Scanning: Portfolio-wide signal monitoring
