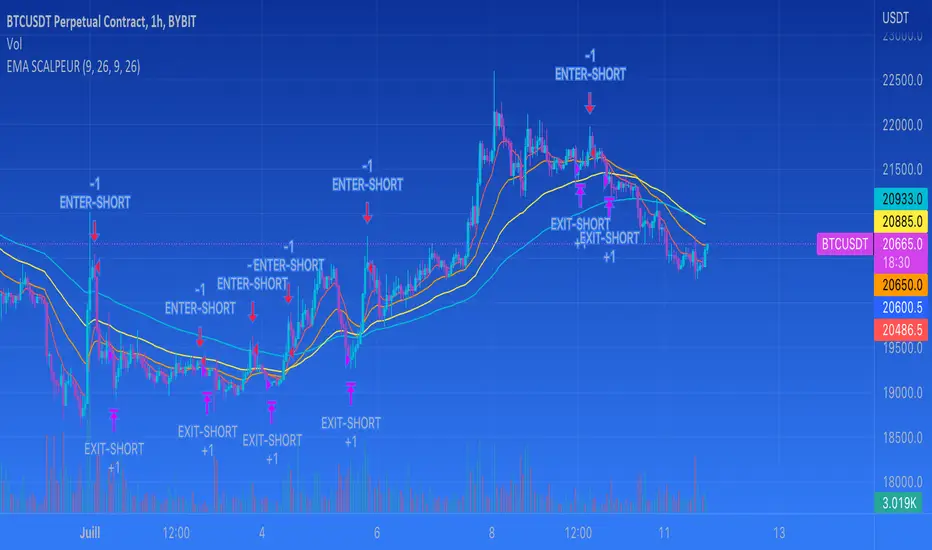
EMA SCALPEUR SHORTI'm trying to find the best EMA's for scalpingm you are able to choose 2 differents EMAs for your enter and 2 differents EMAs for you exit. It's putting entry and exit on the graphStrategi Pine Script®oleh ElPonzito35
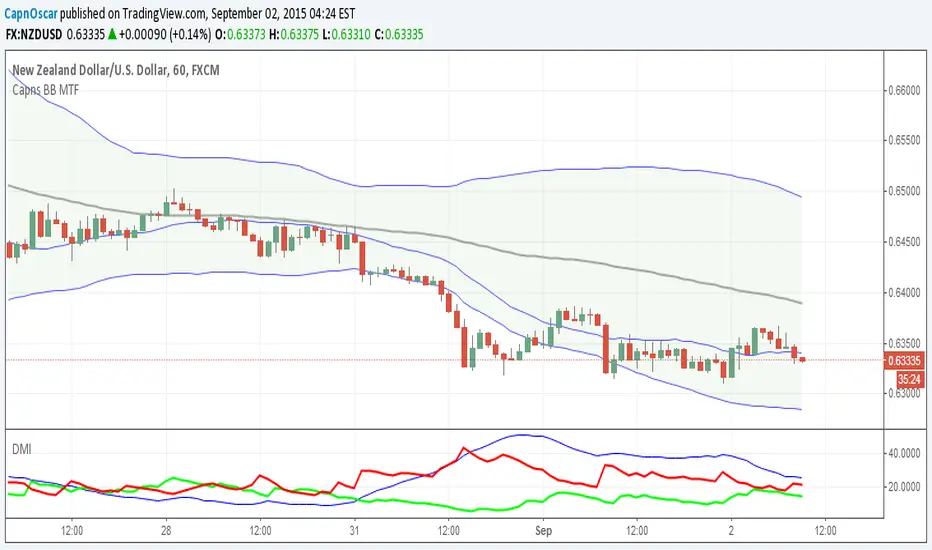
Capns Bollinger Bands MTF This Simple Script display higher time frame Bollinger Band on current resolution . Etc : On 1 Minutes chart BB Band is 5 Minutes Band. I use this code on my pc for scalping...Hope You like the ideaPenunjuk Pine Script®oleh CapnOscar33353
Unified Field: Clean FVG + Session POCTry it free. No guarantees. I find it useful for scalping. My ai wrote the code for it albeit, my idea. : )Penunjuk Pine Script®oleh johnkling3002
0DTE Strategy0DTE Strategy - Quick Guide WHAT IT DOES: Automated indicator for 0DTE SPY options scalping. Shows exact trading windows, entry signals, and market conditions in real-time. SETUP: 1. Apply to SPY chart (use 30-second timeframe for entries) 2. Settings > " USI:TICK Settings" > change symbol if "USI:TICK" doesn't work (try: USI:TICK , TICK, or NYSE:TICK) 3. Adjust colors if needed for your chart background HOW TO USE: TRADING WINDOWS (Color-coded backgrounds): - 9:35-9:50 AM (GREEN) = Trade 1 - Morning Impulse - 10:00-10:20 AM (BLUE) = Trade 2 - Trend Confirmation - 11:00 AM-3:30 PM (RED) = DEATH ZONE - Stay Cash, No Trading - 3:45-4:00 PM (PURPLE) = MOC Window - Check imbalance data ENTRY SIGNALS: - BUY (green triangle) = Price > VWAP + 9EMA + USI:TICK > +600 during active window - SELL (red triangle) = Price < VWAP + 9EMA + USI:TICK < -600 during active window - Signals stay active until opposite signal appears (no spam) DASHBOARD (Top Right): - Gap = Shows if gapping up/down vs yesterday's close - Window = Current trading window status - USI:TICK = Live NYSE TICK value (green >600, red <-600) - 5-Min Trend = Higher timeframe trend direction - Signal State = Current active signal (BUY/SELL/NEUTRAL) KEY LEVELS (Horizontal lines at market open): - PMH (green) = Pre-market high - acts as resistance - PML (red) = Pre-market low - acts as support - PDC (gray) = Previous day close - gap reference STRATEGY: 1. Before 9:30: Watch gap direction and pre-market levels 2. 9:35-9:50: Wait for BUY/SELL signal in Trade 1 window 3. Entry: Take signal when all conditions align (VWAP + EMA + TICK) 4. Exit: Target +$50 or use 20% hard stop per document rules 5. 11:00-3:30: Stay cash (Death Zone) 6. 3:45-4:00: MOC window (check NYSE imbalance data separately) BEST PRACTICES: - Use on 30-second chart for precise entries - Check 5-minute chart to confirm trend alignment - Only trade during colored window backgrounds - Follow the 4-bullet risk management from original guide - Dashboard shows "HOLD CALLS" or "HOLD PUTS" when signal is active IMPORTANT: This is a signal tool, not a full trading system. You must still apply proper position sizing, risk management, and verify MOC imbalances externally.Penunjuk Pine Script®oleh Kingsway139Telah dikemas kini 3
XAU 15m Impulse + Golden Pocket + TP/SL1) What the indicator does This tool automatically detects the latest confirmed impulse move on the 15‑minute timeframe, regardless of what timeframe you’re currently viewing (2m, 5m, 15m, etc.). An “impulse” here means: a confirmed pivot‑to‑pivot movement that is large enough (based on ATR × minimum multiplier) and clearly directional (UP or DOWN) From that impulse the script automatically draws: Golden Pocket retracement zone (0.618–0.65) SL level (0.855 retracement) TP1 at 0.0 (origin of impulse) TP2 at –0.382 extension (continuation target) 2) What you see on the chart Golden Pocket (GP) zone Displayed as a dark orange box between 0.618 and 0.65. Framed by dashed orange lines for clear visibility. Automatically updates when a new impulse forms. SL, TP1, TP2 lines SL (0.855 retracement): red line TP1 (0.0): lime-green line TP2 (–0.382 extension): darker green line Auto‑extended far into the future for planning trades. Labels “GP 0.618‑0.65” “TP1 (0.0)” “TP2 (‑0.382)” “SL (0.855)” These appear at the far right of your chart for clarity. 3) How the impulse is detected The script constantly watches 15m pivots: Pivot Low → Pivot High forms a potential UP impulse Pivot High → Pivot Low forms a potential DOWN impulse A swing becomes a valid impulse only when: It is a confirmed pivot It is big enough (range ≥ ATR × minAtrMult) It has correct pivot direction (low→high or high→low) Only the most recent valid impulse is used. 4) How to use it for trading Long setup (UP impulse) Identify the UP impulse box on the chart Price retraces into the orange GP zone (0.618–0.65) Watch for: rejection candles liquidity spikes your LTF scalping model (EMA 9/21) Enter long from GP → target: TP1 = 0.0 (end of impulse) TP2 = –0.382 (extension above the impulse high) Stop‑loss: SL = 0.855 retracement (red line) Short setup (DOWN impulse) The exact mirror: GP zone above price between 0.618–0.65 TP1 at the impulse low TP2 below (–0.382 extension) SL higher at 0.855 5) Why these levels matter Golden Pocket 0.618–0.65 The most commonly respected Fibonacci retracement cluster Preferred by institutional algo models and liquidity traders High‑probability reversal zone SL at 0.855 retracement Last “deep retracement” before a trend is considered broken Used by many professional trade‑management models Keeps SL outside common stop‑hunt zones TP1 at 0.0 Logical first target: retest of impulse origin Safe, high‑probability take‑profit TP2 at –0.382 Measures continuation strength Great extended target for trending days Works particularly well on gold (XAUUSD) 6) When NOT to use signals Avoid entries when: Trend is extremely weak or flat Major news events are hitting soon Price is consolidating above/below the GP zone without reaction A new impulse has not yet been formed (indicator looks “gray”) 7) Best way to combine it with your scalping model Your scalping system (EMA 9/21 pullback + BOS + volume) works perfectly with this: Ideal long confluence 15m impulse is UP Price retraces to GP zone On 2m/5m: EMA9 > EMA21 Reclaim EMA9 BOS UP Volume confirmation Enter → TP1 / TP2 The GP acts as your HTF premium discount zone, and your entries are timed on LTF momentum structure. 8) Default settings reference Impulse timeframe: 15m Pivot size: 3×3 Min impulse size: ATR(14) × 1.2 Extend lines: 500 bars GP opacity: 60 (dark orange)Penunjuk Pine Script®oleh lucinka_krchlikova5
AMT Institutional Model v2What This Indicator Does This indicator implements Fabio Valentini's Auction Market Theory (AMT) model — the same framework used by a verified World Cup Trading Championship competitor who achieved 218% audited returns in a single competition year. The core principle is simple: The market is an auction. It moves between two states — Balance (choppy, no edge) and Imbalance (trending, tradeable). Most traders lose because they trade inside balance. This indicator tells you when to sit out and when conditions are aligned for entry. It is a MODEL, not a strategy. It does not give buy/sell signals. It gives you the 3 conditions Valentini requires before any trade, and visually shows you when all 3 align. The 3 Conditions (ALL Must Be True Before Entry) Valentini's rule: "If even one is missing, you stay flat." #ConditionWhat the indicator shows1Market State — Is the market OUT of balance?Background color: Yellow = Balance (DO NOT TRADE). Blue/Red = Imbalance (OK to look)2Location — Is price at a meaningful level?LVN lines (magenta), Support/Resistance (green/red dashes), HVN (yellow), POC (orange)3Aggression — Are large participants executing?Blue circles below bar = Buyer aggression. Red circles above bar = Seller aggression When all 3 align, a green diamond (bull) or red diamond (bear) appears. This is the confluence signal — the premium setup. How To Read The Chart — Step by Step STEP 1 — Check the Balance Box (yellow dashed rectangle) This is the Value Area where 70% of volume was traded. Think of it as a "no-fly zone." Price INSIDE the box → Info table says "Inside VA - Skip" → Do nothing Price OUTSIDE the box → Now you can start looking for setups Valentini: "Market is usually in balance. That is why traders take a streak of stop-losses." The Balance Box keeps you out of the chop. STEP 2 — Check the Background Color 🟡 Yellow tint = Balance. Market is compressed. Stay flat. 🔵 Blue tint = Imbalance Bullish. Trend is up. Look for longs only. 🔴 Red tint = Imbalance Bearish. Trend is down. Look for shorts only. You need BOTH: price outside the Balance Box AND background showing Imbalance. STEP 3 — Find Your Level Look for price approaching one of these levels: LVN (magenta dashed) — Low Volume Nodes. Price rejected here before and will likely react again. These are Valentini's primary entry zones. When price revisits an LVN, it either rips through (continuation) or bounces (reversal). Wait for aggression to confirm which one. HVN (yellow solid) — High Volume Nodes. Price accepted here = consolidation zones. Good for targets, not entries. POC (orange thick) — Point of Control. Highest volume price = "fair value." Strong magnet. Good for mean-reversion targets. 30m S/R (green/red dashed) — Auction pivot structure from the 30-minute timeframe. Weekly/Daily/4H levels — Institutional reference levels. Confluence of multiple levels = stronger zone. Fibonacci levels — Labeled with source timeframe (D = Daily, W = Weekly) so you always know where the level comes from. STEP 4 — Wait for Aggression Do NOT enter just because price is at a level. Wait for the circles (bubbles): 🔵 Blue circle below bar = Buyer aggression (volume spike + bullish close) 🔴 Red circle above bar = Seller aggression (volume spike + bearish close) Circle size = intensity (small → normal → large = 2x → 3.5x → 5x+ volume) Valentini: "When there is direction, location, and aggression — your ability to READ is 100%." Entry Checklist (Long Example) ✅ Background is blue (Imbalance Bullish) ✅ Price is outside the Balance Box (above VAH or pulled back below VAL) ✅ Price is at or near an LVN, Support level, or Fibonacci level ✅ A blue circle appears below the bar (buyer aggression confirmed) ✅ 30-min trend line is blue (uptrend structure) Enter long. Stop below the LVN / support level. For shorts, mirror everything: red background, near resistance/LVN, red circle above bar, red trend line. Exit Rules Exit TypeWhenPrimary targetThe POC (orange line). Valentini: "Target the previous balance POC — 70% of the time, price reverses from it."Secondary targetThe next HVN (yellow line). Price tends to slow down and consolidate at HVNs. Take partial profits here.Structural targetThe next major Weekly/Daily level or Fibonacci level in the direction of your trade.Failed auction exitIf you're long and an X cross appears above your bar — this means aggressive buyers failed. The sellers won. Close immediately.Re-entry of Balance BoxIf price re-enters the Value Area after breaking out, the breakout may have failed. Tighten stop or exit. This is Valentini's Mean Reversion Model — the snap-back.Opposite aggressionLarge red circles appearing in your long trade = institutional selling. Reduce size or exit. What Each Module Does Module A — 30-Min Trend (blue/red step-line) Auction-based trend structure from 30-minute Higher-Highs/Higher-Lows. Not a moving average — this is structural. Module B — 30-Min S/R (green/red dashed) Pivot-based support and resistance from 30-minute auction structure. Sensitivity setting controls how many levels appear. Module C — Aggression Bubbles (circles + X crosses) Volume spike detection with directional body filter. 3 size tiers. X crosses mark failed auctions — when aggression fails and price reverses. Module D — MTF Levels (colored horizontal lines) Weekly, Daily, 4H, Hourly OHLC levels + Daily/Weekly Fibonacci retracements (labeled with source TF) + 20/50 SMA + Psychological round numbers. All line colors and widths fully customizable. Module E — Balance/Imbalance (background color) ATR compression ratio detects whether market is ranging or trending. Yellow = stay out. Blue/Red = conditions forming. Module F — Volume Profile (HVN/LVN/POC/Balance Box) Bin-based volume distribution over configurable lookback. Same methodology as ATAS, Sierra Chart, and TradingView's own SVP. Draws the Value Area box (skip trades inside), POC, and all significant volume nodes. Settings Guide Sensitivity — The single most important setting. Low = Strict. Fewer levels, fewer bubbles, only the strongest signals. For experienced traders who want a clean chart. Medium = Balanced. Recommended default. High = Sensitive. More signals, catches weaker setups. Good for learning or scalping. Futures vs ETF — Futures (NQ/ES/YM) have concentrated RTH volume so lower multipliers work. ETFs (SPY/QQQ) need higher thresholds to filter dark-pool noise. Label Mode — "Detailed" for learning, "Short" for clean charts once you know the levels. Label Size — Auto/Tiny/Small/Normal/Large. All labels respect this setting. Important Limitations ⚠️ No true order flow. TradingView does not provide tick-by-tick data, DOM, or executed vs. limit order differentiation. Aggression bubbles are a volume-spike proxy, not true order flow. For real order flow, use platforms like Bookmap, ATAS, or Sierra Chart alongside this indicator. ⚠️ Volume profile is approximated. Each bar's volume is proportionally distributed across its price range. Real volume-at-price requires tick data. This is the standard approximation used by all Pine Script volume profile implementations. ⚠️ This is a model, not a strategy. It shows conditions. You make the decision. No indicator replaces screen time and discretion. Alerts Available (12 total, all configurable ON/OFF) Bull Confluence | Bear Confluence | Failed Buy Auction | Failed Sell Auction | Huge Buy Volume (5x+) | Huge Sell Volume (5x+) | Balance/Imbalance Shift | 30-Min Trend Change | Any Aggression | Price at Key Level | Price Exits Value Area | Price at POC Built for NQ/ES futures day trading. Works on any liquid instrument with volume data. Not financial advice. Penunjuk Pine Script®oleh Fu3k_824
Custom Auto Fibo (Lines)Simple Fibo lines that show only 1 and 0 (Thick black lines) levels and 0.382 and 0.618 levels in green. Mostly useful for scalping. Use with EMA-8 and RSI trendline.Penunjuk Pine Script®oleh srikarkav21
DafeRLMLLibDafeRLMLLib: The Reinforcement Learning & Machine Learning Engine This is not an indicator. This is an artificial intelligence. A state-based, self-learning engine designed to bring the power of professional quantitative finance to the Pine Script ecosystem. Welcome to the next frontier of trading analysis. █ CHAPTER 1: THE PHILOSOPHY - FROM STATIC RULES TO DYNAMIC LEARNING Technical analysis has, for a century, been a discipline of static, human-defined rules. "If RSI is below 30, then buy." "If the 50 EMA crosses the 200 EMA, then sell." These are fixed heuristics. They are brittle. They fail to adapt to the market's ever-changing personality—its shifts between trend and range, high and low volatility, risk-on and risk-off sentiment. An indicator built on static rules is an automaton, destined to fail when the environment it was designed for inevitably changes. The DafeRLMLLib was created to shatter this paradigm. It is not a tool with fixed rules; it is a framework for discovering optimal rules. It is a true Reinforcement Learning (RL) and Machine Learning (ML) engine, built from the ground up in Pine Script. Its purpose is not to follow a pre-programmed strategy, but to learn a strategy through trial, error, and feedback. This library provides a complete, professional-grade toolkit for developers to build indicators that think, adapt, and evolve. It observes the market state, selects an action, receives a reward signal based on the outcome, and updates its internal "brain" to improve its future decisions. This is not just a step forward; it is a quantum leap into the future of on-chart intelligence. █ CHAPTER 2: THE CORE INNOVATIONS - WHAT MAKES THIS A TRUE ML ENGINE? This library is not a collection of simple moving averages labeled as "AI." It is a suite of genuine, academically recognized machine learning algorithms, adapted for the unique constraints and opportunities of the Pine Script environment. Multi-Algorithm Architecture: You are not locked into one learning model. The library provides a choice of powerful RL algorithms: Q-Learning with TD(λ) Eligibility Traces: A classic, robust algorithm for learning state-action values. We've enhanced it with eligibility traces (Lambda), allowing the agent to more efficiently assign credit or blame to a sequence of past actions, dramatically speeding up the learning process. REINFORCE Policy Gradient with Baseline: A more advanced method that directly learns a "policy"—a probability distribution over actions—instead of just values. The baseline helps to stabilize learning by reducing variance. Actor-Critic Architecture: The state-of-the-art. This hybrid model combines the best of both worlds. The "Actor" (the policy) decides what to do, and the "Critic" (the value function) evaluates how good that action was. The Critic's feedback is then used to directly improve the Actor's decisions. Prioritized Experience Replay: Like a human, the AI learns more from surprising or significant events. Instead of learning from experiences in a simple chronological order, the library stores them in a ReplayBuffer. It then replays these memories to the learning algorithms, prioritizing experiences that resulted in a large prediction error. This makes learning incredibly efficient. Meta-Learning & Self-Tuning: An AI that cannot learn how to learn is still a dumb machine. The MetaState module is a meta-learning layer that monitors the agent's own performance over time. If it detects that performance is degrading, it will automatically increase the learning rate ("Synaptic Plasticity"). If performance is improving, it will decrease the learning rate to stabilize the learned strategy. It tunes its own hyperparameters. Catastrophic Forgetting Prevention: A common failure mode for simple neural networks is "catastrophic forgetting," where learning a new task completely erases knowledge of a previous one. This library includes mechanisms like soft_reset and L2 regularization to prevent the agent's learned weights from exploding or being wiped out by a single bad run of trades, ensuring more stable, long-term learning. The Universal Socket Interface: How does the AI "see" the market? Through DataSockets. This brilliant, extensible interface allows a developer to connect any data series—an RSI, a volume metric, a volatility reading, a custom calculation—to the AI's "brain." Each socket normalizes its input, tracks its own statistics, and feeds into the state-building process. This makes the library universally adaptable to any trading idea. █ CHAPTER 3: A DUAL-PURPOSE FRAMEWORK - MODES OF OPERATION This library is a foundational component of the DAFE AI ecosystem, designed for ultimate flexibility. It can be used in two primary modes: as a powerful standalone intelligence, or as the core cognitive engine within a larger, bridged super-system. Understanding these modes is key to unlocking its full potential. MODE 1: STANDALONE ENGINE OPERATION (Independent Power The DafeRLMLLib can be used entirely on its own to create a complete, self-learning trading indicator. This approach is perfect for building focused, single-purpose tools that are designed to master a specific task. In this mode, the developer is responsible for creating the full feedback loop within their own indicator script. The Workflow: Your indicator initializes the ML agent. On each bar, it feeds the agent market data via the socket interface. It asks the agent for an action (e.g., Buy, Sell, Hold). Your script then executes its own internal trade logic based on the agent's decision. Your script is responsible for tracking the Profit & Loss (PnL) of the resulting simulated trade. When the trade is closed, your script feeds the final PnL directly back into the agent's learn() function as the "reward" signal. The Result: A pure, state-based learning system. The agent directly learns the consequences of its own actions. This is excellent for discovering novel, micro-level trading patterns and for building indicators that are designed to operate with complete autonomy. MODE 2: BRIDGED SUPER-SYSTEM OPERATION (Synergistic Intelligence) This is the pinnacle of the DAFE ecosystem. In this advanced mode, the DafeRLMLLib acts as the core "cognitive engine" or the "tactical brain" within a larger, multi-library system. It can be fused with a strategic portfolio management engine (like the DafeSPALib) via a master communication protocol (the DafeMLSPABridge). The Workflow: The ML engine (this library) generates a set of creative, state-based proposals or predictions. The Bridge Library translates these proposals into a portfolio of micro-strategies. The SPA (Strategy Portfolio Allocation) engine, acting as a high-level manager, analyzes the real-time performance of these micro-strategies and selects the one it trusts the most. This becomes the final decision. The PnL from the SPA's final, performance-vetted decision is then routed back through the Bridge as a highly-qualified reward signal for the ML engine. The Result: A hybrid intelligence that is more robust and adaptive than either system alone. The ML engine provides tactical creativity, while the SPA engine provides ruthless, strategic, performance-based oversight. The ML proposes, the SPA disposes, and the ML learns from the SPA's wisdom. This creates a system of checks, balances, and continuous, synergistic learning, perfect for building an ultimate, all-in-one "drawing indicator" or trading system. As a developer, the choice is yours. Use this library independently to build powerful, specialized learning tools, or use it as the foundational brain for a truly comprehensive trading AI. █ CHAPTER 4: A GUIDE FOR DEVELOPERS - INTEGRATING THE BRAIN We have made it incredibly simple to bring your indicators to life with the DAFE AI. This is the true purpose of the library—to empower you. This section provides the full, unabridged input template and usage guide. PART I: THE INPUTS TEMPLATE To give your users full control over the AI, copy this entire block of inputs into your indicator script. It is professionally organized with groups and detailed tooltips. // ╔═════════════════════════════════════════════════════╗ // ║ INPUTS TEMPLATE (COPY INTO YOUR SCRIPT) ║ // ╚═════════════════════════════════════════════════════╝ // INPUT GROUPS string G_RL_AGENT = "═══════════ 🧠 AGENT CONFIGURATION ════════════" string G_RL_LEARN = "═══════════ 📚 LEARNING PARAMETERS ═══════════" string G_RL_REWARD = "═══════════ 💰 REWARD SYSTEM ═══════════════" string G_RL_REPLAY = "═══════════ 📼 EXPERIENCE REPLAY ════════════" string G_RL_META = "═══════════ 🔮 META-LEARNING ═══════════════" string G_RL_DASH = "═══════════ 📋 DIAGNOSTICS DASHBOARD ═════════" // AGENT CONFIGURATION string i_rl_algorithm = input.string("Actor-Critic", "🤖 Algorithm", options= , group=G_RL_AGENT, tooltip="Selects the core learning algorithm.\n\n" + "• Q-Learning: Classic, robust, and fast for discrete states. Learns the 'value' of actions.\n" + "• Policy Gradient: Learns a direct probability distribution over actions.\n" + "• Actor-Critic: The state-of-the-art. The 'Actor' decides, the 'Critic' evaluates.\n" + "• Ensemble: Runs both Q-Learning and Policy Gradient and chooses the action with the highest confidence.\n\n" + "RECOMMENDATION: Start with 'Q-Learning' for stability or 'Actor-Critic' for performance.") int i_rl_num_features = input.int(8, "Number of Features (Sockets)", minval=2, maxval=12, group=G_RL_AGENT, tooltip="Defines the size of the AI's 'vision'. This MUST match the number of sockets you connect.") int i_rl_num_actions = input.int(3, "Number of Actions", minval=2, maxval=5, group=G_RL_AGENT, tooltip="Defines what the AI can do. 3 is standard (0=Neutral, 1=Buy, 2=Sell).") // LEARNING PARAMETERS float i_rl_learning_rate = input.float(0.05, "🎓 Learning Rate (Alpha)", minval=0.001, maxval=0.2, step=0.005, group=G_RL_LEARN, tooltip="How strongly the AI updates its knowledge. Low (0.01-0.03) is stable. High (0.1+) is aggressive.") float i_rl_discount = input.float(0.95, "🔮 Discount Factor (Gamma)", minval=0.8, maxval=0.99, step=0.01, group=G_RL_LEARN, tooltip="Determines the agent's 'foresight'. High (0.95+) for trend following. Low (0.85) for scalping.") float i_rl_epsilon = input.float(0.15, "🧭 Exploration Rate (Epsilon)", minval=0.01, maxval=0.5, step=0.01, group=G_RL_LEARN, tooltip="For Q-Learning. The probability of taking a random action to explore. Decays automatically over time.") float i_rl_lambda = input.float(0.7, "⚡ Eligibility Trace (Lambda)", minval=0.0, maxval=0.95, step=0.05, group=G_RL_LEARN, tooltip="For Q-Learning. A powerful accelerator that allows a reward to be 'traced' back through a sequence of actions.") // REWARD SYSTEM string i_rl_reward_mode = input.string("Normalized", "💰 Reward Shaping Mode", options= , group=G_RL_REWARD, tooltip="Modifies the raw PnL reward signal to guide learning.\n\n" + "• Normalized: Creates a stable reward signal (Recommended).\n" + "• Asymmetric: Punishes losses more than it rewards gains. Teaches risk aversion.\n" + "• Risk-Adjusted: Divides PnL by risk (e.g., ATR). Teaches better risk/reward.") // EXPERIENCE REPLAY bool i_rl_use_replay = input.bool(true, "📼 Enable Experience Replay", group=G_RL_REPLAY, tooltip="Allows the agent to store and re-learn from past experiences. Dramatically improves learning stability. HIGHLY RECOMMENDED.") int i_rl_replay_capacity = input.int(500, "Replay Buffer Size", minval=100, maxval=2000, group=G_RL_REPLAY) int i_rl_replay_batch = input.int(4, "Replay Batch Size", minval=1, maxval=10, group=G_RL_REPLAY) // META-LEARNING bool i_rl_use_meta = input.bool(true, "🔮 Enable Meta-Learning", group=G_RL_META, tooltip="Allows the agent to self-tune its own learning rate based on performance trends.") // DIAGNOSTICS DASHBOARD bool i_rl_show_dash = input.bool(true, "📋 Show Diagnostics Dashboard", group=G_RL_DASH) PART II: THE IMPLEMENTATION LOGIC This is the boilerplate code you will adapt to your indicator. It shows the complete Observe-Act-Learn loop. // ╔═══════════════════════════════════════════════════════╗ // ║ USAGE EXAMPLE (ADAPT TO YOUR SCRIPT) ║ // ╚═══════════════════════════════════════════════════════╝ // 1. INITIALIZE THE AGENT (happens only on the first bar) int algo_id = i_rl_algorithm == "Q-Learning" ? 0 : i_rl_algorithm == "Policy Gradient" ? 1 : i_rl_algorithm == "Actor-Critic" ? 2 : 3 int reward_id = i_rl_reward_mode == "Raw PnL" ? 0 : i_rl_reward_mode == "Normalized" ? 1 : i_rl_reward_mode == "Asymmetric" ? 2 : 3 var rl.RLAgent agent = rl.init(algo_id, i_rl_num_features, i_rl_num_actions, i_rl_learning_rate, 54, i_rl_replay_capacity, i_rl_epsilon, i_rl_discount, i_rl_lambda, reward_id) // 2. CONNECT THE "SENSES" (happens only on the first bar) if barstate.isfirst // Connect your indicator's data series to the AI's sockets. The number MUST match 'i_rl_num_features'. agent := rl.connect_socket(agent, "rsi", ta.rsi(close, 14), "oscillator", 1.0) agent := rl.connect_socket(agent, "atr_norm", ta.atr(14)/close*100, "custom", 0.8) // ... connect all other features ... // 3. THE MAIN LOOP (Observe -> Act -> Learn) - runs on every bar var bool in_trade = false var int trade_direction = 0 var float entry_price = 0.0 var int last_state_hash = 0 var int last_action_taken = 0 // --- OBSERVE: Build the current market state --- rl.RLState current_state = rl.build_state(agent) // --- ACT: Ask the AI for a decision --- = rl.select_action(agent, current_state) agent := updated_agent // CRITICAL: Always update the agent state // --- EXECUTE: Your custom trade logic goes here --- if not in_trade and ai_action.action != 0 // Assuming 0 is "Hold" in_trade := true trade_direction := ai_action.action == 1 ? 1 : -1 // Assuming 1=Buy, 2=Sell entry_price := close last_state_hash := current_state.hash // Store the state at the moment of entry last_action_taken := ai_action.action // --- LEARN: Check for trade closure and provide feedback --- bool trade_is_closed = false float reward = 0.0 if in_trade // Your custom exit condition here (e.g., stop loss, take profit, opposite signal) bool exit_condition = bar_index > ta.valuewhen(in_trade, bar_index, 0) + 20 if exit_condition trade_is_closed := true pnl = trade_direction == 1 ? (close - entry_price) / entry_price : (entry_price - close) / entry_price reward := pnl * 100 in_trade := false // If a trade was closed on THIS bar, feed the experience to the AI if trade_is_closed agent := rl.learn(agent, last_state_hash, last_action_taken, reward, current_state, true) // 4. DISPLAY DIAGNOSTICS if i_rl_show_dash and barstate.islast string diag_text = rl.diagnostics(agent) label.new(bar_index, high, diag_text, style=label.style_label_down, color=color.new(#0A0A14, 10), textcolor=#00FF41, size=size.small, textalign=text.align_left) █ DEVELOPMENT PHILOSOPHY The DafeRLMLLib was born from a desire to push the boundaries of Pine Script and to empower the entire TradingView developer community. We believe that the future of technical analysis is not just in creating more complex algorithms, but in building systems that can learn, adapt, and optimize themselves. This library is an open-source framework designed to be a launchpad for a new generation of truly intelligent indicators on TradingView. This library is designed to help you and your users discover what "the best trades" are, not by following a fixed set of rules, but by learning from the market's own feedback, one trade at a time. █ DISCLAIMER & IMPORTANT NOTES THIS IS A LIBRARY FOR ADVANCED DEVELOPERS: This script does nothing on its own. It is a powerful engine that must be integrated into other indicators. REINFORCEMENT LEARNING IS COMPLEX: RL is not a magic bullet. It requires careful feature engineering (choosing the right sockets), a well-defined reward signal, and a sufficient amount of training data (trades) to converge on a profitable strategy. ALL TRADING INVOLVES RISK: The AI's decisions are based on statistical probabilities learned from past data. It does not predict the future with certainty. "The goal of a successful trader is to make the best trades. Money is secondary." — Alexander Elder Taking you to school. - Dskyz, Create with RL.Perpustakaan Pine Script®oleh DskyzInvestments2216
ADAPTIVE SCALP MASTERADAPTIVE SCALP MASTER (ASM) Overview ADAPTIVE SCALP MASTER (ASM) is a high-performance technical analysis tool specifically engineered for scalpers and day traders. It combines statistical volatility analysis with a unique time-frame adaptation engine, allowing the script to automatically recalibrate its sensitivity whether you are trading the 1-minute chart or the 4-hour trend. The core logic is based on Z-Score Mean Reversion coupled with Zero-Lag Least Squares Moving Average (ZLSMA) for trend filtering, ensuring that you enter trades only when momentum and statistical overextension align. Key Features Timeframe Adaptation Engine: ASM automatically adjusts its Z-Score lengths, thresholds, and ATR multipliers based on your current chart. It tightens parameters for high-frequency scalping (M1-M5) and widens them for higher timeframes to filter out market noise. Z-Score Mean Reversion: Utilizes statistical standard deviation to identify overbought and oversold conditions with precision. Zero-Lag Trend Filtering: Features a customized ZLSMA to provide a smooth, reactive trend baseline without the lag of traditional MAs. Smart Risk Management: Automatically calculates dynamic Stop Loss and Take Profit levels based on current ATR volatility. Aggressive Scalping Mode: A specialized toggle for experienced traders that maximizes signal frequency by loosening standard confirmation filters. How It Works Normalization: The indicator calculates the price deviation (Z-Score). Adaptive Thresholds: It checks if the price has reached a statistically significant extreme (Overbought/Oversold). Multi-Stage Filtering: Trend Filter: Signals must align with the ZLSMA direction (optional). Volume Filter: Requires a surge in volume to confirm the move (optional). Candle Confirmation: Requires price action to flip in the signal's direction before firing. Execution: Once all conditions are met, the script plots entry shapes and dynamic risk levels. Settings Guide Aggressive Mode: Use this for fast-paced scalping on M1. It disables the trend and volume filters to capture every micro-reversal. Base Sensitivity: Controls how far back the Z-Score looks. Default is 10. Lower values make the indicator more reactive. Base Threshold: Standard is 1.5. Increase this value (e.g., to 2.0) if you want fewer, higher-probability signals. Min Bars Between: Use this to prevent "signal clustering" during periods of high volatility. User Interface The Info Panel provides real-time data including: Current Market Bias (Trend direction). Live Z-Score value. Current ATR-based volatility status. Trade Signal confirmation status.Penunjuk Pine Script®oleh TheHarmonySystems225
Shadow Mode Simulator ELITE🎮 SHADOW MODE SIMULATOR — FEATURE GUIDE Think of this as GTA with rules instead of random driving. 🏆 1. A / A+ SETUP GRADING (QUALITY CONTROL) Every entry is graded automatically: ✅ A+ Setup (best XP) Must have: • HTF trend aligned • Liquidity sweep OR perfect pullback • High confidence (4–5) ✅ A Setup (acceptable) Must have: • HTF trend aligned • ONE valid strategy condition ⚠️ B Setup (allowed but low reward) Everything else ❌ Invalid Bad RR or no strategy → XP penalty 👉 This trains selectivity (most traders fail here) 🗺️ 2. AUTO SESSION HEATMAP Background turns green during your trading session. This teaches: ✔ When liquidity is real ✔ When NOT to trade No more random midnight scalping. 😵 3. TILT DETECTOR Triggers when: • 2 losses in a row • Or cooldown active Shows: ⚠️ TILT WARNING This is your psychology guardian. (Pros stop trading here. Retail blows accounts here.) 🧠 4. STRATEGY-SPECIFIC VALIDATORS You can toggle: ✅ Liquidity sweep trades ✅ Trend pullback trades If you enter without one → ❌ punished. This builds: ➡️ mechanical discipline ➡️ no random clicking ⏳ 5. EMOTIONAL COOLDOWN SYSTEM After a loss: • You are “locked” for X candles • No rushing back in This rewires revenge trading. 📊 6. LIVE PERFORMANCE ENGINE Tracks: • XP • Level • Win rate • Win/loss streak • Trade count • Tilt state • HTF bias • Setup grade You level up by: 👉 discipline — not profit 📈 LEVEL MEANING (IMPORTANT) Level Skill State 1–2 Impulsive 3–4 Learning patience 5–6 Controlled 7–8 Consistent 9+ Pro-ready You should NOT trade real money seriously before level 7. 🧪 FULL LIVE TUTORIAL — HOW TO USE IT STEP 1 — SETUP Open TradingView Open chart you scalp (NIFTY/BTC/etc) Add the Shadow Mode indicator Set: • Session time • HTF timeframe • Max trades STEP 2 — MARKET OPENS Your job first 10–15 mins: ❌ Do nothing 👀 Just watch structure (This alone fixes overtrading) STEP 3 — WHEN YOU SEE A SETUP Ask: ✔ HTF aligned? ✔ Liquidity sweep or pullback? ✔ RR good? If yes: 👉 Click 📥 ENTRY You’ll see: • Grade (A / A+) • Entry marker STEP 4 — MANAGE LIKE A ROBOT Do NOT interfere. Let: • TP • SL • or invalidation happen STEP 5 — EXIT Click: 📤 EXIT when trade is done System: • Awards XP • Updates streaks • Tracks win rate STEP 6 — IF YOU MESSED UP Click: ❌ RULE BREAK (Takes XP + activates cooldown) This hurts — on purpose. 📆 PERFECT TRAINING DAY LOOKS LIKE: ✅ 1–2 A/A+ trades ✅ maybe 1 loss ✅ stop after cooldown ✅ XP positive Even if P&L is flat. That’s winning. 🚫 COMMON MISTAKES (DON’T DO THESE) ❌ Clicking entry emotionally ❌ Ignoring HTF bias ❌ Overtrading ❌ Chasing candles ❌ Skipping cooldown The simulator is designed to punish these. 🧠 WHY THIS WORKS (SCIENCE SIDE) This trains: • Pattern recognition • impulse control • delayed gratification • process over money Same principles used in pilot & athlete simulators. 🎯 OPTIONAL HARD MODE (WHEN READY) • Max 1 trade/day • Only A+ setups • Higher RR minimum This accelerates mastery.Penunjuk Pine Script®oleh lohanineeraj36
SMC Pro: Institutional Bias & Liquidity Sweep EngineOverview This script is a high-confluence technical analysis tool designed for traders following Smart Money Concepts (SMC) and Price Action methodologies. Its primary objective is to filter trend-based signals (EMA 9/21 crossovers) by integrating two critical institutional filters: HTF Bias (Higher Timeframe Sentiment) and Directional Liquidity Sweeps. Key Features & Technical Originality Unlike standard crossover indicators, this script introduces a multi-layered institutional validation logic: Real-Time HTF Bias Dashboard: The indicator automatically calculates the Daily Bias based on the previous close's position relative to the "Equilibrium" (the 50% mark of the previous day's range). This sentiment is displayed via a clean UI dashboard in the top-right corner, ensuring traders stay aligned with the higher timeframe flow. Directional Liquidity Sweeps: The engine identifies local highs and lows within a dynamic lookback period. A "BUY" signal is only triggered if the price has first performed a "Sweep Low" (raiding sell-side liquidity), and a "SELL" signal only follows a "Sweep High" (raiding buy-side liquidity). This effectively filters out "Bull/Bear Traps." Adaptive Memory Logic: The signal engine "remembers" a liquidity raid for a configurable number of bars. This allows for natural price development before confirming the entry with the EMA cross, capturing the expansion phase of the move. Weekly NWOG Anchor: Includes an automated New Week Opening Gap (NWOG) tracker. Following institutional liquidity principles, this box anchors from Friday’s close to the new week’s open. Per user-defined constraints, the projection is limited strictly to the current trading week to maintain chart clarity and relevance. How to Use Confluence: Look for "BUY" signals when the Dashboard displays a "BULLISH" Bias and a recent sweep of lows has occurred. Context: Use the NWOG levels as institutional magnets; price often gravitates toward or rebalances these gaps before continuing its expansion. Optimized Timeframes: Best suited for M1, M5, and M15 intraday scalping. Disclaimer This indicator is a visual aid for technical analysis and does not constitute financial advice. Past performance does not guarantee future results.Penunjuk Pine Script®oleh fasiares41
ES to SPX Lead (RTH Adaptive)Very simple script designed especially to trade CFD but also scalping. Only RTH (you'll understand why) Not a stand-alone indicator, e.g., an external event may hit the index and /ES leading nature will become meaningless. Same with a sudden crash on a Mag7 stock. Uses Z Score to evaluate if /Es is leading SPX (or not) and /ES VWAP to establish bullish (+1) or bearish territory (-1). Histogram is the product of Z Score times VWAP status, red or green depending. Z score goes from -2 to +2. Zscore reading: 0.4 < |Z| < 1.2 is the trading zone. |Z| <0.4 is sort of neutral shifting gears zone, a no-trade and may be transition moment. Middle numbers show max. limits based on actual volatility (i.e. when to exit and when definitely not to enter a trade). Grey stripes is NO TRADE zone. Final number is the composite histogram value. So: Textbook bullish: /ES above VWAP and Z Score positive Textbook negative: /ES below VWAP and Z score negative If Green Histogram & negative Z Score, you may enter bearish pullback trades making sure Z score is in the sweet spot bracket. If Red histogram & negative Z score, it's a conflict state, signals are not alined. Holds a bullish nature but it may be a warning sign. Script produced by Chat GPT after several iterations.Penunjuk Pine Script®oleh dbirrellr11
RSI: Evolved [DAFE]RSI: Evolved : The Ultimate Momentum Intelligence Engine 30+ RSI Engines. 15+ Zero-Lag Smoothers. The Revolutionary Quantum Horizon. This is Not Just an RSI. This is the Evolution of Momentum. █ PHILOSOPHY: BEYOND THE OSCILLATOR, INTO THE NEXUS The standard Relative Strength Index is a relic. It is a brilliant, timeless concept trapped in a rigid, one-dimensional formula developed in the 1970s. It assumes all market momentum is uniform, that all volatility is equal, and that a single mathematical lens is sufficient to view the infinitely complex character of modern markets. It is not. RSI: Evolved was not created to be another RSI. It was engineered to be the definitive evolution of momentum analysis. This is not an indicator; it is a powerful, interactive research environment. It is a laboratory where you, the trader, can move beyond the static "one-size-fits-all" approach and forge a momentum oscillator that is perfectly adapted to the unique physics of your market, timeframe, and trading style. This suite deconstructs the very DNA of the RSI, rebuilding it with a library of over 30 distinct, mathematically diverse calculation engines . From timeless classics and exotic variations to proprietary DAFE quantum models, this suite provides an unparalleled arsenal for quantifying the unseen forces of market momentum. █ THE EVOLUTION: WHAT MAKES THIS UNLIKE ANY OTHER RSI? This is not just a collection of features; it is a seamlessly integrated, multi-layered analytical system. It stands in a class of its own for several key reasons: The 30+ Algorithm Core: At its heart is a library of over 30 unique RSI calculation engines. You can now choose an engine based on its mathematical properties—whether you need the zero-lag responsiveness of a Hull RSI, the time-warping capability of a Laguerre RSI, or the predictive power of a DAFE Quantum Fusion RSI. Advanced Post-Processing: After the RSI is calculated, it passes through a multi-stage refinement process. First, choose from over 15+ professional-grade smoothing algorithms to create a crystal-clear signal. Then, activate the intelligent Filter Module to scale the RSI's output based on trend, volatility, or momentum regimes. The Quantum Horizon & Temporal Wave: This is a revolutionary leap in data visualization. The indicator projects the historical momentum waves from higher timeframes directly onto your main price chart as a futuristic, holographic overlay. You can now see the alignment (or divergence) of macro momentum without ever looking away from price action. This is multi-timeframe analysis evolved into an art form. Dynamic, Volatility-Adaptive Zones: Static 70/30 levels are obsolete. Evolved's "Quantum Zones" are alive; they "breathe" with market volatility. They automatically widen during powerful trends to keep you in a winning trade and tighten during choppy consolidation to help you catch reversals with greater precision. Comprehensive Analytical Modules: This is a full suite of institutional-grade tools, including a powerful regular and hidden Divergence Engine , a multi-timeframe Consensus Dashboard , and dynamic RSI Bands (Bollinger, Keltner, etc.) plotted directly on the oscillator. █ THE QUANTUM HORIZON & TEMPORAL WAVE: SEEING MOMENTUM IN 4D This groundbreaking feature fundamentally changes how you interact with multi-timeframe momentum data. The Quantum Horizon is a dedicated visualization module that projects up to three "Temporal Waves" directly onto your main price chart. Each wave is a historical representation of a momentum oscillator (RSI, MFI, or Stoch RSI) pulled from a higher timeframe of your choice. Instead of flipping between charts or cluttering your screen with multiple indicators, you get an immediate, intuitive, and aesthetically stunning view of the market's complete momentum structure. Each Temporal Wave is a self-contained universe, rendered as a glowing, flowing line within its own gridded channel. This channel is not just for show; it represents the 0-100 scale of the oscillator, with key 30, 50, and 70 levels marked for reference. You can see the history of momentum, its peaks, its troughs, and its crossovers with its own signal line. This allows you to visually identify macro divergences, trend alignment, and exhaustion points on your primary trading chart, transforming your analysis from a fragmented process into a single, unified experience. This is no longer just an indicator; it is a true Heads-Up Display for the flow of time and momentum. █ THE ARSENAL: A DEEP DIVE INTO THE RSI & SMOOTHING ENGINES This is your library of mathematical DNA. Understanding your tools is the first step to mastery. The 30+ RSI types are grouped into distinct families, each with a unique philosophy. THE RSI ENGINE FAMILIES The Classics (Wilder's, Cutler's, EMA, WMA): These are the foundational building blocks of momentum analysis. They provide a reliable, time-tested baseline. Wilder's uses the RMA for a unique smoothing characteristic, while Cutler's uses the SMA for a more direct, arithmetic average of gains and losses. The EMA and WMA versions offer increased responsiveness by weighting recent price action more heavily. The Low-Lag Warriors (DEMA, TEMA, Hull, ZLEMA): This family is engineered specifically to combat the inherent lag of classical averages. The Double and Triple EMA (DEMA, TEMA) use a composite of multiple EMAs to reduce latency. The Zero-Lag EMA (ZLEMA) attempts to remove lag by adjusting the source price with its own past data. The Hull RSI is a standout, using a weighted moving average calculation to achieve a remarkable balance of extreme smoothness and near-zero lag, making it ideal for scalping. The Exotics (Laguerre, Connors, Fisher, KAMA): These engines employ advanced mathematical concepts to view momentum through a different lens. The Laguerre RSI , based on John Ehlers' work, uses a time-warping, non-linear filter that can be extremely responsive to changes in trend. The Fisher Transform RSI normalizes the output to a Gaussian distribution, making peaks and troughs sharper and more defined for clearer signals. The KAMA Adaptive RSI is a "smart" algorithm that automatically slows its calculation in choppy markets and speeds it up in strong trends. The Volume-Based (Volume-Weighted, MFI, VWAP-Weighted): This family infuses price momentum with volume data, providing a measure of conviction. They answer not just "how fast is price moving?" but "how much participation is behind the move?". The Money Flow RSI (MFI) is a classic, while the Volume-Weighted and VWAP-Weighted versions directly incorporate volume into the gain/loss calculation, giving more weight to high-volume bars. The DAFE Proprietary Engines (The "God Mode" Algos): The crown jewels of the Laboratory, these are custom-built, proprietary algorithms you will not find anywhere else. DAFE Quantum Fusion: This engine calculates RSI on three harmonic timeframes simultaneously (based on the Golden Ratio) and "superimposes" them using a dynamic weighting system based on volume and momentum confidence. It is the most robust and balanced all-rounder. DAFE Kinetic Energy: Based on the physics principle that Momentum = Mass × Velocity. Standard RSI only sees Velocity (price change). Kinetic RSI weights every price move by Relative Volume (Mass), measuring the true "force" of the market. DAFE Spectral: This engine uses concepts from Digital Signal Processing to analyze the frequency of price moves. It automatically differentiates between the "Signal" (the underlying trend) and the "Noise" (the chop), and adapts its calculation speed accordingly. DAFE Entropy Flow: A unique engine that uses Information Theory to measure market "disorder." In chaotic, high-entropy markets, it automatically dampens its own signal to avoid whipsaws. In orderly, low-entropy trends, it sharpens its signal to be more responsive. THE POST-SMOOTHING FILTERS After your primary RSI is calculated, you can pass it through one of over 15 advanced filters for unparalleled clarity. Low-Lag (Hull, DEMA, TEMA): Ideal for responsive smoothing that tracks the raw RSI closely. Adaptive (KAMA, VIDYA): Perfect for smart, regime-aware smoothing that is slow in chop and fast in trends. DSP & Scientific (SuperSmoother, Butterworth, Gaussian, Jurik-Style): The pinnacle of signal processing. These filters provide the absolute cleanest signal with minimal lag, leveraging advanced digital signal processing techniques to surgically remove noise. █ THE ANALYTICAL MODULES: BEYOND THE LINE Dynamic Zones: Your overbought/oversold levels (e.g., 70/30) are no longer static lines. They are living, breathing zones that respond to market volatility. They automatically widen during powerful, high-volatility trends to prevent you from selling a strong uptrend too early. Conversely, they tighten during low-volatility consolidation, allowing you to catch smaller, mean-reverting moves with greater precision. This is a crucial evolution for trading in modern, dynamic markets. Divergence Engine: The automated engine works tirelessly in the background to detect critical disconnects between price and momentum. It automatically identifies and plots both Regular Divergences (which often signal major trend reversals) and Hidden Divergences (which often signal trend continuations after a pullback) with clear on-chart and in-pane markers and lines. MTF Dashboard: Context is everything. This module provides an instant read on the momentum across three higher timeframes of your choice. The "Consensus" reading tells you if all timeframes are aligned ("ALL BULL" or "ALL BEAR"), providing powerful contextual confirmation for your trades and helping you avoid taking signals that go against the macro flow. RSI Bands: This module applies a full-fledged band methodology (Bollinger Bands, Keltner Channels, etc.) directly to the RSI line itself. A pierce of the upper or lower band is a powerful sign of a statistical extreme, often preceding a sharp reversion back to the mean. A "squeeze" in the RSI bands often precedes an explosive move in momentum. Signal Line & Histogram: The fast-moving RSI line is paired with a slower, smoother Signal Line of your choice. Crossovers between these two lines can be used as effective entry/exit triggers that are often more reliable than simple overbought/oversold levels. The histogram visually represents the momentum (the velocity and acceleration) of the RSI itself, turning from light to dark green in a strengthening uptrend, for example. █ DEVELOPMENT PHILOSOPHY RSI: Evolved was forged from a single, guiding principle: momentum is not a fixed property; it is a dynamic, multi-faceted force with a unique character in every market. This tool was designed for the trader who is no longer satisfied with a one-size-fits-all indicator. It is for the analyst, the tinkerer, the scientist—the individual who seeks to deconstruct, understand, and master the hidden physics of market momentum. This is a tool for forging your own alpha, not just following a lagging line. RSI: Evolved is designed to give you that patience and discipline, providing a crystal-clear, multi-dimensional view of momentum so you can act with precision when the perfect setup finally arrives. █ DISCLAIMER AND BEST PRACTICES THIS IS AN ADVANCED ANALYTICAL TOOL: This indicator provides intelligence on momentum, not financial advice. It should be used as a core component of a complete trading strategy. RISK MANAGEMENT IS PARAMOUNT: All trading involves substantial risk. Never risk more capital than you are prepared to lose. START WITH A ROBUST BASE: The "DAFE Quantum Fusion" engine with the "SuperSmoother" is an exceptionally powerful and well-balanced starting point for most markets. USE CONFLUENCE: The highest probability signals occur when multiple modules agree. For example: a Regular Bullish Divergence, as the RSI crosses up from an Extreme Oversold Dynamic Zone, while the Quantum Horizon shows the higher timeframes are also starting to turn up. "The hard part is not making the decision to buy or sell, but having the patience and discipline to wait for the right setup." — Mark Weinstein Taking you to school. - Dskyz, Trade with Anticipation. Trade with Strength. Trade with RSI: EvolvedPenunjuk Pine Script®oleh DskyzInvestments11492
EMA Combo BKEMA Combo – Multi-Timeframe Trend & Momentum Indicator EMA Combo is a clean and efficient multi-Exponential Moving Average (EMA) indicator designed to help traders quickly identify trend direction, momentum strength, and dynamic support/resistance zones across all timeframes. This indicator plots a structured set of five EMAs (10, 20, 50, 100, 200) on the price chart, with intelligent default visibility to keep the chart uncluttered while still allowing deeper analysis when needed. ⸻ Default EMA Structure By default, the indicator displays only the two most actionable EMAs: • EMA 20 (Blue) – Short-term momentum EMA • EMA 50 (Red) – Core trend EMA The following EMAs are hidden by default and can be enabled manually from the indicator settings: • EMA 10 (Teal) – Ultra-fast EMA for scalping and very short-term momentum • EMA 100 (Purple) – Medium-term trend filter • EMA 200 (Orange) – Long-term trend and institutional bias EMA This default visibility ensures a clean chart for day trading, while still supporting swing and positional analysis when required. ⸻ How to Use the Indicator 1. Trend Identification • Price above EMA 50 & EMA 200 → Bullish market structure • Price below EMA 50 & EMA 200 → Bearish market structure • EMA 20 above EMA 50 → Short-term bullish momentum • EMA 20 below EMA 50 → Short-term bearish momentum ⸻ 2. Momentum & Pullback Trading • In strong trends, price often pulls back to EMA 20 or EMA 50 before continuing • EMA 20 acts as a dynamic momentum line • EMA 50 acts as a trend support / resistance zone ⸻ 3. Scalping & Short-Term Trading (EMA 10) • Enable EMA 10 for: • High-frequency scalping • Momentum bursts • Early trend acceleration • Best used on lower timeframes (1m–5m) ⸻ 4. Swing & Positional Trading (EMA 100 & 200) • EMA 100 helps filter mid-term trend strength • EMA 200 defines: • Institutional bias • Long-term support & resistance • Bull vs Bear market zones A market is considered structurally strong when: EMA 20 > EMA 50 > EMA 100 > EMA 200 Penunjuk Pine Script®oleh bkmutha010
Crypto RSI AdvancedThe Crypto RSI Advanced Indicator: A Multi-Dimensional Market Assessment Tool This document outlines the unique features, functionality, implementation, and theoretical foundation of the "Crypto RSI Advanced" indicator. It is designed to be far more than a simple oscillator; it is a comprehensive analytical suite that enhances the classic Relative Strength Index (RSI) by incorporating trend-filtered signals, visual context, and real-time market state diagnostics. Core Originality & Unique Value Proposition The primary innovation of this script lies in its multi-layered, context-aware approach to momentum analysis. While traditional RSI indicators often generate signals based solely on crossing static levels (like 30/70), leading to false signals in strong trends, this script synthesizes four critical dimensions of information: Momentum Value: The raw RSI reading. Momentum Trend: The direction of the RSI itself, determined by its short-term trajectory. Zone Persistence: Whether the RSI is coming from an overbought/oversold condition, adding conviction to breakouts. Integrated Signal Confirmation: The use of a smoothed signal line (EMA of RSI) for additional validation. This synthesis transforms the RSI from a standalone oscillator into a cohesive trading system framework that helps distinguish between potential reversal points and mere pauses within a strong trend. What It Does & How It Achieves It The indicator performs several interconnected functions, presented in a single pane below the price chart: Enhanced RSI & Signal Line Plotting: It calculates the standard RSI based on a user-defined source and length. It plots a smoothed Signal Line (an EMA applied to the RSI values), which acts as a dynamic filter. Crosses between the RSI and this signal line can provide earlier or more refined entry clues than static level crosses alone. Dynamic Visual Context and Alerts: Colored Background Bands: The plot area is dynamically shaded to visually telegraph the market state at a glance: blue for oversold, orange for overbought, and white for the neutral zone. Conditional RSI Line Coloring: The RSI line itself changes color based on its zone and position relative to the 50 mid-line, providing instant visual feedback on momentum strength and bias. Multi-Tiered Signal Detection: The script identifies four distinct signal types: Buy/Sell Signal: Triggered when the RSI crosses back inside the oversold/overbought band from an extreme. This aims to catch early reversals as momentum exits an extreme state. Strong Buy/Strong Sell Signal: A higher-conviction signal triggered when the RSI crosses the oversold/overbought level from within the extreme zone. This suggests a more powerful shift in momentum as the market exits a deeply overextended condition. Integrated Market Intelligence Panel: A key original feature is the fixed information table in the top-right corner. This panel synthesizes all calculations into a concise, actionable snapshot for the latest bar, including: Current precise RSI value. Market State (e.g., Overbought, Bullish Bias, Neutral). RSI Trend (Rising, Falling, Consolidating), assessing the oscillator's own momentum. Active Signal Status (e.g., "Strong Buy", "No Signal"). Zone Intensity (e.g., "Extreme Overbought", "Normal"). Clear Level Annotation: On the final bar, it draws labeled markers at the key levels (Oversold, Mid, Overbought) for a clean and permanent reference on the chart. How to Use It Application: This tool is designed for momentum confirmation, divergence spotting, and identifying potential reversal zones within a broader trend context. It is particularly useful for swing traders and position traders looking for higher-probability entry points, rather than for pure, high-frequency scalping. Usage Guidelines: Parameter Setup: Adjust the core RSI Length and Signal Length to match the volatility of your asset and trading timeframe. The default (14, 9) offers a balanced approach. Signal Hierarchy: Prioritize "Strong" signals over regular signals, as they carry the added context of a zone breakout. A "Strong Buy" signal appearing in an overall uptrend on the higher timeframe presents a high-conviction scenario. Synthesize Information: Do not trade on signals alone. Use the Information Panel for context. For example, a "Buy Signal" occurring while the panel shows "Market State: Oversold" and "RSI Trend: Rising" offers a congruent, multi-factor setup. Visual Context: Use the colored bands and line colors for quick assessment. A blue (bullish) RSI line forming in the blue (oversold) shaded area provides immediate visual congruence for a potential long setup. Confirmation: As with any oscillator, use this tool in conjunction with price action analysis (support/resistance, chart patterns) and other non-correlated indicators (e.g., a trend-following indicator like a moving average) to filter trades and avoid whipsaws in ranging markets. Underlying Computational Philosophy The script's logic is built upon the principle of "Contextual Momentum Analysis." The core premise is that the absolute value of the RSI is less important than its behavior relative to its recent state and trajectory. Trend-Filtered Momentum: By analyzing the RSI's own trend (rsi_trend_up/down), the script introduces a crucial filter. A sell signal occurring while the RSI's internal trend is still rising may be less reliable, warning of a potential false signal. Zone-Based Conviction: The distinction between a regular and a "Strong" signal is philosophically significant. It applies the concept of "impulse from an extreme." A reversal signal that originates from deep inside an extreme zone is considered to have more kinetic energy (conviction) than one that forms near the boundary. Synthesis Over Isolation: The script deliberately avoids providing a single "answer." Instead, it presents multiple, simultaneous data points (value, trend, zone, signal line interaction, historical state) and presents them together in the information panel. This empowers the trader to make a reasoned decision based on a confluence of factors, mimicking the analytical process of a seasoned chartist. In essence, this indicator automates and visualizes a sophisticated, multi-step analytical process that a trader would otherwise have to perform manually, thereby enhancing speed, consistency, and depth of market analysis. Penunjuk Pine Script®oleh neeson19876
Crypto MACD SignalsUnlocking Enhanced Market Insights: A Next-Generation MACD Indicator for Cryptocurrency Trading Introduction: Beyond Traditional MACD In the vast landscape of technical analysis tools, the Moving Average Convergence Divergence (MACD) stands as one of the most ubiquitous and trusted momentum indicators. However, its classic formulation often leaves traders sifting through frequent crossovers, struggling to distinguish high-probability signals from market noise, especially in the volatile cryptocurrency markets. This script represents a significant evolution of the classic MACD, transforming it from a standalone oscillator into a comprehensive, multi-layered signal detection system. Its core originality lies not in reinventing the MACD calculation, but in augmenting it with proprietary filtering mechanisms, quantitative signal scoring, and visual prioritization to enhance decision clarity and timing. Core Functionality: What It Does and How It Achieves It This indicator, titled "Crypto MACD Signals," is a dedicated, non-overlay oscillator built for clarity and actionability. It performs three primary functions simultaneously: Enhanced MACD Visualization: It plots the traditional MACD line, Signal line, and Histogram with a refined color scheme. The histogram is dynamically colored (blue for bullish, orange for bearish) but introduces a key innovation: the identification of "Huge" or "Anomalous" Bars. A bar is highlighted in bright white when its size exceeds twice the 20-bar Simple Moving Average of the absolute histogram values. This instantly draws attention to moments of exceptional momentum surge or capitulation, which often precede significant trend accelerations or reversals. Context-Aware Signal Generation: Instead of marking every MACD line crossover, the script applies a crucial logical filter. It only plots a "BUY" signal (green upward triangle) when a bullish crossover occurs while the histogram is below the zero line. Conversely, a "SELL" signal (red downward triangle) is plotted only when a bearish crossover occurs while the histogram is above the zero line. This filter ensures signals are generated in the context of a potential trend reversal from an oversold or overbought state, rather than during the middle of a strong trend, dramatically increasing the signal's statistical edge. This aligns with a classic "Oscillator Reversal from Extremes" methodology within trend-following systems. Real-Time Performance Dashboard: A fixed table in the top-right corner serves as a live statistical dashboard. It tracks and displays the total count of: Generated Buy Signals Generated Sell Signals Total "Huge" Histogram Bars (both bullish and bearish) This provides traders with an at-a-glance understanding of recent market activity—whether it has been signal-rich or quiet, and the frequency of high-momentum events—aiding in assessing the current market regime (e.g., trending vs. consolidating). Implementation and Practical Usage The indicator is designed for tactical swing trading and momentum-based intraday positioning in crypto assets. Its primary use case is for identifying "Pullback Entries within a Trend" and "Early Trend Reversal Confirmations." For Trend-Following: A trader in an established uptrend would wait for a pullback that drives the MACD histogram negative. A subsequent bullish crossover that triggers a "BUY" signal, especially if accompanied by a "Huge" bullish histogram bar, offers a high-confidence entry point to re-join the trend. For Counter-Trend/Reversal Scenarios (Scalping): The script is highly effective for a specific scalping technique: "Fading Extreme Momentum Exhaustion." A cluster of "Huge" bearish bars followed by a diminishing histogram and a bullish crossover signal can indicate selling exhaustion, presenting a short-term long scalp opportunity. The inverse applies for short scalps. The labels ("🔥") and arrows provide clear visual cues for these setups directly on the chart. Workflow: Traders are advised to first observe the statistical table to gauge recent activity. Then, they should look for convergence between a filtered arrow signal (BUY/SELL) and the appearance of a "Huge" bar or a cluster of them. This multi-factor confirmation is the cornerstone of the strategy. Underlying Philosophy and Calculation Logic The script's intelligence is built on a layered philosophy of "Momentum Quantification and Contextual Validation." Dynamic Thresholding for Anomalies: The "Huge Bar" detection does not use a fixed threshold. By comparing the current histogram value to a recent average of absolute momentum (ta.sma(math.abs(hist_line), 20)), it creates an adaptive, market-responsive benchmark. A bar that is 200% larger than recent average momentum is statistically anomalous, suggesting institutional-sized order flow or a major shift in sentiment. This is a direct application of statistical volatility band principles to momentum, not price. Signal Filtering for Phase Alignment: The conditional logic for plotting arrows (bullish_cross and hist_line < 0) ensures the MACD crossover signal is aligned with the correct momentum phase of the market cycle. A buy signal is only valid if momentum (histogram) is coming from a "recharging" or bearish area (below zero), not when it's already extended above zero. This prevents buying at a peak and selling at a trough, which is a common pitfall of the raw indicator. This embodies the trading axiom: "Trade the turn, not the continuation." Quantitative Self-Awareness: The integrated counter and dashboard represent a meta-analysis layer. It allows the tool to provide feedback on its own performance density. A market generating many signals might be choppy and range-bound, while a market with few signals but several "Huge Bars" might be in a strong, steady trend. This helps the trader select the appropriate strategy (trend riding vs. reversal scalping) for the current environment. In essence, this script synthesizes several respected trading concepts: the core trend/momentum logic of MACD, the anomaly detection common to volatility-based indicators like Keltner Channels, and the signal-verification philosophy of multi-indicator systems—all packaged into a single, coherent, and visually intuitive tool specifically tuned for the unique amplitude and speed of cryptocurrency markets. Penunjuk Pine Script®oleh neeson19874
5EMA + Volume Spikes + Ultra Fast Scalp V3Description This indicator combines 5 EMAs, volume spike detection, and an ultra-fast scalping system designed for short-term trading. The scalping logic uses a fixed + ATR hybrid price deviation, filtered by RSI and CCI to capture extreme overbought/oversold conditions while avoiding overheated zones. It also includes previous day levels (high, low, body high/low) extended into the current session for clear intraday reference. Optimized for fast scalping and momentum fades on lower timeframes.Penunjuk Pine Script®oleh masato1981012218
Ripster EMA Clouds with MTFCredits & Origins: This script is a modification of the widely popular EMA Clouds system originally created by @Ripster47. Full credit goes to him for the strategy and original concept. This version simply adds a quality-of-life feature for traders who use multi-timeframe analysis. What is this Indicator? The Ripster EMA Clouds system uses overlapping Exponential Moving Averages (EMAs) to visualize trends, momentum, and dynamic support/resistance zones. The "clouds" differ in color to indicate bullish or bearish trends, acting as a visual guide for keeping you on the right side of the trade. What is New in This Version? (MTF Capability) The standard version of this indicator calculates EMAs based on your current chart timeframe. If you switch from a 10-minute chart to a 1-minute chart, the clouds change completely. I have added a "Fixed Timeframe" variable/input that allows you to "lock" the clouds to a specific timeframe, regardless of what chart you are viewing. Why is this useful? This allows for true Multi-Timeframe (MTF) scalping. Example: You can set the clouds to look at the 10-minute trend (identifying major support levels) but execute your entries on a 1-minute chart. The clouds will remain locked to the 10-minute data, giving you the "big picture" view while you trade the micro-movements. How to Use Open the indicator settings. Go to the Inputs tab. Find the "Fixed Timeframe" option at the top. Leave Empty (Default): The indicator behaves exactly like the original (adjusts to your chart). Select a Timeframe (e.g., 10 Minutes): The clouds will lock to the 10-minute EMAs, even if you switch your chart to 1-minute or 5-seconds. Note on Visuals When viewing Higher Timeframe (HTF) clouds on a Lower Timeframe (LTF) chart, the clouds will appear to have a "stepped" or "ladder-like" appearance. This is normal and accurate. It represents the single EMA value holding constant for that entire higher-timeframe period. This helps you see the true support level rather than a smoothed, repainted line.Penunjuk Pine Script®oleh FahdYK31
Penny Stock Short Signal Pro# Penny Stock Short Signal Pro (PSSP) v1.0 ## Complete User Guide & Documentation --- # 📋 TABLE OF CONTENTS 1. (#introduction) 2. (#why-short-penny-stocks) 3. (#the-7-core-detection-systems) 4. (#installation--setup) 5. (#understanding-the-dashboard) 6. (#input-settings-deep-dive) 7. (#visual-elements-explained) 8. (#alert-configuration) 9. (#trading-strategies) 10. (#risk-management) 11. (#best-practices) 12. (#troubleshooting) 13. (#changelog) --- # Introduction **Penny Stock Short Signal Pro (PSSP)** is a comprehensive Pine Script v6 indicator specifically engineered for identifying high-probability short-selling opportunities on low-priced, high-volatility stocks. Unlike generic indicators that apply broad technical analysis, PSSP is purpose-built for the unique characteristics of penny stock price action—where parabolic moves, retail FOMO, and violent reversals create predictable patterns for prepared traders. ## Key Features - **7 Independent Detection Systems** working in concert to identify exhaustion points - **Composite Signal Engine** that requires multiple confirmations before triggering - **Real-Time Dashboard** displaying all signal states and market metrics - **Automatic Risk Management** with dynamic stop-loss and profit target calculations - **Customizable Sensitivity** for different trading styles (scalping vs. swing) - **Built-in Alert System** for all major signal types ## Who Is This For? - **Active Day Traders** looking to capitalize on intraday reversals - **Short Sellers** who specialize in penny stocks and small caps - **Momentum Traders** who want to identify when momentum is exhausting - **Risk-Conscious Traders** who need clear entry/exit levels --- # Why Short Penny Stocks? ## The Penny Stock Lifecycle Penny stocks follow a remarkably predictable lifecycle that creates shorting opportunities: ``` PHASE 1: ACCUMULATION └── Low volume, tight range └── Smart money quietly building positions PHASE 2: MARKUP / PROMOTION └── News catalyst or promotional campaign └── Volume increases, price begins rising └── Early momentum traders enter PHASE 3: DISTRIBUTION (YOUR OPPORTUNITY) └── Parabolic move attracts retail FOMO buyers └── Smart money selling into strength └── Volume climax signals exhaustion └── ⚠️ PSSP SIGNALS FIRE HERE ⚠️ PHASE 4: DECLINE └── Support breaks, panic selling └── Price returns toward origin └── Short sellers profit ``` ## Why Shorts Work on Penny Stocks 1. **No Fundamental Support**: Most penny stocks have no earnings, revenue, or assets to justify elevated prices 2. **Promotional Nature**: Many rallies are driven by promoters who will eventually stop 3. **Retail Exhaustion**: Retail buying power is finite—when it's exhausted, gravity takes over 4. **Float Dynamics**: Low float stocks move fast in both directions 5. **Technical Levels Matter**: VWAP, round numbers, and prior highs become self-fulfilling resistance --- # The 7 Core Detection Systems PSSP employs seven independent detection algorithms. Each identifies a specific type of exhaustion or reversal signal. When multiple systems fire simultaneously, the probability of a successful short dramatically increases. --- ## 1. PARABOLIC EXHAUSTION DETECTOR ### What It Detects Identifies when price has moved too far, too fast and is likely to reverse. This system looks for the classic "blow-off top" pattern common in penny stock runners. ### Technical Logic ``` Parabolic Signal = TRUE when: ├── Consecutive green candles ≥ threshold (default: 3) ├── AND price extension from VWAP ≥ threshold ATRs (default: 1.5) └── OR shooting star / upper wick rejection pattern forms ``` ### Visual Representation ``` ╱╲ ← Shooting star / upper wick ╱ ╲ (Parabolic exhaustion) ╱ ╱ ╱ ══════════════ VWAP ╱ ╱ ``` ### Why It Works on Penny Stocks Penny stocks are notorious for parabolic moves driven by retail FOMO. When everyone who wants to buy has bought, there's no one left to push prices higher. The shooting star pattern shows that sellers are already stepping in at higher prices. ### Key Settings | Parameter | Default | Range | Description | |-----------|---------|-------|-------------| | Lookback Period | 10 | 3-30 | Bars to analyze for pattern | | Extension Threshold | 1.5 ATR | 0.5-5.0 | How far above VWAP is "parabolic" | | Consecutive Green Bars | 3 | 2-10 | Minimum green bars for exhaustion | --- ## 2. VWAP REJECTION SYSTEM ### What It Detects Volume Weighted Average Price (VWAP) is the single most important level for institutional traders. This system identifies when price tests above VWAP and gets rejected back below—a powerful short signal. ### Technical Logic ``` VWAP Rejection = TRUE when: ├── Candle high pierces above VWAP ├── AND candle closes below VWAP ├── AND candle is bearish (close < open) └── AND rejection distance is within sensitivity threshold ``` ### Visual Representation ``` High ──→ ╱╲ ╱ ╲ VWAP ════════╱════╲═══════════ Close ←── Rejection ``` ### Extended VWAP Signals The system also tracks VWAP standard deviation bands. Rejection from the upper band (2 standard deviations above VWAP) is an even stronger signal. ### Why It Works on Penny Stocks - Algorithms and institutions use VWAP as their benchmark - Failed attempts to reclaim VWAP often lead to waterfall selling - VWAP acts as a "magnet" that price tends to revert toward ### Key Settings | Parameter | Default | Range | Description | |-----------|---------|-------|-------------| | Rejection Sensitivity | 0.5 ATR | 0.1-2.0 | How close to VWAP for valid rejection | | Show VWAP Line | True | - | Display VWAP on chart | | Show VWAP Bands | True | - | Display standard deviation bands | | Band Multiplier | 2.0 | 0.5-4.0 | Standard deviations for bands | --- ## 3. VOLUME CLIMAX DETECTOR ### What It Detects Identifies "blow-off tops" where extreme volume accompanies a price spike. This often marks the exact top as it represents maximum retail participation—after which buying power is exhausted. ### Technical Logic ``` Volume Climax = TRUE when: ├── Current volume ≥ (Average volume × Climax Multiple) ├── AND one of: │ ├── Selling into the high (upper wick > lower wick on green bar) │ └── OR post-climax weakness (red bar following climax bar) ``` ### Visual Representation ``` Price: ╱╲ ╱ ╲ ╱ ╲ ╱ ╲ ╱ Volume: ▂▃▅▇██▇▅▃▂▁ ↑ Volume Climax (3x+ average) ``` ### Why It Works on Penny Stocks - Retail traders pile in at the top, creating volume spikes - Market makers and smart money use this liquidity to exit - Once the volume spike passes, there's no fuel left for higher prices - The "smart money selling into dumb money buying" creates the top ### Key Settings | Parameter | Default | Range | Description | |-----------|---------|-------|-------------| | Volume MA Length | 20 | 5-50 | Period for average volume calculation | | Climax Volume Multiple | 3.0x | 1.5-10.0 | Multiple of average for "climax" | | Show Volume Bars | True | - | Visual volume representation | --- ## 4. RSI DIVERGENCE ANALYZER ### What It Detects Bearish divergence occurs when price makes higher highs but RSI (momentum) makes lower highs. This indicates that momentum is weakening even as price pushes higher—a warning of imminent reversal. ### Technical Logic ``` Bearish Divergence = TRUE when: ├── RSI is in overbought territory (> threshold) ├── AND RSI is declining (current < previous < prior) └── Indicates momentum exhaustion before price catches up ``` ### Visual Representation ``` Price: /\ /\ / \ / \ ← Higher high / \/ / / RSI: /\ / \ /\ / \/ \ ← Lower high (DIVERGENCE) / \ ════════════════════ Overbought (70) ``` ### Why It Works on Penny Stocks - Penny stocks often push to new highs on weaker and weaker momentum - Divergence signals that fewer buyers are participating at each new high - Eventually, the lack of buying pressure leads to collapse ### Key Settings | Parameter | Default | Range | Description | |-----------|---------|-------|-------------| | RSI Length | 14 | 5-30 | Standard RSI calculation period | | Overbought Level | 70 | 60-90 | RSI level considered overbought | | Divergence Lookback | 14 | 5-30 | Bars to look back for swing highs | --- ## 5. KEY LEVEL REJECTION TRACKER ### What It Detects Identifies rejections from significant price levels where shorts are likely to be concentrated: High of Day (HOD), premarket highs, and psychological levels (whole and half dollars). ### Technical Logic ``` Level Rejection = TRUE when: ├── Price touches key level (within 0.2% tolerance) ├── AND candle is bearish (close < open) ├── AND close is in lower portion of candle range │ ├── Key Levels Tracked: │ ├── High of Day (HOD) │ ├── Premarket High │ └── Psychological levels ($1.00, $1.50, $2.00, etc.) ``` ### Visual Representation ``` HOD ───────────────────────────────── ╱╲ ← Rejection ╱ ╲ ╱ ╲ ╱ ───────────────────────────────── PM High ───────────────────────────── ``` ### Why It Works on Penny Stocks - **HOD**: The high of day is where the most traders are trapped long. Failure to break HOD often triggers stop-loss cascades - **Premarket High**: Represents overnight enthusiasm; failure to exceed often means the "news" is priced in - **Psychological Levels**: Round numbers ($1, $2, $5) attract orders and act as natural resistance ### Key Settings | Parameter | Default | Range | Description | |-----------|---------|-------|-------------| | Track HOD Rejection | True | - | Monitor high of day | | Track Premarket High | True | - | Monitor premarket resistance | | Track Psychological Levels | True | - | Monitor round numbers | --- ## 6. FAILED BREAKOUT DETECTOR ### What It Detects Identifies "bull traps" where price breaks above resistance but immediately fails and closes back below. This traps breakout buyers and often leads to accelerated selling. ### Technical Logic ``` Failed Breakout = TRUE when: ├── Price breaks above recent high (lookback period) ├── AND one of: │ ├── Same bar closes below the breakout level │ └── OR following bars show consecutive red candles ``` ### Visual Representation ``` ╱╲ ╱ ╲ ← False breakout Recent High ══╱════╲════════════════ ╱ ╲ ╱ ╲ ╱ ╲ ← Trapped longs panic sell ``` ### Why It Works on Penny Stocks - Breakout traders enter on the break, providing exit liquidity for smart money - When the breakout fails, these traders become trapped and must exit - Their forced selling accelerates the decline - Penny stocks have thin order books, making failed breakouts especially violent ### Key Settings | Parameter | Default | Range | Description | |-----------|---------|-------|-------------| | Breakout Lookback | 5 | 2-15 | Bars to define "recent high" | | Confirmation Bars | 2 | 1-5 | Bars to confirm failure | --- ## 7. MOVING AVERAGE BREAKDOWN SYSTEM ### What It Detects Monitors exponential moving averages (EMAs) for bearish crossovers and price rejections. EMA crosses often signal trend changes, while rejections from EMAs indicate resistance. ### Technical Logic ``` MA Breakdown = TRUE when: ├── Bearish EMA cross (fast crosses below slow) └── OR EMA rejection (price tests EMA from below and fails) ``` ### Visual Representation ``` ╱╲ ← Rejection from EMA ╱ ╲ EMA 9 ═══════════╱════╲═══════════ ╲ EMA 20 ═══════════════════╲════════ ╲ Bearish cross ↓ ``` ### Why It Works on Penny Stocks - EMAs smooth out the noise and show underlying trend direction - When fast EMA crosses below slow EMA, it signals momentum shift - Rejected attempts to reclaim EMAs show sellers are in control ### Key Settings | Parameter | Default | Range | Description | |-----------|---------|-------|-------------| | Fast EMA | 9 | 3-20 | Short-term trend | | Slow EMA | 20 | 10-50 | Medium-term trend | | Show EMAs | True | - | Display on chart | --- # Installation & Setup ## Step 1: Access Pine Editor 1. Open TradingView (tradingview.com) 2. Open any chart 3. Click "Pine Editor" at the bottom of the screen ## Step 2: Create New Indicator 1. Click "Open" → "New blank indicator" 2. Delete any existing code 3. Paste the entire PSSP code ## Step 3: Save and Add to Chart 1. Click "Save" (give it a name like "PSSP") 2. Click "Add to chart" 3. The indicator will appear with default settings ## Step 4: Configure Settings 1. Click the gear icon (⚙️) on the indicator 2. Adjust settings based on your trading style (see Settings section) 3. Click "OK" to apply ## Recommended Chart Setup - **Timeframe**: 1-minute or 5-minute for scalping, 15-minute for swing shorts - **Chart Type**: Candlestick - **Extended Hours**: Enable if trading premarket/afterhours - **Volume**: Can disable default volume since PSSP tracks it --- # Understanding the Dashboard The real-time dashboard provides at-a-glance status of all systems: ``` ┌─────────────────────────────────────────┐ │ 📊 SHORT SIGNAL DASHBOARD │ ├─────────────────────────────────────────┤ │ Signal Strength: 5/7 │ ├─────────────────────────────────────────┤ │ ─── ACTIVE SIGNALS ─── │ │ │ │ Parabolic Exhaustion 🔴 2.1 ATR │ │ VWAP Rejection 🔴 Above │ │ Volume Climax 🔴 4.2x Avg │ │ RSI Divergence ⚪ RSI: 68 │ │ Level Rejection 🔴 @ HOD │ │ Failed Breakout 🔴 │ │ MA Breakdown ⚪ Bullish │ ├─────────────────────────────────────────┤ │ ─── RISK LEVELS ─── │ │ Stop: $2.45 T1: $2.10 T2: $1.85 │ └─────────────────────────────────────────┘ ``` ## Dashboard Elements Explained ### Signal Strength Indicator | Rating | Signals | Color | Interpretation | |--------|---------|-------|----------------| | STRONG | 5-7 | Red | High-confidence short opportunity | | MODERATE | 3-4 | Orange | Decent setup, consider other factors | | WEAK | 1-2 | Gray | Insufficient confirmation | | NONE | 0 | Gray | No short signals active | ### Signal Status Icons - 🔴 = Signal is ACTIVE (condition met) - ⚪ = Signal is INACTIVE (condition not met) ### Contextual Metrics Each signal row includes relevant metrics: - **Parabolic**: Shows ATR extension from VWAP - **VWAP**: Shows if price is Above/Below VWAP - **Volume**: Shows current volume as multiple of average - **RSI**: Shows current RSI value - **Level**: Shows which level was touched (HOD, PM High, etc.) - **MA**: Shows EMA relationship (Bullish/Bearish) ### Risk Levels When a composite short signal fires: - **Stop**: Suggested stop-loss level (high + ATR multiple) - **T1**: First profit target (1:1 risk/reward) - **T2**: Second profit target (user-defined R:R) --- # Input Settings Deep Dive ## Group 1: Parabolic Exhaustion | Setting | Default | Conservative | Aggressive | Description | |---------|---------|--------------|------------|-------------| | Enable | True | True | True | Turn system on/off | | Lookback Period | 10 | 15 | 5 | Bars analyzed for pattern | | Extension Threshold | 1.5 | 2.0 | 1.0 | ATRs above VWAP for "parabolic" | | Consecutive Green Bars | 3 | 4 | 2 | Minimum green bars required | **Tuning Tips:** - Lower thresholds = more signals but more false positives - Higher thresholds = fewer signals but higher quality - For very volatile penny stocks, consider higher thresholds ## Group 2: VWAP Rejection | Setting | Default | Conservative | Aggressive | Description | |---------|---------|--------------|------------|-------------| | Enable | True | True | True | Turn system on/off | | Rejection Sensitivity | 0.5 | 0.3 | 0.8 | ATR distance for valid rejection | | Show VWAP Line | True | True | True | Display VWAP | | Show VWAP Bands | True | True | True | Display deviation bands | | Band Multiplier | 2.0 | 2.5 | 1.5 | Standard deviations for bands | **Tuning Tips:** - Tighter sensitivity (lower number) = must reject very close to VWAP - Wider bands = less frequent upper band rejections but more significant ## Group 3: Volume Climax | Setting | Default | Conservative | Aggressive | Description | |---------|---------|--------------|------------|-------------| | Enable | True | True | True | Turn system on/off | | Volume MA Length | 20 | 30 | 10 | Baseline volume period | | Climax Volume Multiple | 3.0 | 4.0 | 2.0 | Multiple for "climax" status | | Show Volume Profile | True | True | True | Visual volume bars | **Tuning Tips:** - Higher multiple = only extreme volume spikes trigger - Shorter MA = more responsive to recent volume changes - For highly liquid stocks, consider higher multiples ## Group 4: Momentum Divergence | Setting | Default | Conservative | Aggressive | Description | |---------|---------|--------------|------------|-------------| | Enable | True | True | True | Turn system on/off | | RSI Length | 14 | 21 | 7 | RSI calculation period | | Overbought Level | 70 | 75 | 65 | Threshold for "overbought" | | Divergence Lookback | 14 | 20 | 10 | Bars for swing high detection | **Tuning Tips:** - Lower overbought threshold = more frequent signals - Shorter RSI length = more responsive but noisier ## Group 5: Key Level Rejection | Setting | Default | Description | |---------|---------|-------------| | Enable | True | Master toggle for level system | | Track Premarket High | True | Monitor premarket resistance | | Track HOD Rejection | True | Monitor high of day | | Track Psychological Levels | True | Monitor round numbers | **Tuning Tips:** - Disable premarket tracking if stock doesn't have significant premarket activity - Psychological levels work best on stocks under $10 ## Group 6: Failed Follow-Through | Setting | Default | Conservative | Aggressive | Description | |---------|---------|--------------|------------|-------------| | Enable | True | True | True | Turn system on/off | | Breakout Lookback | 5 | 8 | 3 | Bars defining "recent high" | | Confirmation Bars | 2 | 3 | 1 | Bars to confirm failure | **Tuning Tips:** - Shorter lookback = more breakouts detected but smaller significance - More confirmation bars = higher confidence but later entry ## Group 7: Moving Average Signals | Setting | Default | Conservative | Aggressive | Description | |---------|---------|--------------|------------|-------------| | Enable | True | True | True | Turn system on/off | | Fast EMA | 9 | 12 | 5 | Short-term trend | | Slow EMA | 20 | 26 | 13 | Medium-term trend | | Show EMAs | True | True | True | Display on chart | **Tuning Tips:** - Standard 9/20 works well for most penny stocks - Faster EMAs (5/13) for scalping, slower (12/26) for swing trading ## Group 8: Composite Signal | Setting | Default | Conservative | Aggressive | Description | |---------|---------|--------------|------------|-------------| | Minimum Signals | 3 | 4-5 | 2 | Signals needed for trigger | | Show Dashboard | True | True | True | Display signal table | | Dashboard Position | top_right | - | - | Screen location | **Tuning Tips:** - **Minimum Signals is the most important setting** - Higher minimum = fewer trades but higher win rate - Lower minimum = more trades but more false signals ## Group 9: Risk Management | Setting | Default | Conservative | Aggressive | Description | |---------|---------|--------------|------------|-------------| | Show Stop Levels | True | True | True | Display stop loss | | Stop ATR Multiple | 1.5 | 2.0 | 1.0 | Stop distance in ATRs | | Show Targets | True | True | True | Display profit targets | | Target R:R | 2.0 | 1.5 | 3.0 | Risk:Reward for Target 2 | **Tuning Tips:** - Tighter stops (lower ATR multiple) = less risk but more stop-outs - Higher R:R targets = bigger winners but fewer targets hit ## Group 10: Visual Settings | Setting | Default | Description | |---------|---------|-------------| | Bullish Color | Green | Color for bullish elements | | Bearish Color | Red | Color for bearish/short signals | | Warning Color | Orange | Color for caution signals | | Neutral Color | Gray | Color for inactive elements | --- # Visual Elements Explained ## Chart Overlays ### VWAP Line (Blue) - **Solid blue line** = Volume Weighted Average Price - Price above VWAP = bullish bias - Price below VWAP = bearish bias - **Use**: Short when price rejects from above VWAP ### VWAP Bands (Purple circles) - Upper band = 2 standard deviations above VWAP - Lower band = 2 standard deviations below VWAP - **Use**: Extreme extension to upper band signals potential reversal ### EMAs (Orange and Red) - **Orange line** = Fast EMA (9-period default) - **Red line** = Slow EMA (20-period default) - **Use**: Bearish cross or price rejection from EMAs confirms short ### HOD Line (Red, dashed) - Shows the current day's high - **Use**: Rejection from HOD is a key short signal ### Premarket High (Orange, dashed) - Shows premarket session high - **Use**: Failure to break PM high often signals weakness ## Signal Markers ### Individual Signal Markers (Small) | Shape | Color | Signal | |-------|-------|--------| | ▼ Triangle | Purple | Parabolic Exhaustion | | ✕ X-Cross | Blue | VWAP Rejection | | ◆ Diamond | Yellow | Volume Climax | | ● Circle | Orange | RSI Divergence | | ■ Square | Red | Failed Breakout | ### Composite Short Signal (Large) - **Large red triangle** with "SHORT" text - Only appears when minimum signal threshold is met - This is your primary trading signal ## Risk Level Lines ### Stop Loss (Red line) - Calculated as: Entry + (ATR × Stop Multiple) - Represents maximum acceptable loss - **RESPECT THIS LEVEL** ### Target 1 (Light green line) - First profit target at 1:1 risk/reward - Consider taking partial profits here ### Target 2 (Dark green line) - Second profit target at user-defined R:R - Let winners run to this level ## Background Coloring ### Light Red Background - Appears when composite short signal is active - Indicates you should be looking for shorts, not longs ### Light Purple Background - Appears during extreme parabolic extension - Warning of potential imminent reversal --- # Alert Configuration ## Available Alerts ### 1. Composite Short Signal **Best for**: Primary trading signal ``` Condition: Composite short signal fires Message: "PSSP: Short Signal Triggered - {ticker} at {close}" ``` ### 2. Parabolic Exhaustion **Best for**: Early warning of potential top ``` Condition: Parabolic exhaustion detected Message: "PSSP: Parabolic exhaustion detected on {ticker}" ``` ### 3. Volume Climax **Best for**: Blow-off top identification ``` Condition: Volume climax occurs Message: "PSSP: Volume climax / blow-off top on {ticker}" ``` ### 4. Strong Short Setup (5+ Signals) **Best for**: High-confidence opportunities only ``` Condition: 5 or more signals active Message: "PSSP: STRONG short setup on {ticker}" ``` ### 5. Very Strong Short Setup (6+ Signals) **Best for**: Maximum confidence trades ``` Condition: 6 or more signals active Message: "PSSP: VERY STRONG short setup on {ticker}" ``` ### 6. Failed Breakout **Best for**: Bull trap identification ``` Condition: Failed breakout detected Message: "PSSP: Failed breakout detected on {ticker}" ``` ### 7. Key Level Rejection **Best for**: Resistance level plays ``` Condition: Key level rejection occurs Message: "PSSP: Key level rejection on {ticker}" ``` ## Setting Up Alerts in TradingView 1. Right-click on the chart 2. Select "Add Alert" 3. Set Condition to "Penny Stock Short Signal Pro" 4. Choose your desired alert condition 5. Configure notification method (popup, email, webhook, etc.) 6. Set expiration (or "Open-ended" for permanent) 7. Click "Create" ## Alert Strategy Recommendations ### For Active Day Traders - Enable: Composite Short Signal, Volume Climax - Set to: Popup + Sound - Check frequently during market hours ### For Swing Traders - Enable: Strong Short Setup (5+), Very Strong Short Setup (6+) - Set to: Email + Mobile Push - Review at key times (open, lunch, close) ### For Part-Time Traders - Enable: Very Strong Short Setup (6+) only - Set to: Email + SMS - Only trade highest-conviction setups --- # Trading Strategies ## Strategy 1: The Parabolic Fade **Setup Requirements:** - Parabolic Exhaustion signal ACTIVE - Extension from VWAP ≥ 2.0 ATR - Volume climax or declining volume on push **Entry:** - Short on first red candle after signal - Or short on break below prior candle's low **Stop Loss:** - Above the high of the parabolic move - Maximum: 1.5 ATR above entry **Targets:** - T1: VWAP (take 50% off) - T2: Lower VWAP band or LOD **Best Time:** 9:30-10:30 AM (morning runners) --- ## Strategy 2: VWAP Rejection Short **Setup Requirements:** - VWAP Rejection signal ACTIVE - Price came from below VWAP - Rejection candle has significant upper wick **Entry:** - Short on close below VWAP - Or short on break below rejection candle low **Stop Loss:** - Above VWAP + 0.5 ATR - Or above rejection candle high **Targets:** - T1: Lower VWAP band - T2: Prior support or LOD **Best Time:** Midday (11:00 AM - 2:00 PM) --- ## Strategy 3: HOD Failure Short **Setup Requirements:** - Level Rejection signal ACTIVE (HOD) - Multiple tests of HOD without breakthrough - Volume declining on each test **Entry:** - Short on confirmed HOD rejection - Wait for close below the rejection candle **Stop Loss:** - Above HOD + 0.25 ATR (tight) - Clear invalidation if HOD breaks **Targets:** - T1: VWAP - T2: Morning support levels **Best Time:** 10:30 AM - 12:00 PM --- ## Strategy 4: Volume Climax Fade **Setup Requirements:** - Volume Climax signal ACTIVE - Volume ≥ 3x average on green candle - Followed by bearish candle or upper wick **Entry:** - Short on first red candle after climax - Or short on break below climax candle low **Stop Loss:** - Above climax candle high - Give room for volatility spike **Targets:** - T1: 50% retracement of the run - T2: VWAP or start of the run **Best Time:** First hour of trading --- ## Strategy 5: The Full Composite (High Conviction) **Setup Requirements:** - Composite Short signal ACTIVE - Minimum 4-5 individual signals - Clear visual of signal markers clustering **Entry:** - Short immediately on composite signal - Use market order for fast-moving stocks **Stop Loss:** - Use indicator's automatic stop level - Do not deviate from system **Targets:** - T1: Indicator's T1 level (1:1) - T2: Indicator's T2 level (2:1) **Best Time:** Any time with sufficient signals --- # Risk Management ## Position Sizing Formula ``` Position Size = (Account Risk %) / (Stop Loss %) Example: - Account: $25,000 - Risk per trade: 1% = $250 - Entry: $2.00 - Stop: $2.20 (10% stop) - Position Size: $250 / 10% = $2,500 worth - Shares: $2,500 / $2.00 = 1,250 shares ``` ## Risk Rules ### The 1% Rule Never risk more than 1% of your account on any single trade. For a $25,000 account, max risk = $250. ### The 2x Stop Rule If your stop gets hit twice on the same stock, stop trading it for the day. The pattern isn't working. ### The Daily Loss Limit Set a maximum daily loss (e.g., 3% of account). Stop trading if hit. ### The Size-Down Rule After a losing trade, reduce your next position size by 50%. Rebuild after a winner. ## Short-Specific Risks ### The Short Squeeze - Penny stocks can squeeze violently - ALWAYS use stops - Never "hope" a position comes back - Size appropriately for volatility ### The Hard-to-Borrow - Check borrow availability before trading - High borrow fees eat into profits - Some stocks become HTB mid-trade ### The Halt Risk - Penny stocks can halt on volatility - Position size for worst-case halt against you - Halts can open significantly higher --- # Best Practices ## DO's ✅ **Wait for multiple signals** - Single signals have lower accuracy ✅ **Trade with the trend** - Short when daily trend is down ✅ **Use the dashboard** - Check signal count before entering ✅ **Respect stops** - The indicator calculates them for a reason ✅ **Size appropriately** - Penny stocks are volatile; position small ✅ **Trade liquid stocks** - Volume ≥ 500K daily average ✅ **Know the catalyst** - Understand why the stock is moving ✅ **Take partial profits** - Secure gains at T1 ✅ **Journal your trades** - Track what works and what doesn't ✅ **Time your entries** - Best shorts often come 10:30-11:30 AM ## DON'Ts ❌ **Don't short strong stocks** - If it won't go down, don't force it ❌ **Don't fight the tape** - A stock going up can keep going up ❌ **Don't average up on losers** - Adding to losing shorts is dangerous ❌ **Don't ignore the dashboard** - It exists to help you ❌ **Don't overtrade** - Quality over quantity ❌ **Don't short into news** - Wait for the reaction first ❌ **Don't trade the first 5 minutes** - Too chaotic for reliable signals ❌ **Don't hold overnight** - Penny stock gaps can destroy accounts ❌ **Don't trade without stops** - Ever. ❌ **Don't trade on tilt** - After losses, take a break ## Optimal Trading Windows | Time (ET) | Quality | Notes | |-----------|---------|-------| | 9:30-9:35 | ⭐ | Too volatile, avoid | | 9:35-10:30 | ⭐⭐⭐⭐⭐ | Best shorts, morning runners exhaust | | 10:30-11:30 | ⭐⭐⭐⭐ | Secondary exhaustion, HOD rejections | | 11:30-2:00 | ⭐⭐ | Midday lull, lower quality | | 2:00-3:00 | ⭐⭐⭐ | Afternoon setups develop | | 3:00-3:30 | ⭐⭐⭐⭐ | End of day momentum | | 3:30-4:00 | ⭐⭐ | Closing volatility, risky | --- # Troubleshooting ## Common Issues ### "Signals aren't appearing" - Check that the relevant system is enabled in settings - Ensure minimum signals threshold isn't too high - Verify the stock has sufficient volume for calculations ### "Too many false signals" - Increase minimum signals threshold - Use more conservative settings (see Settings section) - Focus on stocks with cleaner price action ### "Dashboard not showing" - Ensure "Show Signal Dashboard" is enabled - Check that your chart has enough space - Try a different dashboard position ### "VWAP line is missing" - VWAP requires intraday timeframes (1m, 5m, 15m, etc.) - VWAP resets daily; won't show on daily+ charts - Ensure "Show VWAP Line" is enabled ### "Stop loss seems too tight/wide" - Adjust Stop ATR Multiple in Risk Management settings - Lower multiple = tighter stop - Higher multiple = wider stop ### "Alerts not triggering" - Verify alert is set to the correct indicator - Check that alert hasn't expired - Ensure notification settings are configured in TradingView ## Performance Optimization If the indicator is slow: 1. Reduce the number of visual elements shown 2. Disable unused signal systems 3. Use on fewer simultaneous charts 4. Close unused browser tabs --- # Changelog ## Version 1.0 (Initial Release) - 7 core detection systems implemented - Real-time signal dashboard - Automatic risk management calculations - 7 alert conditions - Full visual overlay system - Comprehensive input settings ## Planned Features (Future Updates) - Scanner integration for multi-stock screening - Machine learning signal weighting - Backtesting statistics panel - Volume profile analysis - Level 2 data integration (if available) - Custom timeframe VWAP options --- # Support & Feedback ## Reporting Issues When reporting issues, please include: 1. TradingView username 2. Stock symbol and timeframe 3. Screenshot of the issue 4. Your indicator settings 5. Steps to reproduce ## Feature Requests We welcome suggestions for improving PSSP. Consider: - What specific pattern are you trying to catch? - How would this help your trading? - Any reference examples? --- # Disclaimer **IMPORTANT: This indicator is for educational and informational purposes only.** - Past performance does not guarantee future results - Short selling carries unlimited risk potential - Always use proper position sizing and stop losses - Paper trade before using real capital - The creator assumes no liability for trading losses - Consult a financial advisor before trading **Trade at your own risk.** --- *Penny Stock Short Signal Pro v1.0* *Pine Script v6* *© 2025*Penunjuk Pine Script®oleh DayTradingMD1992117
Apex Wallet - Ultimate Multi-Oscillator (9-in-1) & Market TrendThe Apex Wallet Multi-Oscillator is a powerful "All-in-One" technical analysis tool designed to clean up your charts by combining nine of the most effective momentum and trend indicators into a single workspace. This script is engineered to adapt to different trading styles—Scalping, Day-Trading, or Swing-Trading—with a single click. +4 Whether you are looking for trend exhaustion, momentum shifts, or volatility breakouts, this indicator provides a clear, visual summary of market dynamics. +1 Key Features 9 Indicators in 1: Access RSI, Stochastic, StochRSI, MACD, Zero-Lag MACD, Andean Oscillator, and the Traders Dynamic Index (TDI). +1 Smart Layout Modes: Raw (Brut): Classic view with original values. +1 Stacked (Empilé): Organizes indicators into fixed vertical zones to prevent overlapping. +1 Proportional Stacking: Automatically calculates and adjusts the height of blocks based on active oscillators. +2 Trading Presets: Switch between Scalping, Day-Trading, and Swing-Trading modes. The script automatically adjusts periods and lengths (e.g., RSI 7 for Scalping vs. 21 for Swing) to match the market speed. +3 Included Oscillators Stochastic & RSI: Standard momentum tools with color-coded signals. Traders Dynamic Index (TDI): A full suite including the RSI Price Line, Signal Line, and Market Base Line with optional Bollinger Bandwidth columns. +1 MACD & Zero-Lag MACD: Includes histogram fills and trend-colored lines for faster reaction to price movement. +2 Andean Oscillator: An advanced tool to identify Bull/Bear dominance and market "Range" or "Reversal" states. Visual Signals & Alerts Market Trend: Optional visual coloring based on indicator crosses to quickly spot bullish or bearish momentum. +3 Customizable UI: High-fidelity rendering with dashed levels and proportional fills for a professional, clean interface. +1 Integrated Alerts: Pre-configured alerts for Andean Oscillator trend changes (Bullish, Bearish, or Reversal). How to use Select your Trading Mode in the settings based on your timeframe. Toggle the indicators you want to see. Use the Stacked mode if you want to keep your sub-window organized without lines crossing each other.Penunjuk Pine Script®oleh Apex-Wallet635
SMA Reversal Sequential MTF - Pure Confirmed Final V2SMA Reversal Sequential MTF - Detailed Indicator Manual This indicator identifies trend reversal points based on the shape of a Simple Moving Average (SMA) and monitors these signals across multiple timeframes (MTF). By synchronizing trends from various intervals, it provides a robust framework for identifying high-probability entry points. 1. Core Logic Overview The indicator detects "peaks" and "troughs" in the SMA to identify potential reversal points. Bullish Reversal (UP): Occurs when the SMA turns upward after a period of decline (forming a "trough"). Bearish Reversal (DN): Occurs when the SMA turns downward after a period of inclination (forming a "peak"). In addition to detecting these turns, the indicator tracks the high/low prices of the most recent reversal points on a "Confirmed Bar" basis. When the current price breaks these levels, it confirms a trend continuation or a breakout. 2. Full Description of Input Settings Basic Settings / Main Settings Use Short Period (5, 4, 7) / 短期設定を使用: true: Increases sensitivity to price movements by using shorter parameters (e.g., SMA 5). Suitable for scalping. false: Uses standard parameters (e.g., SMA 20). Suitable for day trading and swing trading. Timeframe Visibility / 時間足表示設定 Allows individual toggling of visibility for each timeframe's labels and lines. Show 1M to 1m / 1M〜1m表示: Individually enable or disable the calculation and display of data for Monthly (1M), Weekly (1W), Daily (Daily), 4H, 1H, 15M, 5M, and 1m timeframes. Hide Higher TF Settings on Lower TFs / 下位足での上位設定を非表示: When enabled, this removes lower timeframe data from higher timeframe charts to reduce visual noise. Drawing Options / 表示オプション Show Only Current TF Labels / 現在足のラベルのみ表示: If enabled, only labels corresponding to the chart's current interval (e.g., "5" labels on a 5M chart) will be displayed. Show Trendlines & Channels / トレンドライン&チャネルを表示: Automatically draws trendlines and parallel channels by connecting recent local reversal points on the current timeframe. Show Sequential Labels / 転換点ラベル表示: Displays timeframe labels (e.g., "15", "1H") at the exact point where the SMA reversed. Show Break Lines / ブレイクライン表示: Draws horizontal lines from the most recent peaks or troughs and displays a "BREAK" label when price crosses them. Break Label Offset / ブレイク文字の右オフセット: Adjusts the horizontal distance of the "BREAK" label from the current bar for better visibility. Additional Alert Settings / 追加アラート設定 Alert 1: Current + 2 Higher TFs Sync (Blue/Red) / アラート1: 現在・上位2つ同調: Triggers a notification when the trend (UP/DN) of the current chart's timeframe, the next higher timeframe, and the second higher timeframe all align. Alert 2: 4-TF Sync Including Current (Orange) / アラート2: 表示足を含む4足同調: Triggers a notification when four consecutive timeframes (Current + 3 Higher) align in the same direction. This is considered a high-conviction signal. 3. How to Read the Dashboard (Table) The compact table in the top-right corner displays the current trend status for key timeframes in real-time. Blue Background (UP): Indicates price has broken the recent peak, confirming an uptrend for that timeframe. Red Background (DN): Indicates price has broken the recent trough, confirming a downtrend for that timeframe. Gray Background: Indicates the trend status is yet to be determined or is in a neutral state. The table items are fixed to show 1D, 4H, 1H, 15M, and 5M from top to bottom. When all rows turn the same color, it indicates a strong market trend across the entire spectrum. 4. Key Feature: MTF Sync Alerts The primary advantage of this indicator is its automation of manual Multi-Timeframe Analysis. 3-TF Sync: On a 15M chart, if the 15M, 1H, and 4H trends align, a small Blue (Buy) or Red (Sell) label appears on the chart. 4-TF Sync: If the alignment extends to a 4th timeframe (e.g., up to the Daily timeframe on a 15M chart), an Orange label is displayed, signaling a very strong trend confluence. このインジケーター(SMA Reversal Sequential MTF)は、移動平均線(SMA)の形状からトレンドの転換点を特定し、それを複数の時間足(MTF)で監視・同期させることで、高精度なエントリーポイントを探るためのツールです。 以下に、すべてのインプット項目を含む詳細な説明をまとめました。 1. 概要と基本ロジック このインジケーターは、SMA(単純移動平均線)が「山」や「谷」を作ったポイントを転換点として認識します。 上昇転換: SMAが一定期間、下降した後に上昇へ転じた(谷を作った)タイミング。 下降転換: SMAが一定期間、上昇した後に下降へ転じた(山を作った)タイミング。 これに加えて、直近の転換点の価格(高値・安値)を「確定足」で更新し、そのラインを価格がブレイクした際にトレンドの継続や転換を判定します。 2. インプット項目の詳細 基本設定 / Main Settings 短期設定を使用 (5, 4, 7): true(チェックあり): 短期的な動きに敏感になります(SMA 5期間など)。スキャルピング向け。 false(チェックなし): 標準的な設定(SMA 20期間など)。デイトレード・スイング向け。 時間足表示設定 / Timeframe Visibility 各時間足のラベルやラインを表示するかどうかを個別に設定します。 1M〜1m表示: 月足(1M)から1分足(1m)まで、各MTFデータの計算・表示をオン/オフします。 下位足での上位設定を非表示: * 現在表示しているチャートより上位の時間足設定だけを表示し、ノイズを減らすためのスイッチです。 表示オプション / Drawing Options 現在足のラベルのみ表示: チェックすると、チャートの時間足と一致するラベル(例:5分足チャートなら「5」のラベル)のみ表示されます。 トレンドライン&チャネルを表示: 現在表示している足の直近の転換点同士を結び、トレンドラインと並行チャネルを自動描画します。 転換点ラベル表示: SMAが反転した位置に「15」や「1H」などの時間足ラベルを表示します。 ブレイクライン表示: 直近の転換点(高値・安値)から右側に水平線を引き、そこを価格が抜けた際に「BREAK」の文字を表示します。 ブレイク文字の右オフセット: 「BREAK」ラベルを右側にどれくらい離して表示するかを調整します。 追加アラート設定 / GRP_NEW_AL アラート1: 現在・上位2つ同調 (青/赤): 「表示中の足 + 1つ上 + 2つ上」の計3つのトレンド(UP/DN)が一致した瞬間に通知します。 アラート2: 表示足を含む4足同調 (オレンジ): 「表示中の足 + 上位3つ」の計4つのトレンドがすべて一致した強力なサイン時に通知します。 3. テーブル(ダッシュボード)の見方 画面右上に表示されるコンパクトなテーブルは、各時間足の現在のトレンド状態をリアルタイムで示しています。 青背景(UP): 直近で高値をブレイクし、上昇トレンドにある状態。 赤背景(DN): 直近で安値をブレイクし、下降トレンドにある状態。 灰背景: 状態が未確定なケース。 表示項目は上位足から順に 1D(日足), 4H, 1H, 15M, 5M となっており、これらが一色に染まるタイミングが環境認識上の強いトレンドを示唆します。 4. 特徴的な機能:MTF同調アラート このインジケーターの最大の強みは、手動でのマルチタイムフレーム分析を自動化している点です。 3足同調(SYNC): 15分足チャートであれば「15M・1H・4H」が同じ方向を向いた時にチャート上に青(買い)または赤(売り)の小さなラベルが表示されます。 4足同調(4-TF SYNC): さらに上位の足(15分足なら日足まで)が同調すると、オレンジ色のラベルが表示され、より強い根拠となります。Penunjuk Pine Script®oleh hmp5below49
SHFE Silver Premium vs COMEX (USD/oz)This indicator measures the SHFE–COMEX silver premium/discount in USD per troy ounce. SHFE silver is quoted in CNY per kilogram, so the script first converts SHFE:AG1! into USD/oz using the current USD/CNY exchange rate and the exact kg → troy oz factor (32.1507466). It then calculates: Premium (USD/oz) = SHFE_USD/oz − COMEX_USD/oz How to interpret: Positive bars: SHFE is trading above COMEX (premium) Negative bars: SHFE is trading below COMEX (discount) Persistent regimes can reflect currency dynamics, regional liquidity, import/export constraints, and shifts in industrial demand. How to use: Add this indicator beneath the companion overlay indicator “SHFE Silver Price Discovery (USD/oz)” to keep the price chart readable while still visualizing divergence. Watch for sustained premium expansions/contractions as inter-market confirmation signals, especially during volatile periods. This indicator is intended for macro and inter-market analysis, not short-term scalping.Penunjuk Pine Script®oleh HighGecko17
SHFE Silver Price Discovery (USD/oz)This indicator converts Shanghai Futures Exchange (SHFE) silver futures into USD per troy ounce and optionally overlays COMEX silver futures for direct, same-unit comparison. SHFE silver is quoted in CNY per kilogram, while COMEX is quoted in USD per troy ounce. To make SHFE prices comparable on the same chart, the script: pulls SHFE:AG1! close (CNY/kg) pulls USD/CNY FX rate converts to USD/oz using the exact kg → troy oz factor (32.1507466) Why this is useful: SHFE pricing often reflects different drivers than Western paper markets (currency effects, local liquidity, industrial demand, and regional availability). Normalizing SHFE into USD/oz lets traders and investors monitor inter-market alignment and spot periods where Eastern pricing diverges from COMEX. How to use: Use the SHFE USD/oz line as a “physical-demand-sensitive” reference. Overlay COMEX to compare regional pricing and identify multi-week divergence regimes. For the premium/discount histogram, use the companion indicator: “SHFE Silver Premium vs COMEX (USD/oz)”. This indicator is designed for macro and inter-market analysis rather than short-term scalping.Penunjuk Pine Script®oleh HighGecko46