scalping2sahilnarkarThis is the a bit edited to the previous script. As per regulations i have kept this as an open script.
The only Difference to confirm your support resistance levels is an addition of simple moving average 21.
Rules are the Same-
- Trade long when above vwap and 21EMA
- Trade Short when below the VWAP.
EMA21 and EMA50 acts as support where as SMA 21 will show the Trend.
Even though This script is purely based on EMA's, i tend to find the SMA21 as a good Support resistance/support while taking a trade as it avoids the wipsaws while taking an entry.
Please Note-
-This is a scalping Script so book profits and keep stoplosses accordingly.
-When you put this script on the screen, remove everything except EMA9,EMA21,EMA50,EMA200 and the SMA21(keep the arrows and edit the arrows as you want)
-This is not a plug and play script so tune it as you want on the settings.
-Please consider using a VWAP always.
-I have made this script after putting it into many indian stocks you have to tune it as per your stock exchange.
Cari dalam skrip untuk "scalping"
Trench Cross ScalperThe original script was posted on ProRealCode by user Nicolas.
This indicator is an attempt of scalping strategy by crossing the mean high or low weigthed price over a short "n" period. This 2 lines represent the black "trench" on screenshots attached.
When signal line (blue one) crossing the buy trigger one (dotted green one) a buy signal should occur and vice-versa for a sell signal (when crossing the dotted red one). I add an option to draw the white signal line as the close price value of the high/low ones if they are respectively above or below the trench' buy or sell lines trigger.
The yellow green and red brick lines serve as stoploss.
The indicator can be use alone with no price chart as its values are derivated from it, of course if you dont mind about candlesticks informations.
I think enter/exit trades should occur very quickly, as it were designed for scalping trading purpose. I didn't have much time to test it for a long period, so here it is as a concept indicator, despite that, it does have sense.

Scalping Line Strategy📌 Scalping Line Strategy – A Precision Crossover System
🔎 Overview
The Scalping Line Strategy is a short-term trading system built around the concept of momentum-driven crossovers between a smoothed moving average filter and a fast signal line. It is designed for scalpers and intraday traders who seek clear entry signals, minimal lag, and adaptive filtering to fit volatile market conditions.
At its core, the strategy uses a custom signal line ("Scalping Line"), which is derived from the difference between a double-smoothed moving average and a shorter-period signal line. Trade entries are triggered when this Scalping Line crosses above or below zero, providing a clean and rules-based framework for both long and short setups.
⚙️ Core Logic
Main Trend Filter – A double-smoothed moving average is calculated over a configurable period (default 100). This reduces noise and provides a more robust backbone for scalping signals.
Percent-Based Filter – To avoid false signals, a customizable percentage filter adjusts how closely the system “respects” price deviations from the moving average. This helps filter out insignificant fluctuations.
Signal Line – A shorter-period simple moving average (default 7) provides faster responsiveness to recent price action.
Scalping Line (SLI) – Calculated as the difference between the fast signal line and the smoothed moving average. When the SLI crosses zero, it signals a potential momentum shift.
SLI > 0 → Momentum bias is bullish.
SLI < 0 → Momentum bias is bearish.
🎯 Trade Direction & Flexibility
Trade Direction Control:
Choose between Long Only, Short Only, or Both to tailor the system to your trading style.
Signal Flip Option:
By default, long entries occur when the SLI crosses below zero, and shorts when it crosses above zero. This orientation can be flipped, allowing for alternative interpretations of the signals depending on how you want to capture momentum in your market.
🕒 Time Window Filtering
For intraday traders, a time filter can be enabled to restrict signals to specific trading sessions (e.g., 9 AM – 4 PM EST). This is particularly useful when trading assets such as equities or futures that have strong intraday volatility windows.
📈 Visuals & Clarity
Scalping Line Plot: Displayed as a dynamic oscillator around a zero baseline.
Histogram Fill: Green when above zero (bullish bias), red when below zero (bearish bias).
Signal Markers: Clear arrows mark long and short entries at crossover points.
Zero Line Reference: A flat gray line at zero assists in visually gauging momentum shifts.
🚀 Strategy Execution
Long Entry: Triggered when SLI crosses below zero (or above zero if flip is enabled) within allowed session hours.
Short Entry: Triggered when SLI crosses above zero (or below zero if flip is enabled) within allowed session hours.
Built-in Signal Cancels: Pending entries are canceled if conditions are no longer valid, ensuring no stale trades remain active.
✅ Best Use Cases
Markets: Works across equities, forex, crypto, and futures with sufficient intraday volatility.
Timeframes: Most effective on 1m to 15m charts for scalping setups, but adaptable to higher frames for swing trading.
Style: Traders who appreciate simple, rules-based momentum crossovers will find this system easy to follow and highly adaptable.
⚠️ Risk Management Note
This strategy is strictly an entry signal framework. Position sizing, stop-loss, and take-profit rules must be overlaid based on your risk management style. Always validate results with backtesting and forward testing before applying to live trading accounts.
📜 Final Thoughts
The Scalping Line Strategy offers a refined, easy-to-interpret approach to intraday trading. By combining smoothed moving averages, adaptive filtering, and flexible signal options, it helps traders identify short-term momentum shifts with clarity and confidence, making it a highly configurable tool for scalping-focused strategies.

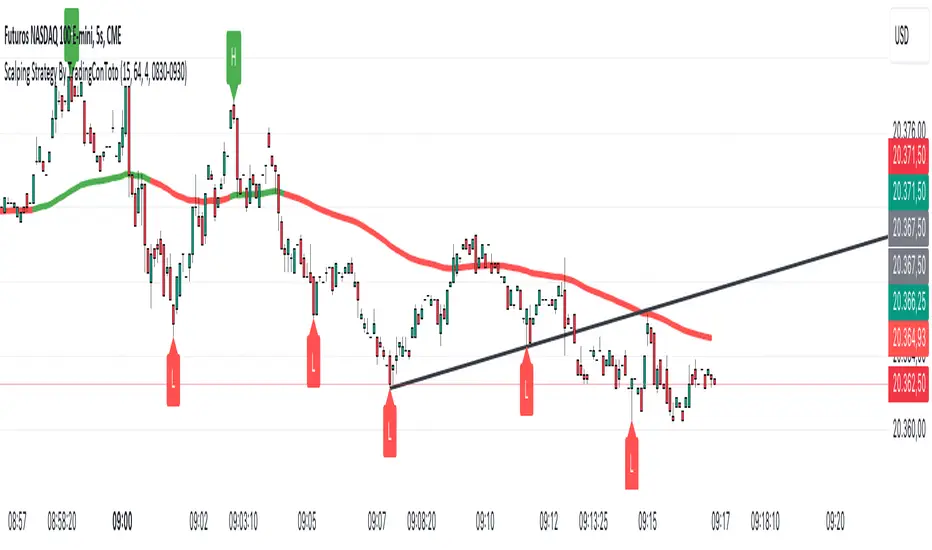
Scalping Strategy By TradingConTotoScript Description: "Scalping Strategy By TradingConToto"
This scalping strategy is designed to trade in volatile markets, taking advantage of rapid price movements. It uses pivots to identify key entry and exit points, along with exponential moving averages (EMAs) to determine the overall trend.
Key Features:
Dynamic Pivots: Calculates pivot highs and lows to identify support and resistance zones, improving entry accuracy.
Market Trend Analysis: Utilizes a 100-period EMA for long-term trend analysis and a 25-period EMA for short-term trends, facilitating informed decision-making.
Automated Entry and Exit: Generates buy and sell signals based on EMA crossovers and specific market conditions, ensuring you don't miss opportunities.
Risk Management: Allows you to set take profit and stop loss levels tailored to market volatility, using the ATR for effective risk management.
User-Friendly Interface: Easily customize strategy parameters such as pivot range, stop loss and take profit pips, and spread.
Requirements:
Ideal for use on short time frames during high activity sessions, like the configured scalping session.
Activate buy and sell options according to your preference and analyze performance using TradingView’s tools.
Note:
This script is a tool and does not guarantee results. It is recommended to test in a simulated environment before applying it to real accounts.
Optimize your scalping operations and enhance your market performance with this effective strategy!
Scalping 15min: EMA + MACD + RSI + ATR-based SL/TP📈 Strategy: 15-Minute Scalping — EMA + MACD + RSI + ATR-based SL/TP
This scalping strategy is designed for 15-minute charts and combines trend-following and momentum confirmation with dynamic stop loss and take profit levels based on volatility.
🔧 Indicators Used:
EMA 50 — identifies the main trend
MACD Histogram — confirms momentum direction
RSI (14) — filters overbought/oversold conditions
ATR (14) — dynamically sets SL and TP based on market volatility
📊 Entry Conditions:
Long Entry:
Price is above EMA 50
MACD histogram is positive
RSI is above 50 but below 70
Short Entry:
Price is below EMA 50
MACD histogram is negative
RSI is below 50 but above 30
🛑 Risk Management:
Stop Loss: 1×ATR (user-configurable)
Take Profit: 2×ATR (user-configurable)
These values can be adjusted in the script inputs depending on your risk/reward preference or market conditions.
⚠️ Notes:
Strategy is optimized for scalping fast-moving pairs (e.g. crypto, forex).
Works best in trending markets.
Use backtesting and forward testing before live trading.

Scalping Indicator + BJ Signal V3This indicator is designed for 1-minute scalping, combining momentum exhaustion, trend confirmation, and precise entry timing into a single visual tool.
It integrates the following core elements:
Williams %R to identify extreme overbought and oversold conditions
Stochastic (80 / 20 logic) to detect exhaustion, rejection, and re-entry timing
MACD histogram for momentum confirmation
SMA (7) as a short-term trend filter
Sequential-style exhaustion counts (8 / 9) used as contextual reference only
🔹 Signal Logic Overview
Signals are generated exclusively on the 1-minute timeframe
Buy signals focus on:
Exhaustion in oversold conditions
Stochastic recovery from the 20 level
Momentum turning positive on the MACD histogram
Sell signals focus on:
Exhaustion in overbought conditions
Stochastic rejection from the 80 level
Momentum turning negative on the MACD histogram
Background colors highlight potential exhaustion zones, while arrows distinguish between:
Real-time (unconfirmed) signals
Confirmed (closed bar) signals
This design helps traders avoid premature entries during fast market conditions.
⚠️ Important Notes
This indicator is not a standalone trading system
Sequential-style counts are not entry signals by themselves
Always combine with:
Market structure
Session awareness (e.g. high-volatility opens)
Proper risk management
🎯 Best Use Case
1-minute scalping
Short-term mean reversion after momentum exhaustion
Traders who prefer clear, non-repainting visual signals

Scalping Strategy: FVG + Engulfing
This is a scalping strategy based on the Fair Value Gap (FVG) and Engulfing pattern confirmation. It identifies the high and low of the first 5-minute candle after the 9:30 AM EST market open and waits for a breakout supported by a Fair Value Gap. A trade is only triggered after a retest of the FVG zone followed by an engulfing candle in the direction of the breakout. Trades are entered with a fixed 3:1 risk-to-reward ratio and limited to 2 entries per trading day to avoid overtrading. Ideal for NASDAQ scalping on a 1-minute chart.

Scalping Candle [Crak x MMT]The Scalping Candle is a TradingView indicator designed for scalping strategies, identifying potential bullish and bearish engulfing patterns on price charts. It overlays directly on the chart and marks specific candle patterns with visual signals, helping traders spot short-term trading opportunities. The indicator includes a customizable bias filter to focus on bullish, bearish, or neutral market conditions.
Features
Overlay Indicator : Displays bullish and bearish signals directly on the price chart.
Bias Filter : Allows users to select a market bias ('Bullish', 'Bearish', or 'Neutral') to filter signals based on their trading preference.
Visual Signals : Plots green upward triangles below bullish candles and red downward triangles above bearish candles.
Alerts : Generates alerts for bullish and bearish engulfing patterns, enabling timely notifications for trade setups.
How It Works
The indicator analyzes the relationship between the current and previous candles to detect engulfing patterns:
Bullish Engulfing : Triggered when the current candle's low is at or below the previous candle's low, and its close is at or above the previous candle's midpoint. This signal is displayed only if the bias filter is set to 'Neutral' or 'Bullish'.
Bearish Engulfing : Triggered when the current candle's high is at or above the previous candle's high, and its close is at or below the previous candle's midpoint. This signal is displayed only if the bias filter is set to 'Neutral' or 'Bearish'.
The previous candle's midpoint is calculated as the average of its high and low prices.
Usage
- Add to Chart : Apply the indicator to any TradingView chart.
- Configure Bias Filter :
Neutral : Displays both bullish and bearish signals.
Bullish : Displays only bullish signals.
Bearish : Displays only bearish signals.
- Interpret Signals :
Green upward triangle below a candle indicates a potential bullish reversal.
Red downward triangle above a candle indicates a potential bearish reversal.
- Set Alerts : Use the built-in alert conditions to receive notifications when bullish or bearish engulfing patterns are detected.
Settings
Bias Filter : Choose between 'Neutral', 'Bullish', or 'Bearish' to control which signals are displayed.
Shape Size : Signals are plotted as small triangles for minimal chart clutter.
Alert Conditions : Enable alerts for 'Bullish Engulfing Detected' or 'Bearish Engulfing Detected' to stay informed of new signals.
Ideal Use Case
This indicator is tailored for scalpers and short-term traders looking to capitalize on quick price movements driven by engulfing candle patterns. It works best on 15-minute chart and can be combined with other technical tools for confirmation.

Scalping Swing Trading Tool R1-4 by JustUncleLDescription:
This study project is a "Scalping Swing trading Tool" and is an alternative to the "Scalping Pullback Tool R1". It is designed for a two pane TradingView chart layout :
the first pane set to 15min Time Frame;
the second pane set to 1min Time Frame(TF).
The tools incorporates the majority of the indicators needed to analyse and scalp Trends for Swings, PullBacks and reversals on 15min charts and 1min charts.
Incorporated within this tool are the following indicators:
1. The following EMAs are drawn automatically:
Green = EMA89 (15min TF) = EMA75 (1min TF)
Blue = EMA200 (15min TF) = EMA180 (1min TF)
Black = EMA633 (15min TF) = EMA540 (1min TF)
2. The 10EMA (default) High/Low+Close Price Action Channel (PAC), the PAC channel
display is disabled by default.
3. Optionally display Fractals and optional Fractal levels
4. Optional HH, LH, LL, HL finder.
5. Coloured coded Bar high lighting based on the PAC:
blue = bar closed above PAC
red = bar closed below PAC
gray = bar closed inside PAC
lime Line = EMA10 of bar close
6. Pivot points (disables Fractals automatically when selected) with optional labels.
7. EMA5-12 Channel is displayed by default.
8. EMA12-36 Ribbon is displayed by default
9. Optionally display EMA36 and PAC instead of EMA12-36 Ribbon.
Set up and hints:
I am unable to provide a full description here, as Pullback Trading incorporates a full trading Methodology, there are a number of articles and books written on the subject.
Set to two pane TradingView chart, set first pane to 15Min and second to 1min.
Set the chart to Heikin Ashi Candles (optional).
I also add a "Sweetspot Gold2" indicator to the chart as well to help with support and resistance finding and shows where the important "00" lines are.
Use the EMA200 on the 15min pane as the anchor. So when prices above EMA200 we only trade long (buy) and when prices below the EMA200 we only trade short (sell).
On the 15min chart draw any obvious Vertical Trend Lines (VTL), use Pivots point as a guide.
On the 15min chart what we’re looking for price to Pullback into the EMA5-12 Channel or EMA12-36 ribbon, we draw Trendlines uitilising the Pivot points or Fractals to guide your TL drawing.
On the 15min chart look for the trend to resume and break through the drawn TL. The bar color needs to change back to the trend direction colour to confirm as a break.
Now this break can be traded as a 15min trade or now look to the 1min chart.
On the 1min chart draw any Pullback into any of the EMAs.
On the 1min chart look for the trend to resume and break through the drawn TL. The bar color needs to change back to the trend direction colour to confirm as a break.
Now this break can be traded as a 1min trade.
There is also an option to select Pristine (ie Ideal) filtered Fractals, which look like tents or V shape 5-candle patterns. These are actually used to calculate the Pivot points as well.
Other than the "SweetSpot Gold2" indicator, you should not need any other indicator to successfully trade trends for Pullbacks and reversals. If you really want another indicator use the AO (Awesome Oscillator) as it is momentum based.

Scalping EMA9/15 This indicator is designed for high-accuracy intraday scalping based on a refined version of the popular EMA9–EMA15 trend-following technique.
It filters weak or premature entries by requiring a retest of the EMA zone before generating a Buy/Sell signal — drastically reducing false breakouts.

Scalping, Swing Pro: Urban Towers + Bollinger(0.5)+ WMA by KidevThis indicator combines narrow Bollinger Bands (σ = 0.5) with a Weighted Moving Average (WMA-96) to provide traders with a reliable framework for identifying both short-term scalps and medium-term swing setups.
Bollinger Bands (0.5σ):
Traditional Bollinger Bands at 2σ cover ~95% of price movement, while 0.5σ bands narrow the focus to ~50% of price activity. This tighter structure makes them ideal for detecting volatility contractions, consolidations, and early breakout signals.
WMA-96 as Trend Reference:
The 96-period WMA acts as a slower, more stable directional guide. Unlike shorter WMAs, this longer setting filters noise and serves as a reference line for the dominant trend. Traders can use it as an anchor for intraday or swing positions.
Scalping & Swing Benefits:
Price holding above the WMA-96 while staying near the upper 0.5σ band often signals strength.
Contractions (squeezes) in the 0.5σ band followed by expansion frequently mark breakout zones.
Pullbacks toward the WMA-96 combined with band signals can act as re-entry or risk-defined trade areas.
This script provides a balanced view of momentum and stability — the 0.5σ bands reveal short-term volatility shifts, while the WMA-96 grounds the trader in the prevailing trend.

Scalping Strategy (5min)This indicator is designed for scalping strategies on a 5-minute timeframe. It generates signals based on two RSI crossovers and incorporates moving averages to identify trends. Additionally, a Bollinger Band is included to eliminate the need for an additional Bollinger Band on the chart.
Please note that this indicator does not guarantee 100% accurate signals and may produce false signals. It is recommended to use this indicator in conjunction with other indicators such as Stochastic, MACD, SuperTrend, or any other suitable indicators to enhance the accuracy of trading decisions.
1) Signal Generation: The indicator generates buy and sell signals based on two RSI crossovers. A buy signal is generated when the fast RSI crosses above the slow RSI, indicating potential bullish momentum. Conversely, a sell signal is generated when the fast RSI crosses below the slow RSI, suggesting potential bearish momentum.
2) To adjust the indicator to your specific chart and trading preferences, you have the flexibility to modify the RSI and moving average (MA) values. By changing the RSI values (slow RSI length and fast RSI length), you can fine-tune the sensitivity of the RSI crossovers to suit different timeframes and market conditions. Similarly, adjusting the MA values (slow MA period and fast MA period) allows you to adapt the indicator to the desired trend identification and short-term trend confirmation.
3) Pay attention to trades that are confirmed by the short-term moving average (MA) aligning with the desired direction. For buy signals, ensure that the short MA is tending upward, indicating a potential uptrend. For sell signals, confirm that the short MA is trending downward, suggesting a potential downtrend.
4) Moving Averages: The indicator uses a 200-period moving average (MA) to identify the overall trend and a short-term MA for additional confirmation.
5) Bollinger Band: The included Bollinger Band is not directly used in the indicator's calculations. However, it is provided for convenience so that users don't need to add another Bollinger Band to their chart separately.
6) Exercise caution when the short MA is below the 200-period MA but showing signs of attempting an upward move. These situations may indicate a potential reversal or consolidation, and it is advisable to avoid taking trades solely based on the 200-period MA crossover in such cases.
Remember that these guidelines are intended to provide additional insights and should be used in combination with your trading judgment and analysis.

scalping with market facilitationThis strategy is for scalping low timeframes for 10 pips. I have yet to see a strategy with this unique combo of indicators.
First we have volume indicator market facilitation, where we are looking for volume and mfi to be up, then we want the adx 5 to be above level 30 and above its ema period 3, then if these conditions are good we take shorts when ema 8 is below ema 100 and longs when ema8 is above ema 100 with parabolic sar in its propet place, also to verify trend we have obv over or under its ema of 55 and macd line over its signal line.
I have heikenashi bars on with the regular priceline showing so j see actual price levels, when i get a buy signal i set a buystop above the high of that bar and have a stoploss of 7.5 pips and a take profit of 10 pips, reverse for sells, i have to use metatrader to trade so i use this as my signals to trade.
Note this is not advice trade at your own risk no guarantees in anything in life, but i wanted to share this for it is helping me with my trades to be more strict and semi mechanical. I use it for forex time frames 1 3 5 15 mjn

Scalping Trading System bot Crypto and StocksThis is a trend trading strategy scalping bot that can work with any type of market. However I concluded my tests so far with Crypto, Stocks and Forex, and with optimizations always could be found some profitable settings.
Indicators
SImple Moving Average
Exponential Moving Average
Keltner Channels
MACD Histogram
Stochastics
Rules for entry
long= Close of the candle bigger than both moving averages and close of the candle is between the top and bot levels from Keltner. At the same time the macd histogram is negative and stochastic is below 50.
short= Close of the candle smaller than both moving averages and close of the candle is between the top and bot levels from Keltner. At the same time the macd histogram is positive and stochastic is above 50.
Rules for exit
We exit when we meet an opposite reverse order.
This strategy has no risk management inside, so use it with caution !

scalping against trapped countertrendAbstract
This script attempts to find the end of countertrend.
This script uses oscillators to measure long term and short period trends. When the long term trend keeps positive and clear short term period is over, this script provides a buy signal.
This script does not contain pullback, cut loss and re-enter. You need to add it manually.
Introduction
Many traders want to buy when long term trend is bullish and short term pullback is over.
This is because we can take advantage to the emotion of countertrend traders.
Countertrend traders realizes their profit is finite and therefore want to protect their profit well and limit their loss.
This script is inspired by a searchable trading strategy video.
The video mentioned 4 points.
(1) long term trend. The video did not spend much ink on this point. You can use any method to observe.
(2) clear pullback bar (at least 50% body)
(3) weak bar after clear pullback
(4) entry trigger buy stop
This script attempts to quantize these points to determine trading direction.
This script is originally designed for timeframes lower than examples in the video but you can apply it on any timeframe.
Computing and Adjusting
(1) long term trend
This script uses smoothed stochastic.
(2) clear pullback bar
Since this script is originally designed for timeframes lower than examples in the video, so the condition becomes:
RSI is low enough
(3) weak bar after clear pullback
RSI goes back from low level.
(4) entry trigger buy stop
This script does not include this condition.
You can decide enter when buy stop or pullback.
Parameters
x_src : the value for computing oscillators
x_len_a : how many bars for measuring short term trend
x_len_b : how many bars for measuring long term trend
x_k_b : smooth long term trend, the average value of stochastic values
x_changk = check if clear short term pullback appears recently. 1 means do not use, larger numbers means how long of periods to check.
x_rsi_ct : threshold of short term pullback clear
x_rsi_ft : threshold of short term pullback end
Reading numbers in Strategy Tester
Most possible loss :
(1) to find rational pullback. Generally 1/3 to 2/3 atr.
(2) to find cut loss distance. Generally 1 to 2 atr.
Most possible profit :
to find if trading the opposite direction against this script is profitable.
Conclusion
This script can suggest us trading direction.
Waiting for pullback can reduce risk, compared to buy stop.
This script does not provide good signals in sideways markets.
Reference
A searchable trading strategy video

scalping low lag tema etalCredit for original idea goes to 1 min forex scalping by mikegoryunov
Changes include several lower lag filters (See line 3 for a list)
and values for profit, loss, and trail_points (See lines 48:53)
a, b, & c represent fast, medium, and slow filters. Basic idea is to monitor
crossovers of the three filters to determine buy/sells. Exits occur quickly within
the next time interval.
Note that this may be used for stocks and forex. The time interval can vary widely.
I have concerns about how to incorporate transaction costs with so many transactions.

Scalping Line Indicator"A derivated indicator of the stair step moving average exploration. This time, the stairstep MA (the main trend) represent the center of the oscillator.
The signal line (maroon line) is the difference between this center and a simple moving average of 7 periods by default.
Trade signals seems pretty effective on tick charts representation. Take long when signal line cross above zero and short below it. Of course, as always objectives and stoploss protection are your responsabilities
You can play with different parameters to sweet any other instruments."
Coded referring the"Scalping Line Indicator" from prorealcode for Tradingview users after one of my followers asked me to do so.

Scalping with triple EMAUsing EMA5 (Exponential Moving Average) as the main trend of price, the intersection with EMA10 will signal the point of entry (go long, go short) reasonable. At this point, I pushed the EMA10 at high price to sell sooner and at low price to buy early. More specific:
- When the red line crosses the blue line, the signal is the Buy.
- When the red line cut the green line, the signal is Sell.
Efficient with short trading tactics.
Notes: Combined with pinbar signs and practal indicators will yield better results
Williams R Zone Scalper v1.0[BullByte]Originality & Usefulness
Unlike standard Williams R cross-over scripts, this strategy layers five dynamic filters—moving-average trend, Supertrend, Choppiness Index, Bollinger Band Width, and volume validation —and presents a real-time dashboard with equity, PnL, filter status, and key indicator values. No other public Pine script combines these elements with toggleable filters and a custom dashboard. In backtests (BTC/USD (Binance), 5 min, 24 Mar 2025 → 28 Apr 2025), adding these filters turned a –2.09 % standalone Williams R into a +5.05 % net winner while cutting maximum drawdown in half.
---
What This Script Does
- Monitors Williams R (length 14) for overbought/oversold reversals.
- Applies up to five dynamic filters to confirm trend strength and volatility direction:
- Moving average (SMA/EMA/WMA/HMA)
- Supertrend line
- Choppiness Index (CI)
- Bollinger Band Width (BBW)
- Volume vs. its 50-period MA
- Plots blue arrows for Long entries (R crosses above –80 + all filters green) and red arrows for Short entries (R crosses below –20 + all filters green).
- Optionally sets dynamic ATR-based stop-loss (1.5×ATR) and take-profit (2×ATR).
- Shows a dashboard box with current position, equity, PnL, filter status, and real-time Williams R / MA/volume values.
---
Backtest Summary (BTC/USD(Binance), 5 min, 24 Mar 2025 → 28 Apr 2025)
• Total P&L : +50.70 USD (+5.05 %)
• Max Drawdown : 31.93 USD (3.11 %)
• Total Trades : 198
• Win Rate : 55.05 % (109/89)
• Profit Factor : 1.288
• Commission : 0.01 % per trade
• Slippage : 0 ticks
Even in choppy March–April, this multi-filter approach nets +5 % with a robust risk profile, compared to –2.09 % and higher drawdown for Williams R alone.
---
Williams R Alone vs. Multi-Filter Version
• Total P&L :
– Williams R alone → –20.83 USD (–2.09 %)
– Multi-Filter → +50.70 USD (+5.05 %)
• Max Drawdown :
– Williams R alone → 62.13 USD (6.00 %)
– Multi-Filter → 31.93 USD (3.11 %)
• Total Trades : 543 vs. 198
• Win Rate : 60.22 % vs. 55.05 %
• Profit Factor : 0.943 vs. 1.288
---
Inputs & What They Control
- wrLen (14): Williams R look-back
- maType (EMA): Trend filter type (SMA, EMA, WMA, HMA)
- maLen (20): Moving-average period
- useChop (true): Toggle Choppiness Index filter
- ciLen (12): CI look-back length
- chopThr (38.2): CI threshold (below = trending)
- useVol (true): Toggle volume-above-average filter
- volMaLen (50): Volume MA period
- useBBW (false): Toggle Bollinger Band Width filter
- bbwMaLen (50): BBW MA period
- useST (false): Toggle Supertrend filter
- stAtrLen (10): Supertrend ATR length
- stFactor (3.0): Supertrend multiplier
- useSL (false): Toggle ATR-based SL/TP
- atrLen (14): ATR period for SL/TP
- slMult (1.5): SL = slMult × ATR
- tpMult (2.0): TP = tpMult × ATR
---
How to Read the Chart
- Blue arrow (Long): Williams R crosses above –80 + all enabled filters green
- Red arrow (Short) : Williams R crosses below –20 + all filters green
- Dashboard box:
- Top : position and equity
- Next : cumulative PnL in USD & %
- Middle : green/white dots for each filter (green=passing, white=disabled)
- Bottom : Williams R, MA, and volume current values
---
Usage Tips
- Add the script : Indicators → My Scripts → Williams R Zone Scalper v1.0 → Add to BTC/USD chart on 5 min.
- Defaults : Optimized for BTC/USD.
- Forex majors : Raise `chopThr` to ~42.
- Stocks/high-beta : Enable `useBBW`.
- Enable SL/TP : Toggle `useSL`; stop-loss = 1.5×ATR, take-profit = 2×ATR apply automatically.
---
Common Questions
- * Why not trade every Williams R reversal?*
Raw Williams R whipsaws in sideways markets. Choppiness and volume filters reduce false entries.
- *Can I use on 1 min or 15 min?*
Yes—adjust ATR length or thresholds accordingly. Defaults target 5 min scalping.
- *What if all filters are on?*
Fewer arrows, higher-quality signals. Expect ~10 % boost in average win size.
---
Disclaimer & License
Trading carries risk of loss. Use this script “as is” under the Mozilla Public License 2.0 (mozilla.org). Always backtest, paper-trade, and adjust risk settings to your own profile.
---
Credits & References
- Pine Script v6, using TradingView’s built-in `ta.supertrend()`.
- TradingView House Rules: www.tradingview.com
Goodluck!
BullByte

Pro Scalper AI [BullByte]The Pro Scalper AI is a powerful, multi-faceted scalping indicator designed to assist active traders in identifying short-term trading opportunities with precision. By combining trend analysis, momentum indicators, dynamic weighting, and optional AI forecasting, this tool provides both immediate and latched trading signals based on confirmed (closed bar) data—helping to avoid repainting issues. Its flexible design includes customizable filters such as a higher timeframe trend filter, and adjustable settings for ADX, ATR, and Hull Moving Average (HMA), giving traders the ability to fine-tune the strategy to different markets and timeframes.
Key Features :
- Confirmed Data Processing :
Utilizes a helper function to lock in price and volume data only from confirmed (closed) bars, ensuring the reliability of signals without the risk of intrabar repainting.
- Trend Analysis :
Employs ADX and Directional Movement (DI) calculations along with a locally computed HMA to detect short-term trends. An optional higher timeframe trend filter can further refine the analysis.
- Flexible Momentum Modes :
Choose between three momentum calculation methods—Stochastic RSI, Fisher RSI, or Williams %R—to match your preferred style of analysis. This versatility allows you to optimize the indicator for different market conditions.
- Dynamic Weighting & Volatility Adjustments :
Adjusts the contribution of trend, momentum, volatility, and volume through dynamic weighting. This ensures that the indicator responds appropriately to varying market conditions by scaling its sensitivity with user-defined maximum factors.
- Optional AI Forecast :
For those who want an extra edge, the built-in AI forecasting module uses linear regression to predict future price moves and adjusts oscillator thresholds accordingly. This feature can be toggled on or off, with smoothing options available for more stable output.
- Latching Mode for Signal Persistenc e:
The script features a latching mechanism that holds signals until a clear reversal is detected, preventing whipsaws and providing more reliable trade entries and exits.
- Comprehensive Visualizations & Dashboard :
- Composite Oscillator & Dynamic Thresholds : The oscillator is plotted with dynamic upper and lower thresholds, and the area between them is filled with a color that reflects the active trading signal (e.g., Strong Buy, Early Sell).
- Signal Markers : Both immediate (non-latching) and stored (latched) signals are marked on the chart with distinct shapes (circles, crosses, triangles, and diamonds) to differentiate between signal types.
- Real-Time Dashboard : A customizable dashboard table displays key metrics including ADX, oscillator value, chosen momentum mode, HMA trend, higher timeframe trend, volume factor, AI bias (if enabled), and more, allowing traders to quickly assess market conditions at a glance.
How to Use :
1. S ignal Interpretation :
- Immediate Signals : For traders who prefer quick entries, the indicator displays immediate signals such as “Strong Buy” or “Early Sell” based on the current market snapshot.
- Latched Signals : When latching is enabled, the indicator holds a signal state until a clear reversal is confirmed, offering sustained trade setups.
2. Trend Confirmation :
- Use the HMA trend indicator and the optional higher timeframe trend filter to confirm the prevailing market direction before acting on signals.
3. Dynamic Thresholds & AI Forecasting :
- Monitor the dynamically adjusted oscillator thresholds and, if enabled, the AI bias to gauge potential shifts in market momentum.
4. Risk Management :
- Combine these signals with additional analysis and sound risk management practices to determine optimal entry and exit points for scalping trades.
Disclaimer :
This script is provided for educational and informational purposes only and does not constitute financial advice. Trading involves risk, and past performance is not indicative of future results. Always perform your own analysis and use proper risk management strategies before trading.

Dynamic Buy/Sell VisualizationDynamic Trend Visualization Indicator
Description:
This simple and easy to use indicator has helped me stay in trades longer.
This indicator is designed to visually represent potential buy and sell signals based on the crossover of two Simple Moving Averages (SMA). It's crafted to assist traders in identifying trend directions in a straightforward manner, making it an excellent tool for both beginners and experienced traders.
Features:
Customizable Moving Averages: Users can adjust the period length for both short-term (default: 10) and long-term (default: 50) SMAs to suit their trading strategy.
Visual Signals: Dynamic lines appear at the points of SMA crossover, with labels to indicate 'BUY' or 'SELL' opportunities.
Color and Style Customization: Customize the appearance of the buy and sell lines for better chart readability.
Alert Functionality: Alerts are set up to notify users when a crossover indicating a buy or sell condition occurs.
How It Works:
A 'BUY' signal is generated when the short-term SMA crosses above the long-term SMA, suggesting an upward trend.
A 'SELL' signal is indicated when the short-term SMA crosses below the long-term SMA, pointing to a potential downward trend.
Use Cases:
Trend Following: Ideal for markets with clear trends. For example, if trading EUR/USD on a daily chart, setting the short SMA to 10 days and the long SMA to 50 days might help in capturing longer-term trends.
Scalping: In a volatile market, setting shorter periods (e.g., 5 for short SMA and 20 for long SMA) might catch quicker trend changes, suitable for scalping.
Examples of how to use
* Short-term for Quick Trades:
SMA 5 and SMA 21:
Purpose: This combination is tailored for day traders or those looking to engage in scalping. The 5 SMA will react rapidly to price changes, providing early signals for buy or sell opportunities. The 21 SMA, being a Fibonacci number, offers a slightly longer-term view to confirm the short-term trend, helping to filter out minor fluctuations that might lead to false signals.
* Middle-term for Swing Trading:
SMA 10 and SMA 50:
Purpose: Suited for swing traders who aim to capitalize on medium-term trends. The 10 SMA picks up on immediate market movements, while the 50 SMA gives insight into the medium-term direction. This setup helps in identifying when a short-term trend aligns with a longer-term trend, providing a good balance for trades that might last several days to a couple of weeks.
* Long-term Trading:
SMA 50 and SMA 200:
Purpose: Investors focusing on long-term trends would benefit from this pair. The crossover of the 50 SMA over the 200 SMA can indicate the beginning or end of major market trends, ideal for making decisions about long-term holdings that might span months or years.
Example Strategy if not using the Buy / Sell Label Alerts:
Entry Signal: Enter a long position when the shorter SMA crosses above the longer SMA. For example:
SMA 10 crosses above SMA 50 for a medium-term bullish signal.
Exit Signal: Consider exiting or initiating a short position when:
SMA 10 crosses below SMA 50, suggesting a bearish turn in the medium-term trend.
Confirmation: Use these crossovers in conjunction with other indicators like volume or momentum indicators for better confirmation. For instance, if you're using the 5/21 combination, look for volume spikes on crossovers to confirm the move's strength.
When Not to Use:
Sideways or Range-Bound Markets: The indicator might generate many false signals in a non-trending market, leading to potential losses.
High Volatility Without Clear Trends: Rapid price movements without a consistent direction can result in misleading crossovers.
As a Standalone Tool: It should not be used in isolation. Combining with other indicators like RSI or MACD for confirmation can enhance trading decisions.
Practical Example:
Buy Signal: If you're watching Apple Inc. (AAPL) on a weekly chart, a crossover where the 10-week SMA moves above the 50-week SMA could suggest a buying opportunity, especially if confirmed by volume increase or other technical indicators.
Sell Signal: Conversely, if the 10-week SMA dips below the 50-week SMA, it might be time to consider selling, particularly if other bearish signals are present.
Conclusion:
The "Dynamic Trend Visualization" indicator provides a visual aid for trend-following strategies, offering customization and alert features to streamline the trading process. However, it's crucial to use this in conjunction with other analysis methods to mitigate the risks of false signals or market anomalies.
Legal Disclaimer:
This indicator is for educational purposes only. It does not guarantee profits or provide investment advice. Trading involves risk; please conduct thorough or consult with a financial advisor. The creator is not responsible for any losses incurred. By using this indicator, you agree to these terms.

Gold Scalping Strategy with Precise EntriesThe Gold Scalping Strategy with Precise Entries is designed to take advantage of short-term price movements in the gold market (XAU/USD). This strategy uses a combination of technical indicators and chart patterns to identify precise buy and sell opportunities during times of consolidation and trend continuation.
Key Elements of the Strategy:
Exponential Moving Averages (EMAs):
50 EMA: Used as the shorter-term moving average to detect the recent price trend.
200 EMA: Used as the longer-term moving average to determine the overall market trend.
Trend Identification:
A bullish trend is identified when the 50 EMA is above the 200 EMA.
A bearish trend is identified when the 50 EMA is below the 200 EMA.
Average True Range (ATR):
ATR (14) is used to calculate the market's volatility and to set a dynamic stop loss based on recent price movements. Higher ATR values indicate higher volatility.
ATR helps define a suitable stop-loss distance from the entry point.
Relative Strength Index (RSI):
RSI (14) is used as a momentum oscillator to detect overbought or oversold conditions.
However, in this strategy, the RSI is primarily used as a consolidation filter to look for neutral zones (between 45 and 55), which may indicate a potential breakout or trend continuation after a consolidation phase.
Engulfing Patterns:
Bullish Engulfing: A bullish signal is generated when the current candle fully engulfs the previous bearish candle, indicating potential upward momentum.
Bearish Engulfing: A bearish signal is generated when the current candle fully engulfs the previous bullish candle, signaling potential downward momentum.
Precise Entry Conditions:
Long (Buy):
The 50 EMA is above the 200 EMA (bullish trend).
The RSI is between 45 and 55 (neutral/consolidation zone).
A bullish engulfing pattern occurs.
The price closes above the 50 EMA.
Short (Sell):
The 50 EMA is below the 200 EMA (bearish trend).
The RSI is between 45 and 55 (neutral/consolidation zone).
A bearish engulfing pattern occurs.
The price closes below the 50 EMA.
Take Profit and Stop Loss:
Take Profit: A fixed 20-pip target (where 1 pip = 0.10 movement in gold) is used for each trade.
Stop Loss: The stop-loss is dynamically set based on the ATR, ensuring that it adapts to current market volatility.
Visual Signals:
Buy and sell signals are visually plotted on the chart using green and red labels, indicating precise points of entry.
Advantages of This Strategy:
Trend Alignment: The strategy ensures that trades are taken in the direction of the overall trend, as indicated by the 50 and 200 EMAs.
Volatility Adaptation: The use of ATR allows the stop loss to adapt to the current market conditions, reducing the risk of premature exits in volatile markets.
Precise Entries: The combination of engulfing patterns and the neutral RSI zone provides a high-probability entry signal that captures momentum after consolidation.
Quick Scalping: With a fixed 20-pip profit target, the strategy is designed to capture small price movements quickly, which is ideal for scalping.
This strategy can be applied to lower timeframes (such as 1-minute, 5-minute, or 15-minute charts) for frequent trade opportunities in gold trading, making it suitable for day traders or scalpers. However, proper risk management should always be used due to the inherent volatility of gold.

ApEn Zones with Delta Confirmation MTF [PhenLabs]📊 ApEn Zones with Delta Confirmation MTF
Version: PineScript™ v6
📌 Description
The ApEn Zones with Delta Confirmation MTF indicator combines Approximate Entropy analysis with cumulative volume delta to identify high-probability support and resistance zones. Approximate Entropy (ApEn) measures the complexity and unpredictability in price data—when ApEn drops significantly, it signals a transition from chaotic to ordered market behavior, often preceding reversals or continuations.
This indicator goes beyond simple ApEn detection by integrating Delta confirmation, which validates zones using volume-based order flow analysis. When a zone forms with Delta confirmation, it indicates institutional participation aligning with the price structure. The multi-timeframe capability allows traders to detect zones forming on higher timeframes while executing on their preferred chart.
🚀 Points of Innovation
First indicator to combine ApEn complexity analysis with cumulative Delta confirmation for zone validation
Pre-built calculation presets eliminate guesswork—optimized parameters for scalping, day trading, and swing trading
Smart zone management automatically removes invalidated zones after two price rejections
Multi-timeframe architecture detects zones on configurable timeframes independent of chart timeframe
Visual style presets provide instant customization from high contrast to subtle overlays
Delta threshold system distinguishes between regular zones and institutionally-confirmed zones
🔧 Core Components
ApEn Calculator: Measures pattern regularity using embedding dimension (m=2) and tolerance factor (r) against price standard deviation to quantify market complexity
Delta Engine: Computes cumulative delta from volume and price movement, comparing against statistical thresholds to identify significant order flow divergence
Zone Generator: Creates visual box zones at signal points with dynamic sizing based on bar range and confirmation status
MTF Request Handler: Fetches ApEn calculations from user-specified timeframe using security() calls for higher timeframe alignment
Zone Manager: Tracks zone interactions, counts rejections, and automatically purges zones that have been tested twice
🔥 Key Features
Calculation Presets: Choose from Aggressive, Conservative, Scalping 1m, Strong Scalping, Swing Trading, or Default—each preset optimizes all parameters for specific trading styles
Visual Style Presets: Select Default, High Contrast, Subtle, Classic, Neutral, or Neutral Reverse to match your chart theme and preference
Delta Confirmation: Zones display with enhanced opacity when cumulative delta confirms institutional participation in the direction of the zone
Automatic Zone Cleanup: Zones self-destruct after two rejections, keeping your chart clean and focused on active levels
Alert System: Four alert conditions for buy zones, sell zones, strong buy signals, and strong sell signals
Maximum Zone Control: Limits display to 5 zones per direction to prevent chart clutter
🎨 Visualization
Buy Zones: Displayed as horizontal boxes at low points when ApEn crosses under threshold—lighter transparency indicates regular zone, darker indicates Delta confirmation
Sell Zones: Displayed as horizontal boxes at high points when ApEn crosses over threshold—visual confirmation follows same transparency logic
Zone Boundaries: Each zone extends 10% of bar range above and below the signal level, providing clear entry and stop areas
Dynamic Extension: All zones automatically extend rightward with each new bar until invalidated
📖 Usage Guidelines
Calculation Preset Selection
Scalping 1m / Strong Scalping: Use for 1-5 minute charts with faster signal generation and tighter thresholds (Length: 15, Zone Length: 5)
Aggressive: Shorter lookback (Length: 10) generates more zones with lower confirmation requirements—higher frequency, more noise
Default: Balanced parameters suitable for 5-15 minute charts (Length: 15, Zone Threshold: 0.5, Delta Length: 4)
Conservative: Extended lookback (Length: 30) with stricter thresholds—fewer but higher probability zones
Swing Trading: Longest parameters (Length: 40, Zone Length: 20) for 1H-4H charts capturing major structural zones
Visual Style Selection
High Contrast: Bright green/red for maximum visibility on any background
Subtle: Muted green/red with transparency for minimal chart distraction
Classic: Traditional lime green and crimson color scheme
Neutral / Neutral Reverse: Grayscale tones for non-directional bias visualization
Timeframe Configuration
Default timeframe is set to 1 minute—adjust based on your execution timeframe
For scalping: Set zone timeframe 1-3x your chart timeframe
For swing trading: Set zone timeframe to 4H or Daily while viewing 1H charts
✅ Best Use Cases
Identifying reversal zones during high-volatility market conditions
Confirming support/resistance levels with volume-based order flow validation
Scalping entries on lower timeframes with higher timeframe zone confluence
Filtering trade setups by requiring Delta confirmation before entry
Setting stop losses beyond zone boundaries after rejection tests
Swing trade positioning at zones detected on 4H/Daily timeframes
⚠️ Limitations
ApEn calculations are computationally intensive—may experience slower loading on very long chart histories
Delta estimation uses (close - open) * volume approximation, not actual order flow data
Zones require sufficient price history—indicator needs max_bars_back of 2000 bars for proper calculation
Low volume instruments may produce unreliable Delta confirmation signals
Zone rejections are counted based on price interaction, not candle close confirmation
Maximum of 5 zones per direction limits visibility during highly active markets
💡 What Makes This Unique
Entropy-Based Detection: Uses mathematical complexity analysis rather than simple price patterns to identify zones
Dual Confirmation System: Combines ApEn signals with Delta divergence for higher probability setups
Adaptive Presets: Six calculation presets and six visual styles create 36 possible configurations without manual parameter adjustment
Self-Managing Zones: Automatic invalidation after two rejections mimics how professional traders track level degradation
🔬 How It Works
Step 1 - ApEn Calculation: The indicator computes Approximate Entropy by measuring how often similar patterns of length m repeat within tolerance r multiplied by standard deviation—lower values indicate more predictable (ordered) price behavior
Step 2 - Signal Generation: Buy signals trigger when higher timeframe ApEn crosses under the average ApEn divided by threshold; sell signals trigger when ApEn crosses over average multiplied by threshold
Step 3 - Delta Confirmation: Cumulative delta is compared against its moving average plus/minus standard deviation times threshold—extreme readings confirm institutional order flow alignment
Step 4 - Zone Creation: Visual boxes are drawn at signal bars with dimensions based on bar range; confirmed zones receive enhanced opacity while unconfirmed zones appear more transparent
Step 5 - Zone Lifecycle: Active zones extend with each bar and track price interactions; after two rejections (price touches zone but reverses), the zone is automatically deleted
💡 Note:
This indicator works best when combined with trend analysis and market structure. Use calculation presets as starting points and adjust the Zone Timeframe setting to align with your trading methodology. Delta confirmation significantly improves zone reliability but requires volume data—instruments with low or unreported volume should rely primarily on ApEn signals alone. Always validate signals with price action context before executing trades.
