4-Hour Range Scalping [v6.3]User Guide: 4-Hour Range Scalping Strategy
Hello! Here is the guide for the Pine Script strategy. Please read it carefully to get the best results.
📈 This script automates the "4-Hour Range Scalping Strategy" from the video.
The main idea is that the first four hours of a major trading day (like New York) set up a "trap zone." The strategy waits for the price to break out of this zone and then fail, giving us a signal that the breakout was false and the price is likely to reverse.
Here’s the simple logic:
Define the Range: It precisely calculates the highest high and lowest low during the first four hours of the selected trading session (e.g., 00:00 to 04:00 New York Time).
Wait for a Breakout: It then monitors the 5-minute chart for a price breakout where a candle fully closes outside of this established range.
Identify the Reversal: The trade trigger occurs when the price fails to continue its breakout and a subsequent 5-minute candle closes back inside the range. This signals a potential reversal or "failed breakout."
Execute the Trade:
]A Short (Sell) trade is triggered after a failed breakout above the range high.
A Long (Buy) trade is triggered after a failed breakout below the range low.
Manage the Risk: The Stop Loss is automatically placed at the peak (for shorts) or trough (for longs) of the breakout move, and the Take Profit is set to a default 2:1 Risk/Reward Ratio.
How to Use the Script (Step-by-Step) ⚙️
Follow these instructions to get it running perfectly.
1. Set Your Chart Timeframe This is the most important step. The strategy is designed to run on a 5-minute (5m) chart. Open your TradingView chart and make sure the timeframe is set to "5m".
2. Add the Script to Your Chart Open the Pine Editor tab at the bottom of TradingView, paste the entire script, and click the "Add to chart" button.
3. Configure the Settings On your chart, find the strategy's name (e.g., "4-Hour Range Scalping ") and click the gear icon ⚙️ to open its settings.
Trading Session: Choose the session for the range. New York is the default and the one from the video.
Risk/Reward Ratio: The default is 2.0, meaning your potential profit is twice your potential loss. You can adjust this to test other targets.
Backtesting Period: To see how the strategy performed on all historical data, go to the "Strategy Tester" panel, click its own gear icon ⚙️, and uncheck the boxes for "Start Date" and "End Date."
4. Understand the Visuals on Your Chart
Blue Background Area: This is the 4-hour calculation window. The script is identifying the day's high and low during this time. No trades will ever happen here.
Red Line (Range High): The highest price of the 4-hour window. This is the upper boundary of the "trap zone."
Green Line (Range Low): The lowest price of the 4-hour window. This is the lower boundary.
Green Triangle (▲): Shows where a Long (Buy) trade was entered.
Red Triangle (▼): Shows where a Short (Sell) trade was entered.
A Very Important Note on Timezones 🕒
This is critical for you in the Philippines (PHT).
The script is based on the New York session, which is 12 hours behind you. Your TradingView chart will still show your local time, but the script works on NY time in the background.
The New York "day" begins at 12:00 PM (Noon) your time.
The script's blue calculation window will be from 12:00 PM to 4:00 PM your local time.
The red and green range lines will appear on your chart only after 4:00 PM your time.
So, if you look at your chart in the morning or early afternoon, you will not see today's range yet. This is normal! The script is just waiting for the New York session to start.
How to Set Up Trade Alerts 🔔
You can have TradingView send you a notification whenever the script enters a trade.
Click the "Alert" button (looks like a clock) in the right-hand toolbar of TradingView.
In the "Condition" dropdown, select the name of the script (e.g., "4-Hour Range Scalping...").
You will then see two options: "Long Signal" and "Short Signal".
Select one (e.g., "Long Signal") and configure how you want to be notified (e.g., "Notify on app").
Click "Create". Repeat the process to create an alert for the other signal.
⚠️ Important Disclosure
For Educational and Research Purposes Only.
This script and all accompanying information are provided for educational and research purposes only. The strategy demonstrated is a technical concept and should not be misconstrued as financial, investment, legal, or tax advice.
Trading financial markets involves substantial risk and is not suitable for every investor. There is a possibility that you could sustain a loss of some or all of your initial investment. Therefore, you should not invest money that you cannot afford to lose.
Past performance is not indicative of future results. The backtesting results shown by this script are historical and do not guarantee future performance. Market conditions are constantly changing.
By using this script, you acknowledge that you are solely responsible for any and all trading decisions you make. You should conduct your own thorough research and, if necessary, seek advice from an independent financial advisor before making any investment decisions. The creators of this script assume no liability for any of your trading results.
Cari dalam skrip untuk "scalping"

BOCS Channel Scalper Strategy - Automated Mean Reversion System# BOCS Channel Scalper Strategy - Automated Mean Reversion System
## WHAT THIS STRATEGY DOES:
This is an automated mean reversion trading strategy that identifies consolidation channels through volatility analysis and executes scalp trades when price enters entry zones near channel boundaries. Unlike breakout strategies, this system assumes price will revert to the channel mean, taking profits as price bounces back from extremes. Position sizing is fully customizable with three methods: fixed contracts, percentage of equity, or fixed dollar amount. Stop losses are placed just outside channel boundaries with take profits calculated either as fixed points or as a percentage of channel range.
## KEY DIFFERENCE FROM ORIGINAL BOCS:
**This strategy is designed for traders seeking higher trade frequency.** The original BOCS indicator trades breakouts OUTSIDE channels, waiting for price to escape consolidation before entering. This scalper version trades mean reversion INSIDE channels, entering when price reaches channel extremes and betting on a bounce back to center. The result is significantly more trading opportunities:
- **Original BOCS**: 1-3 signals per channel (only on breakout)
- **Scalper Version**: 5-15+ signals per channel (every touch of entry zones)
- **Trade Style**: Mean reversion vs trend following
- **Hold Time**: Seconds to minutes vs minutes to hours
- **Best Markets**: Ranging/choppy conditions vs trending breakouts
This makes the scalper ideal for active day traders who want continuous opportunities within consolidation zones rather than waiting for breakout confirmation. However, increased trade frequency also means higher commission costs and requires tighter risk management.
## TECHNICAL METHODOLOGY:
### Price Normalization Process:
The strategy normalizes price data to create consistent volatility measurements across different instruments and price levels. It calculates the highest high and lowest low over a user-defined lookback period (default 100 bars). Current close price is normalized using: (close - lowest_low) / (highest_high - lowest_low), producing values between 0 and 1 for standardized volatility analysis.
### Volatility Detection:
A 14-period standard deviation is applied to the normalized price series to measure price deviation from the mean. Higher standard deviation values indicate volatility expansion; lower values indicate consolidation. The strategy uses ta.highestbars() and ta.lowestbars() to identify when volatility peaks and troughs occur over the detection period (default 14 bars).
### Channel Formation Logic:
When volatility crosses from a high level to a low level (ta.crossover(upper, lower)), a consolidation phase begins. The strategy tracks the highest and lowest prices during this period, which become the channel boundaries. Minimum duration of 10+ bars is required to filter out brief volatility spikes. Channels are rendered as box objects with defined upper and lower boundaries, with colored zones indicating entry areas.
### Entry Signal Generation:
The strategy uses immediate touch-based entry logic. Entry zones are defined as a percentage from channel edges (default 20%):
- **Long Entry Zone**: Bottom 20% of channel (bottomBound + channelRange × 0.2)
- **Short Entry Zone**: Top 20% of channel (topBound - channelRange × 0.2)
Long signals trigger when candle low touches or enters the long entry zone. Short signals trigger when candle high touches or enters the short entry zone. This captures mean reversion opportunities as price reaches channel extremes.
### Cooldown Filter:
An optional cooldown period (measured in bars) prevents signal spam by enforcing minimum spacing between consecutive signals. If cooldown is set to 3 bars, no new long signal will fire until 3 bars after the previous long signal. Long and short cooldowns are tracked independently, allowing both directions to signal within the same period.
### ATR Volatility Filter:
The strategy includes a multi-timeframe ATR filter to avoid trading during low-volatility conditions. Using request.security(), it fetches ATR values from a specified timeframe (e.g., 1-minute ATR while trading on 5-minute charts). The filter compares current ATR to a user-defined minimum threshold:
- If ATR ≥ threshold: Trading enabled
- If ATR < threshold: No signals fire
This prevents entries during dead zones where mean reversion is unreliable due to insufficient price movement.
### Take Profit Calculation:
Two TP methods are available:
**Fixed Points Mode**:
- Long TP = Entry + (TP_Ticks × syminfo.mintick)
- Short TP = Entry - (TP_Ticks × syminfo.mintick)
**Channel Percentage Mode**:
- Long TP = Entry + (ChannelRange × TP_Percent)
- Short TP = Entry - (ChannelRange × TP_Percent)
Default 50% targets the channel midline, a natural mean reversion target. Larger percentages aim for opposite channel edge.
### Stop Loss Placement:
Stop losses are placed just outside the channel boundary by a user-defined tick offset:
- Long SL = ChannelBottom - (SL_Offset_Ticks × syminfo.mintick)
- Short SL = ChannelTop + (SL_Offset_Ticks × syminfo.mintick)
This logic assumes channel breaks invalidate the mean reversion thesis. If price breaks through, the range is no longer valid and position exits.
### Trade Execution Logic:
When entry conditions are met (price in zone, cooldown satisfied, ATR filter passed, no existing position):
1. Calculate entry price at zone boundary
2. Calculate TP and SL based on selected method
3. Execute strategy.entry() with calculated position size
4. Place strategy.exit() with TP limit and SL stop orders
5. Update info table with active trade details
The strategy enforces one position at a time by checking strategy.position_size == 0 before entry.
### Channel Breakout Management:
Channels are removed when price closes more than 10 ticks outside boundaries. This tolerance prevents premature channel deletion from minor breaks or wicks, allowing the mean reversion setup to persist through small boundary violations.
### Position Sizing System:
Three methods calculate position size:
**Fixed Contracts**:
- Uses exact contract quantity specified in settings
- Best for futures traders (e.g., "trade 2 NQ contracts")
**Percentage of Equity**:
- position_size = (strategy.equity × equity_pct / 100) / close
- Dynamically scales with account growth
**Cash Amount**:
- position_size = cash_amount / close
- Maintains consistent dollar exposure regardless of price
## INPUT PARAMETERS:
### Position Sizing:
- **Position Size Type**: Choose Fixed Contracts, % of Equity, or Cash Amount
- **Number of Contracts**: Fixed quantity per trade (1-1000)
- **% of Equity**: Percentage of account to allocate (1-100%)
- **Cash Amount**: Dollar value per position ($100+)
### Channel Settings:
- **Nested Channels**: Allow multiple overlapping channels vs single channel
- **Normalization Length**: Lookback for high/low calculation (1-500, default 100)
- **Box Detection Length**: Period for volatility detection (1-100, default 14)
### Scalping Settings:
- **Enable Long Scalps**: Toggle long entries on/off
- **Enable Short Scalps**: Toggle short entries on/off
- **Entry Zone % from Edge**: Size of entry zone (5-50%, default 20%)
- **SL Offset (Ticks)**: Distance beyond channel for stop (1+, default 5)
- **Cooldown Period (Bars)**: Minimum spacing between signals (0 = no cooldown)
### ATR Filter:
- **Enable ATR Filter**: Toggle volatility filter on/off
- **ATR Timeframe**: Source timeframe for ATR (1, 5, 15, 60 min, etc.)
- **ATR Length**: Smoothing period (1-100, default 14)
- **Min ATR Value**: Threshold for trade enablement (0.1+, default 10.0)
### Take Profit Settings:
- **TP Method**: Choose Fixed Points or % of Channel
- **TP Fixed (Ticks)**: Static distance in ticks (1+, default 30)
- **TP % of Channel**: Dynamic target as channel percentage (10-100%, default 50%)
### Appearance:
- **Show Entry Zones**: Toggle zone labels on channels
- **Show Info Table**: Display real-time strategy status
- **Table Position**: Corner placement (Top Left/Right, Bottom Left/Right)
- **Color Settings**: Customize long/short/TP/SL colors
## VISUAL INDICATORS:
- **Channel boxes** with semi-transparent fill showing consolidation zones
- **Colored entry zones** labeled "LONG ZONE ▲" and "SHORT ZONE ▼"
- **Entry signal arrows** below/above bars marking long/short entries
- **Active TP/SL lines** with emoji labels (⊕ Entry, 🎯 TP, 🛑 SL)
- **Info table** showing position status, channel state, last signal, entry/TP/SL prices, and ATR status
## HOW TO USE:
### For 1-3 Minute Scalping (NQ/ES):
- ATR Timeframe: "1" (1-minute)
- ATR Min Value: 10.0 (for NQ), adjust per instrument
- Entry Zone %: 20-25%
- TP Method: Fixed Points, 20-40 ticks
- SL Offset: 5-10 ticks
- Cooldown: 2-3 bars
- Position Size: 1-2 contracts
### For 5-15 Minute Day Trading:
- ATR Timeframe: "5" or match chart
- ATR Min Value: Adjust to instrument (test 8-15 for NQ)
- Entry Zone %: 20-30%
- TP Method: % of Channel, 40-60%
- SL Offset: 5-10 ticks
- Cooldown: 3-5 bars
- Position Size: Fixed contracts or 5-10% equity
### For 30-60 Minute Swing Scalping:
- ATR Timeframe: "15" or "30"
- ATR Min Value: Lower threshold for broader market
- Entry Zone %: 25-35%
- TP Method: % of Channel, 50-70%
- SL Offset: 10-15 ticks
- Cooldown: 5+ bars or disable
- Position Size: % of equity recommended
## BACKTEST CONSIDERATIONS:
- Strategy performs best in ranging, mean-reverting markets
- Strong trending markets produce more stop losses as price breaks channels
- ATR filter significantly reduces trade count but improves quality during low volatility
- Cooldown period trades signal quantity for signal quality
- Commission and slippage materially impact sub-5-minute timeframe performance
- Shorter timeframes require tighter entry zones (15-20%) to catch quick reversions
- % of Channel TP adapts better to varying channel sizes than fixed points
- Fixed contract sizing recommended for consistent risk per trade in futures
**Backtesting Parameters Used**: This strategy was developed and tested using realistic commission and slippage values to provide accurate performance expectations. Recommended settings: Commission of $1.40 per side (typical for NQ futures through discount brokers), slippage of 2 ticks to account for execution delays on fast-moving scalp entries. These values reflect real-world trading costs that active scalpers will encounter. Backtest results without proper cost simulation will significantly overstate profitability.
## COMPATIBLE MARKETS:
Works on any instrument with price data including stock indices (NQ, ES, YM, RTY), individual stocks, forex pairs (EUR/USD, GBP/USD), cryptocurrency (BTC, ETH), and commodities. Volume-based features require data feed with volume information but are optional for core functionality.
## KNOWN LIMITATIONS:
- Immediate touch entry can fire multiple times in choppy zones without adequate cooldown
- Channel deletion at 10-tick breaks may be too aggressive or lenient depending on instrument tick size
- ATR filter from lower timeframes requires higher-tier TradingView subscription (request.security limitation)
- Mean reversion logic fails in strong breakout scenarios leading to stop loss hits
- Position sizing via % of equity or cash amount calculates based on close price, may differ from actual fill price
- No partial closing capability - full position exits at TP or SL only
- Strategy does not account for gap openings or overnight holds
## RISK DISCLOSURE:
Trading involves substantial risk of loss. Past performance does not guarantee future results. This strategy is for educational purposes and backtesting only. Mean reversion strategies can experience extended drawdowns during trending markets. Stop losses may not fill at intended levels during extreme volatility or gaps. Thoroughly test on historical data and paper trade before risking real capital. Use appropriate position sizing and never risk more than you can afford to lose. Consider consulting a licensed financial advisor before making trading decisions. Automated trading systems can malfunction - monitor all live positions actively.
## ACKNOWLEDGMENT & CREDITS:
This strategy is built upon the channel detection methodology created by **AlgoAlpha** in the "Smart Money Breakout Channels" indicator. Full credit and appreciation to AlgoAlpha for pioneering the normalized volatility approach to identifying consolidation patterns. The core channel formation logic using normalized price standard deviation is AlgoAlpha's original contribution to the TradingView community.
Enhancements to the original concept include: mean reversion entry logic (vs breakout), immediate touch-based signals, multi-timeframe ATR volatility filtering, flexible position sizing (fixed/percentage/cash), cooldown period filtering, dual TP methods (fixed points vs channel percentage), automated strategy execution with exit management, and real-time position monitoring table.

Enhanced Scalping IndicatorEnhanced Scalping Indicator - Professional Multi-Confirmation Trading System
Overview
The Enhanced Scalping Indicator is a sophisticated trading tool designed for short-term traders seeking high-probability entry and exit signals. This indicator combines multiple technical analysis techniques with adaptive market conditions to filter noise and identify optimal trading opportunities.
Key Features
🎯 Multi-Confirmation Signal System
- Enhanced RSI with Adaptive Thresholds: Dynamic overbought/oversold levels that adjust based on market volatility (ATR)
- Higher Timeframe Confirmation: Uses 1-hour RSI to validate signals from lower timeframes
- Volume-Weighted Momentum: Incorporates volume analysis to confirm price movements
- Market Structure Analysis: Evaluates price position within recent 20-bar range
📊 Advanced Signal Generation
- Buy Signals: Triggered when RSI is oversold with upward momentum, confirmed by higher timeframe bearish conditions and strong volume
- Sell Signals: Activated when RSI is overbought with downward momentum, validated by higher timeframe bullish conditions and high volume
- Exit Signals: Smart exit conditions based on RSI mean reversion and momentum shifts
🔄 Divergence Detection (Optional)
- Bullish Divergence: Identifies when price makes lower lows while RSI makes higher lows
- Bearish Divergence: Spots when price makes higher highs while RSI makes lower highs
- Volume Confirmation: All divergence signals require above-average volume for validation
⚙️ Customizable Parameters
- RSI Settings: Adjustable length (default: 14) and source
- Moving Average Options: Choose from SMA, EMA, SMMA, WMA, VWMA, or Bollinger Bands
- Higher Timeframe: Configurable confirmation timeframe (default: 1 hour)
- ATR Period: [
/b] Volatility measurement period for adaptive thresholds
📈 Visual Elements
- Dynamic Threshold Lines: Adaptive overbought/oversold levels
- Signal Shapes: Clear buy/sell and exit signals on chart
- Background Highlighting: Color-coded background for active signals
- Real-time Information Table: Displays current RSI, higher timeframe RSI, volatility ratio, market position, and momentum
🚨 Alert System
Complete alert functionality for:
- Enhanced buy signals
- Enhanced sell signals
- Long position exits
- Short position exits
Best Use Cases
- Scalping: 1-5 minute timeframes for quick trades
- Day Trading: 15-30 minute timeframes for intraday positions
- Swing Trading: Higher timeframes with divergence detection enabled
Market Conditions
Works effectively in:
- T rending Markets: Momentum and higher timeframe filters reduce false signals
- Range-bound Markets: Adaptive thresholds adjust to market volatility
- High Volume Sessions: Built-in volume filters ensure signal quality
Strategy Integration
This indicator works well with:
- Support/resistance levels
- Price action analysis
- Risk management rules (stop losses, position sizing)
- Market session awareness (built-in US market hours filter)
Technical Implementation
- Built on Pine Script v6
- Utilizes proper RMA calculations for RSI
- Implements consistent historical data access
- Optimized for performance with minimal repainting
Risk Disclaimer
This indicator is a technical analysis tool and should not be used as the sole basis for trading decisions. Always combine with proper risk management, fundamental analysis, and your trading strategy. Past performance does not guarantee future results.
---
Perfect for: Scalpers, day traders, and swing traders looking for a comprehensive, multi-confirmation trading system with built-in risk management features.

OnePunch Algo Scalper V6Overview:
OnePunch Algo Scalper V6 is an invite-only script designed for short-term trend scalping and extreme reversal detection. It uniquely combines classic momentum and volume indicators, enhanced with multi-time session awareness, to deliver precise high-probability entry alerts.
Core Concepts:
RSI and CCI are used together to identify momentum exhaustion points for early reversal spotting.
CMF is integrated to filter buy signals only when volume flow confirms bullish intent, avoiding weak uptrends.
SMA overlays track medium to long-term trends to confirm direction bias for safer scalping entries.
MACD Histogram weakness detection adds a momentum weakening filter to confirm whether bullish/bearish pressure is losing strength — improving risk-reward setups.
Stochastic crossovers help predict short-term pullbacks, allowing for precision "Prepare for CALL/PUT" signals.
Session-based background coloring indicates high-probability trading windows (Morning, Midday, Afternoon), guiding users to focus on optimal times.
Signals Generated:
✅ "Trending Up": Momentum acceleration uptrend signal (RSI + CCI crossover with volume confirmation).
✅ "Trending Down": Momentum deceleration sell signal.
✅ "Reversal Up" / "Bearish Down": Extreme oversold/overbought reversals.
✅ "Prepare for PUTs/CALLs": Anticipation signals based on stochastic weakening + MACD histogram convergence.
Chart Setup:
The script draws clean shape labels on the chart for each event (e.g., "Up Trend", "Bearish") for clarity.
Background highlights show different sessions to help traders recognize the most liquid periods.
No other indicators are required on the chart.
Usage Notes:
This script is ideal for scalping or short intraday swing trades on liquid assets like indices, crypto, or forex.
Best results when combined with manual Support/Resistance marking (use "Prepare for PUTs/CALLs" near S/R zones).

Soul Button Scalping (1 min chart) V 1.0Indicator Description
- P Signal: The foundational buy signal. It should be confirmed by observing RSI divergence on the 1-minute chart.
- Green, Orange, and Blue Signals: Three buy signals generated through the combination of multiple oscillators. These signals should also be cross-referenced with the RSI on the 1-minute chart.
- Big White and Big Yellow Signals: These represent strong buy signals, triggered in extreme oversold conditions.
- BEST BUY Signal: The most reliable and powerful buy signal available in this indicator.
____________
Red Sell Signal: A straightforward sell signal indicating potential overbought conditions.
____________
Usage Guidance
This scalping indicator is specifically designed for use on the 1-minute chart, incorporating data from the 5-minute chart for added context. It is most effective when used in conjunction with:
• VWAP (Volume Weighted Average Price), already included in the indicator.
• RSI on the 1-minute chart, which should be opened as a separate indicator.
• Trendlines, structure breakouts, and price action analysis to confirm signals.
Intended for Crypto Scalping:
The indicator is optimized for scalping cryptocurrency markets.
____________
Future Enhancements:
• Integration of price action and candlestick patterns.
• A refined version tailored for trading futures contracts, specifically ES and MES in the stock market.

TechniTrendMasterIntroducing "TechniTrendMaster"
The TechniTrendMaster indicator is designed to bring clarity and depth to your trading strategy. This indicator combines robust trend analysis with volume insights, giving you a comprehensive view of the market’s pulse. Let's break down the features.
🔵 Analysis Mode
TechniTrendMaster's Analysis Mode provides various configurations tailored to specific market behaviors. Here are the options you can utilize:
🔹Strong Movements: Focuses on powerful market shifts, ideal for capturing major trend changes and high-momentum moves. Perfect for identifying strong breakout opportunities.
🔹Reversal: Detects potential turning points in the market, signaling when a trend might be about to change direction, allowing for well-timed entries and exits.
🔹Consolidations: Spots periods of low volatility where the market moves sideways, helping you avoid trading traps and anticipate breakout scenarios.
🔹Momentum-Driven: Prioritizes momentum in the market, identifying when the force behind price movement is accelerating or decelerating.
🔹Balanced: Offers a well-rounded view of the market by weighing both trend direction and volume equally, making it suitable for stable market conditions.
🔹Volatility Adapted: Adjusts to periods of increased or decreased volatility, providing accurate signals regardless of market conditions.
🔹Trend Confirmation: Confirms the strength and sustainability of a trend, allowing traders to enter trades with higher confidence.
🔹Short-Term Scalping: Tailored for traders who focus on Short-Term and Scalp trades, offering rapid insights for intraday or short-term trading strategies.
🔵 Trend Analysis Mode
The Trend Analysis Mode allows you to customize how trends are detected and analyzed:
🔹Default: A balanced mode for general use, offering reliable trend identification across different market conditions.
🔹Aggressive: A more sensitive setting that reacts quickly to market changes, ideal for traders looking to capitalize on smaller, quicker movements.
🔹Conservative: Takes a cautious approach, favoring long-term stability over short-term fluctuations, perfect for risk-averse traders.
🔹Volatility Aware: Focuses on adapting to volatility shifts, giving accurate trend signals even in erratic markets.
🔹Range Bound: Targets horizontal price movements and channel trades, helping traders take advantage of well-defined ranges.
🔵 Divergence
Divergence is a powerful tool within TechniTrendMaster, highlighting discrepancies between price movement and underlying volume. These differences can indicate potential reversals or trend continuations before they are visible on price charts alone.
🔵 Hidden Divergence
Hidden divergence is a subtle yet crucial signal that reveals when an existing trend might resume after a temporary correction. This mode provides early detection of trend continuity opportunities, giving traders a significant advantage in timing.
🔵 Divergence Mode
TechniTrendMaster includes different divergence detection settings to suit your analysis style:
🔹Standard: Captures typical divergence patterns for general analysis.
🔹Short-Term Focused: Concentrates on short-lived divergences, offering rapid detection of shifts for active traders.
🔹Long-Term Analysis: Highlights divergence in a broader context, which is better for understanding the overall market direction.
🔹High Sensitivity: Prioritizes capturing even the smallest shifts in the market, making it excellent for high-frequency trading or volatile environments.
🔹Low Sensitivity: Reduces market noise, only reacting to more significant changes in trend or volume. It’s perfect for traders who seek higher accuracy with fewer false signals.
🔵 Dynamic Channel
TechniTrendMaster features a Dynamic Channel, that automatically adapts to market conditions. This channel provides a visual guide to price action, adjusting in real-time based on current trends and volatility. It identifies key support and resistance zones, making it easier to spot breakouts, trend continuations, or potential reversals.
🔵 Volume Integration
Volume is a critical part of TechniTrendMaster, offering deeper insights beyond just price movement. By analyzing volume patterns alongside trends, the indicator highlights the strength and reliability of market shifts. This integration ensures that traders can distinguish between genuine movements backed by solid volume and weak trends that might not hold.
🔵 A Solution for All Trading Styles
TechniTrendMaster’s strength lies in its versatility. No matter your trading approach—be it scalping, swing trading, trend following, or range trading—this indicator adapts to your needs. Here's how it caters to different trader profiles:
🔹Scalpers get precise, quick-response insights through the Short-Term Scalping and High Sensitivity settings, helping them capture minute price movements.
🔹Swing Traders benefit from modes like Reversal, Balanced, and Momentum-Driven, which focus on identifying trends and shifts that occur over several days.
🔹Long-Term Investors will find the Conservative, Low Sensitivity, and Long-Term Analysis modes ideal for filtering noise and sticking to broader market trends.
🔹Volatility Traders can rely on the Volatility Adapted and Volatility Aware options to get accurate signals even during unpredictable periods.
🔓 Unlock Access :
Check out the Author's Instructions or Dm me to Unlock the Access.

EMA Scalping StrategyEMA Slope Indicator Overview:
The indicator plots two exponential moving averages (EMAs) on the chart: a 9-period EMA and a 15-period EMA.
It visually represents the EMAs on the chart and highlights instances where the slope of each EMA exceeds a certain threshold (approximately 30 degrees).
Scalping Strategy:
Using the EMA Slope Indicator on a 5-minute timeframe for scalping can be effective, but it requires adjustments to account for the shorter time horizon.
Trend Identification: Look for instances where the 9-period EMA is above the 15-period EMA. This indicates an uptrend. Conversely, if the 9-period EMA is below the 15-period EMA, it suggests a downtrend.
Slope Analysis: Pay attention to the slope of each EMA. When the slope of both EMAs is steep (exceeds 30 degrees), it signals a strong trend. This can be a favorable condition for scalping as it suggests potential momentum.
Entry Points:
For Long (Buy) Positions: Consider entering a long position when both EMAs are sloping upwards strongly (exceeding 30 degrees) and the 9-period EMA is above the 15-period EMA. Look for entry points when price retraces to the EMAs or when there's a bullish candlestick pattern.
For Short (Sell) Positions: Look for opportunities to enter short positions when both EMAs are sloping downwards strongly (exceeding -30 degrees) and the 9-period EMA is below the 15-period EMA. Similar to long positions, consider entering on retracements or bearish candlestick patterns.
Exit Strategy: Use tight stop-loss orders to manage risk, and aim for small, quick profits. Since scalping involves short-term trading, consider exiting positions when the momentum starts to weaken or when the price reaches a predetermined profit target.
Risk Management:
Scalping involves high-frequency trading with smaller profit targets, so it's crucial to implement strict risk management practices. This includes setting stop-loss orders to limit potential losses and not risking more than a small percentage of your trading capital on each trade.
Backtesting and Optimization:
Before implementing the strategy in live trading, backtest it on historical data to assess its performance under various market conditions. You may also consider optimizing the strategy parameters (e.g., EMA lengths) to maximize its effectiveness.
Continuous Monitoring:
Keep a close eye on market conditions and adjust your strategy accordingly. Market dynamics can change rapidly, so adaptability is key to successful scalping.

Hybrid CCI Scalper ProHybrid CCI Scalper Pro is a sophisticated trading system designed to solve the biggest problem in scalping: False Signals in Choppy Markets.
Unlike standard CCI indicators that fire on every crossover, the HCS Pro uses a Hybrid Logic Engine that distinguishes between high-probability Trend Continuations and powerful Reversal Setups. It processes every potential entry through a 6-factor "Quality Filter" before generating a signal.
Core Features:
1. The Hybrid Signal Engine The script identifies two distinct market conditions:
TREND Mode: Triggers when price is aligned with the Daily/Local trend AND the CCI angle is steep.
REVERSAL Mode (REV): Triggers only on Extreme Momentum (steep angle) combined with a Zero-Line cross, allowing you to catch tops and bottoms without waiting for lagging trend indicators.
2. The Quality Scoring System (Q-Score) Every signal is rated from 0 to 6 stars based on confluence. The signal label shows Q: 4/6, Q: 5/6, etc.
Score 4+: High probability (Recommended).
Score 6: "The Perfect Storm" – All filters (Trend, Volume, RSI, ADX) align.
3. The "Ironclad" Filters To eliminate fake-outs, the script enforces strict rules:
Candle Color Guard: Never Buys on a Red candle or Sells on a Green one.
Angle validation: Flat CCI movement is ignored.
MTF Trend: Checks the Daily timeframe (D1 EMA) to ensure you aren't scalping against the major flow.
Noise Filter: Uses ATR and Volume to ignore low-volatility "dead" markets.
4. The Information Panel A clean dashboard on the top-right displays real-time metrics:
Current Daily Trend (Bull/Bear)
Momentum Strength (Weak/Strong/Extreme)
ADX Power (Trending vs Ranging)
Live Signal Score
How to Trade:
BUY Signal: Look for a Green Triangle. Ideally, the Label should say TREND or REV with a Quality Score of 4/6 or higher.
SELL Signal: Look for a Red Triangle with a high Quality Score.
No Signal? If the panel says "WAIT" or the score is low, the market is likely choppy. Stay out.
Recommended Settings:
Gold (XAUUSD): Works best on 15m.
Forex (EURUSD): Works well on 5m - 15m.
Default settings are optimized for a balance between frequency and accuracy.

JAM ALGO Signals
"Remove the filters to view signals, then customize the parameters to your preference and enjoy using the indicator!" ✅
JAM ALGO Signals
Description:
🚀 Advanced Trading Signals with Risk Management & Alerts
This indicator is a complete all-in-one tool for traders seeking precise entries and exits with built-in risk management and real-time statistics. It combines RSI and EMA-based analysis, projected Take Profit (TP) and Stop Loss (SL) levels, customizable filters, and premium alerts directly on your TradingView chart.
✨ Key Features:
Entry Signals 🔹
Buy & Sell signals based on price action and RSI conditions.
Trend confirmation via EMA (200 and optional 50-period filters).
Visual signals: Labels, Arrows, Triangles, or Text.
Risk Management (RR) ⚖️
Define Stop Loss (SL) and multiple Take Profit levels (TP1, TP2, TP3) based on risk ratio (R).
Configurable projection bars to visualize target levels.
Colored zones for TP & SL, with optional borders for clarity.
Premium Alerts 🔔
Alerts for BUY / SELL signals, TP1 / TP2 / TP3, and SL hits.
Instant notifications when levels are reached.
Advanced Filters 🛡️
EMA50 Trend Filter: confirms short-term trend.
RSI Direction Filter: ensures momentum alignment.
Volatility Filter (ATR14 > Range): ensures enough market movement.
Candle Size Filter: avoids entries on too small candles.
SL Overlap Filter: prevents trades overlapping existing SL levels.
Real-Time Statistics 📊
Total trades, wins (TP1), and losses (SL).
Winrate (%), cumulative profit, and average RR ratio.
Optimizes strategy tracking directly on the chart.
Customizable Visuals 🎨
TP & SL line colors and styles (solid, dashed, dotted).
Fully adjustable signal labels (color, size, type).
Configurable stats table with background & text colors.
🔥 Advantages:
Complete tool for day trading and swing trading.
Clear visualization of critical risk/reward levels.
Automatic alerts for fast reaction without constant monitoring.
Integrated statistics for performance evaluation and strategy improvement.
Recommended for:
Traders using price action, intraday strategies, scalping, or swing trading, who want advanced risk management with visual signals and performance analytics on TradingView.

Advanced Confluence DashboardAdvanced Confluence Dashboard - Multi-Indicator Technical Analysis Tool
OVERVIEW
The Advanced Confluence Dashboard is a comprehensive technical analysis tool designed to help traders identify high-probability trade setups by tracking multiple technical indicators simultaneously. The indicator displays up to 13 different technical confluences in an easy-to-read dashboard format, providing both individual signals and an overall market bias percentage. Switch between full table view and condensed view for maximum chart flexibility.
FEATURES
- 13 Technical Confluences: RSI, VWAP, EMA Cross (9/21), MACD, Stochastic, Trend (50 EMA), Bollinger Bands, ADX Strength, Price Momentum, Volume Breakout, VWAP Bands, 200 EMA, and Price Action (Higher Highs/Lower Lows)
- Real-time Confluence Scoring: Automatically calculates bullish vs bearish signal strength
- Multi-Timeframe Support: Analyze indicators on any timeframe while viewing your chart on another
- Customizable Display: Toggle individual indicators on/off, adjust table position, size, and transparency
- ATR Information: Optional ATR display for volatility-based position sizing
- Condensed View Mode: Ultra-minimal display showing only confluence score and ATR (perfect for scalpers who want maximum chart visibility)
- Full Table View: Detailed breakdown of each indicator's value and signal
- Color-Coded Signals: Green (bullish), red (bearish), white (neutral) for instant visual clarity
HOW IT WORKS
The indicator evaluates each enabled technical indicator and assigns it either a bullish or bearish signal based on its current state. The confluence score shows how many indicators are aligned in each direction, giving you a clear percentage-based view of market bias. For example, if 8 out of 13 indicators are bullish, you'll see a 62% LONG BIAS signal.
DISPLAY MODES
Full View: Shows all enabled indicators with their current values and signals in a detailed table format. Perfect for understanding exactly which indicators are bullish or bearish and why.
Condensed View: Shows only the confluence score (e.g., "4/13 LONG | 9/13 SHORT - SHORT BIAS 69%") and optional ATR information. This minimal display keeps your chart clean while still providing the essential confluence data you need for quick trading decisions. Ideal for scalpers and traders who want maximum chart space.
CONFLUENCES EXPLAINED
- RSI: Momentum oscillator (>50 bullish, <50 bearish, shows overbought/oversold)
- VWAP: Volume-weighted average price (above = bullish, below = bearish)
- EMA Cross: Fast EMA (9) vs Slow EMA (21) with price position
- MACD: Trend-following momentum (line above signal = bullish)
- Stochastic: Momentum oscillator (>50 bullish, <50 bearish)
- Trend (50 EMA): Price position relative to 50-period EMA
- Bollinger Bands: Volatility and mean reversion (above middle = bullish)
- ADX Strength: Trend strength indicator (shows strong trends)
- Price Momentum: Rate of price change over specified period
- Volume Breakout: Detects unusual volume with directional bias
- VWAP Bands: Standard deviation bands around VWAP
- 200 EMA: Long-term trend indicator
- Price Action: Higher Highs and Lower Lows pattern detection
SETTINGS
Timeframe Settings:
- Indicator Timeframe: Analyze indicators on a different timeframe than your chart
Display Options:
- Condensed View: Toggle between full table and minimal display
- Show ATR Info: Display/hide ATR information
- Table Position: 9 positions (top/middle/bottom + left/center/right)
- Text Size: Auto, tiny, small, normal, large, huge
- Table Transparency: 0-100%
- Border Width: 1-5 pixels
Confluence Toggles:
- Enable/disable any of the 13 confluences individually
- Confluence score automatically adjusts based on enabled indicators
Indicator Settings:
- RSI Length (default: 14)
- ATR Length (default: 14)
- Fast/Slow EMA (default: 9/21)
- Trend EMA (default: 50)
- Volume SMA Length (default: 20)
- Volume Breakout Multiplier (default: 2.0x)
- Bollinger Bands Length/StdDev (default: 20/2.0)
- ADX Length (default: 14)
- ADX Strength Threshold (default: 25)
- Momentum Length (default: 10)
IDEAL USE CASES
- Scalping: Quick identification of confluence for fast entries/exits - use condensed view for clean charts
- Day Trading: Multi-timeframe analysis for intraday setups
- Swing Trading: Confirmation of longer-term bias
- Risk Management: Higher confluence = higher probability trades
- Trade Filtering: Only take trades when confluence reaches your threshold
- Multi-Monitor Setups: Use condensed view on execution charts, full view on analysis charts
HOW TO USE
1. Add the indicator to your chart
2. Toggle on/off the confluences you prefer to use
3. Choose between Full View (detailed) or Condensed View (minimal)
4. Adjust the table position and size to your preference
5. Look for high confluence percentages (70%+ is strong bias)
6. Use the individual indicator signals (full view) to understand market structure
7. Combine with your trading strategy for entry/exit confirmation
TIPS
- Use Condensed View when scalping to keep your chart clean and uncluttered
- Switch to Full View when you need to analyze which specific indicators are conflicting
- Higher confluence doesn't guarantee success - always use proper risk management
- Consider using 60%+ confluence as a minimum threshold for trades
- Pay attention to which specific indicators are aligned vs conflicting
- Use the ATR display for quick reference on position sizing
- Experiment with different timeframes to find what works for your style
- Disable indicators you don't use to simplify your confluence scoring
DISCLAIMER
This indicator is for educational and informational purposes only. It does not constitute financial advice, investment advice, trading advice, or any other type of advice. Trading and investing in financial markets involves substantial risk of loss and is not suitable for every investor. Past performance is not indicative of future results. Always do your own research and consult with a qualified financial advisor before making any investment decisions.

AI Probabilistic OrderFlow Scalper⭐ Description:
📌 AI Probabilistic OrderFlow Scalper
This script combines Order Flow, Auction Market Theory, Volume Imbalance, Market Structure (HH/LL), RSI bias filtering, and a probability-based direction model inspired by AI and statistics.
It produces high-precision scalping entries designed for fast markets such as Futures, while remaining compatible with all markets (indices, crypto, forex, metals).
This is not a typical indicator — it is a probabilistic predictive model engineered to provide sniper entries, a tick-based Take Profit, a volatility-adaptive ATR Stop Loss, and optional Value Area levels (VAH/VAL/POC).
⭐ Main Features:
🔥 Directional probability model (AI-style weighted scoring)
📊 Order Flow imbalance (delta-like logic)
📈 HH/LL market structure detection
🎯 Smart RSI bias filter
🚀 One signal per trend shift (anti-spam)
🎯 Tick-based Take Profit (perfect for NQ / futures)
🛡️ ATR-based dynamic Stop Loss
📉 Value Area display: VAH, VAL, POC
🔊 Volume confirmation filter
📡 Directional probability plot
✔️ Works for Futures, Crypto, Forex, Indices
🧠 Probabilistic AI Approach
The model uses a 3-factor scoring system:
Order Flow imbalance
Market structure (HH/LL)
RSI trend bias
Each validated condition = 1 point.
The total score is converted into Buy/Sell probabilities, and the higher-probability direction is selected.
When probability exceeds the threshold (e.g. 80%), the system triggers a high-confidence sniper signal.
This mirrors Revenue Management logic:
→ Only take a decision when probability of success is maximized.
🎯 Buy/Sell Signals (Sniper Entries)
🔵 Green triangle under the candle = high-probability Buy
🔴 Red triangle above the candle = high-probability Sell
✔️ Only one signal per directional shift
✔️ Signals appear only when all strict filters are satisfied
📌 Automatic TP / SL
TP: fixed tick-based (e.g. 100 ticks for NQ scalping)
SL: ATR-based, adapts to volatility
TP/SL display can be enabled or disabled
Perfectly calibrated for high-speed scalping.
📘 How to Use
Use on every timeframe
Adjust probability threshold (75–90 recommended)
Enable strict mode for maximum precision
Let the model filter entries automatically
Choose a TP suitable for your market
Optionally display VAH/VAL/POC for Auction Theory context
Always test using backtesting before going live
🏆 Advantages
Extremely fast for scalping
High win-rate potential via probabilistic filtering
Clean signals (no noise or spam)
Combines the strongest trading frameworks:
Order Flow
Market Structure
Statistical modeling
Volume profiling
Automated risk management

AI Probabilistic OrderFlow Scalper⭐ Main Name
AI Probabilistic OrderFlow Scalper
⭐Description:
📌 AI Probabilistic OrderFlow Scalper — Predictive Auction Theory Model for Futures
This script combines Order Flow, Auction Market Theory, Volume Imbalance, Market Structure (HH/LL), RSI bias filtering, and a probability-based direction model inspired by AI and Revenue Management.
It produces high-precision scalping entries designed for fast markets such as Nasdaq Futures (NQ), while remaining compatible with all markets (indices, crypto, forex, metals).
This is not a typical indicator — it is a probabilistic predictive model engineered to provide sniper entries, a tick-based Take Profit, a volatility-adaptive ATR Stop Loss, and optional Value Area levels (VAH/VAL/POC).
⭐ Main Features
🔥 Directional probability model (AI-style weighted scoring)
📊 Order Flow imbalance (delta-like logic)
📈 HH/LL market structure detection
🎯 Smart RSI bias filter
🚀 One signal per trend shift (anti-spam)
🎯 Tick-based Take Profit (perfect for NQ / futures)
🛡️ ATR-based dynamic Stop Loss
📉 Value Area display: VAH, VAL, POC
🔊 Volume confirmation filter
📡 Directional probability plot
✔️ Works for Futures, Crypto, Forex, Indices
🧠 Probabilistic AI Approach
The model uses a 3-factor scoring system:
Order Flow imbalance
Market structure (HH/LL)
RSI trend bias
Each validated condition = 1 point.
The total score is converted into Buy/Sell probabilities, and the higher-probability direction is selected.
When probability exceeds the threshold (e.g. 80%), the system triggers a high-confidence sniper signal.
This mirrors Hight probability decision:
→ Only take a decision when probability of success is maximized.
🎯 Buy/Sell Signals (Sniper Entries)
🔵 Green triangle under the candle = high-probability Buy
🔴 Red triangle above the candle = high-probability Sell
✔️ Only one signal per directional shift
✔️ Signals appear only when all strict filters are satisfied
📌 Automatic TP / SL
TP: fixed tick-based (e.g. 100 ticks for NQ scalping)
SL: ATR-based, adapts to volatility
TP/SL display can be enabled or disabled
Perfectly calibrated for high-speed scalping.
📘 How to Use
Use any timeframe
Adjust probability threshold (75–90 recommended)
Enable strict mode for maximum precision
Let the model filter entries automatically
Choose a TP suitable for your market
Optionally display VAH/VAL/POC for Auction Theory context
Always test using backtesting before going live
🏆 Advantages
Extremely fast for scalping
High win-rate potential via probabilistic filtering
Clean signals (no noise or spam)
Combines the strongest trading frameworks:
Order Flow
Market Structure
Statistical modeling
Volume profiling
Automated risk management

Smart RSI Money Flow - Core Bands V1.01SMART RSI – Money Flow Bands (Technical Overview)
1. Background: RSI and Its Behavior on Lower Timeframes
The Relative Strength Index (RSI) originally is a momentum oscillator calculated from average gains and losses over a selected period. In its standard form, RSI is derived solely from price changes; it does not incorporate volume data or order-flow information in its formula.
Because RSI is price-based, its interpretation depends strongly on the timeframe:
• On higher timeframes, each bar aggregates more trading activity, and RSI tends to behave more smoothly.
• On lower timeframes (1-hour down to intraday scalping intervals), price fluctuations are quicker, and RSI becomes more sensitive to short-term noise.
This does not imply that RSI becomes invalid, but that its signals on fast charts can be more reactive and may benefit from additional context such as volume behavior or structural information.
2. Purpose of This Indicator
This indicator extends the classical RSI by adding information that RSI does not include:
• Mapping RSI values into price-based bands instead of the 0–100 oscillator space.
• Retrieving lower timeframe volume data and separating it into buy and sell components.
• Comparing the slope (angle) of price movement with the slope of buy and sell volume.
The goal is to provide a structural interpretation of where price sits relative to RSI conditions and how volume is behaving on a lower timeframe.
3. Technical Differences Compared to Classical RSI
A) Classical RSI
• Input: price only (usually close).
• Output: normalized oscillator between 0 and 100.
• Does not incorporate intra-bar volume distribution.
• Does not separate buy/sell volume.
B) SMART RSI – Money Flow Bands
1) RSI-to-Price Mapping
Converts RSI values into upper/lower price bands using recent price extremes.
2) Lower Timeframe Volume Decomposition
Retrieves LTF data and splits each bar’s volume into buy (close>open) and sell (close

Smart Money Precision Structure [BullByte]Smart Money Precision Structure
Advanced Market Structure Analysis Using Institutional Order Flow Concepts
---
OVERVIEW
Smart Money Precision Structure (SMPS) is a comprehensive market analysis indicator that combines six analytical frameworks to identify high-probability market structure patterns. The indicator uses multi-dimensional scoring algorithms to evaluate market conditions through institutional order flow concepts, providing traders with professional-grade market analysis.
---
PURPOSE AND ORIGINALITY
Why This Indicator Was Developed
• Addresses the gap between retail and institutional analysis methods
• Consolidates multiple analysis techniques that professionals use separately
• Automates complex market structure evaluation into actionable insights
• Eliminates the need for multiple indicators by providing comprehensive analysis
What Makes SMPS Original
• Six-Layer Confluence System - Unique combination of market regime, structure, volume flow, momentum, price action, and adaptive filtering
• Institutional Pattern Recognition - Identifies smart money accumulation and distribution patterns
• Adaptive Intelligence - Parameters automatically adjust based on detected market conditions
• Real-Time Market Scoring - Proprietary algorithm rates market quality from 0-100%
• Structure Break Detection - Advanced pivot analysis identifies trend reversals early
---
HOW IT WORKS - TECHNICAL METHODOLOGY
1. Market Regime Analysis Engine
The indicator evaluates five core market dimensions:
• Volatility Score - Measures current volatility against 50-period historical baseline
• Trend Score - Analyzes alignment between 8, 21, and 50-period EMAs
• Momentum Score - Combines RSI divergence with MACD signal alignment
• Structure Score - Evaluates pivot point formation clarity
• Efficiency Score - Calculates directional movement efficiency ratio
These scores combine to classify markets into five regimes:
• TRENDING - Strong directional movement with aligned indicators
• RANGING - Sideways movement with mixed directional signals
• VOLATILE - Elevated volatility with unpredictable price swings
• QUIET - Low volatility consolidation periods
• TRANSITIONAL - Market shifting between different regimes
2. Market Structure Analysis
Advanced pivot point analysis identifies:
• Higher Highs and Higher Lows for bullish structure
• Lower Highs and Lower Lows for bearish structure
• Structure breaks when established patterns fail
• Dynamic support and resistance from recent pivot points
• Key level proximity detection using ATR-based buffers
3. Volume Flow Decoding
Institutional activity detection through:
• Volume surge identification when volume exceeds 2x average
• Buy versus sell pressure analysis using price-volume correlation
• Flow strength measurement through directional volume consistency
• Divergence detection between volume and price movements
• Institutional threshold alerts when unusual volume patterns emerge
4. Multi-Period Momentum Synthesis
Weighted momentum calculation across four timeframes:
• 1-period momentum weighted at 40%
• 3-period momentum weighted at 30%
• 5-period momentum weighted at 20%
• 8-period momentum weighted at 10%
Result smoothed with 6-period EMA for noise reduction.
5. Price Action Quality Assessment
Each bar evaluated for:
• Range quality relative to 20-period average
• Body-to-range ratio for directional conviction
• Wick analysis for rejection pattern identification
• Pattern recognition including engulfing and hammer formations
• Sequential price movement analysis
6. Adaptive Parameter System
Parameters automatically adjust based on detected regime:
• Trending markets reduce sensitivity and confirmation requirements
• Volatile markets increase filtering and require additional confirmations
• Ranging markets maintain neutral settings
• Transitional markets use moderate adjustments
---
COMPLETE SETTINGS GUIDE
Section 1: Core Analysis Settings
Analysis Sensitivity (0.3-2.0)
• Default: 1.0
• Lower values require stronger price movements
• Higher values detect more subtle patterns
• Scalpers use 0.8-1.2, swing traders use 1.5-2.0
Noise Reduction Level (2-7)
• Default: 4
• Controls filtering of false patterns
• Higher values reduce pattern frequency
• Increase in volatile markets
Minimum Move % (0.05-0.50)
• Default: 0.15%
• Sets minimum price movement threshold
• Adjust based on instrument volatility
• Forex: 0.05-0.10%, Stocks: 0.15-0.25%, Crypto: 0.20-0.50%
High Confirmation Mode
• Default: True (Enabled)
• Requires all technical conditions to align
• Reduces frequency but increases reliability
• Disable for more aggressive pattern detection
Section 2: Market Regime Detection
Enable Regime Analysis
• Default: True (Enabled)
• Activates market environment evaluation
• Essential for adaptive features
• Keep enabled for best results
Regime Analysis Period (20-100)
• Default: 50 bars
• Determines regime calculation lookback
• Shorter for responsive, longer for stable
• Scalping: 20-30, Swing: 75-100
Minimum Market Clarity (0.2-0.8)
• Default: 0.4
• Quality threshold for pattern generation
• Higher values require clearer conditions
• Lower for more patterns, higher for quality
Adaptive Parameter Adjustment
• Default: True (Enabled)
• Enables automatic parameter optimization
• Adjusts based on market regime
• Highly recommended to keep enabled
Section 3: Market Structure Analysis
Enable Structure Validation
• Default: True (Enabled)
• Validates patterns against support/resistance
• Confirms trend structure alignment
• Essential for reliability
Structure Analysis Period (15-50)
• Default: 30 bars
• Period for structure pattern analysis
• Affects support/resistance calculation
• Match to your trading timeframe
Minimum Structure Alignment (0.3-0.8)
• Default: 0.5
• Required structure score for valid patterns
• Higher values need stronger structure
• Balance with desired frequency
Section 4: Analysis Configuration
Minimum Strength Level (3-5)
• Default: 4
• Minimum confirmations for pattern display
• 5 = Maximum reliability, 3 = More patterns
• Beginners should use 4-5
Required Technical Confirmations (4-6)
• Default: 5
• Number of aligned technical factors
• Higher = fewer but better patterns
• Works with High Confirmation Mode
Pattern Separation (3-20 bars)
• Default: 8 bars
• Minimum bars between patterns
• Prevents clustering and overtrading
• Increase for cleaner charts
Section 5: Technical Filters
Momentum Validation
• Default: True (Enabled)
• Requires momentum alignment
• Filters counter-trend patterns
• Essential for trend following
Volume Confluence Analysis
• Default: True (Enabled)
• Requires volume confirmation
• Identifies institutional participation
• Critical for reliability
Trend Direction Filter
• Default: True (Enabled)
• Only shows patterns with trend
• Reduces counter-trend signals
• Disable for reversal hunting
Section 6: Volume Flow Analysis
Institutional Activity Threshold (1.2-3.5)
• Default: 2.0
• Multiplier for unusual volume detection
• Lower finds more institutional activity
• Stock: 2.0-2.5, Forex: 1.5-2.0, Crypto: 2.5-3.5
Volume Surge Multiplier (1.8-4.5)
• Default: 2.5
• Defines significant volume increases
• Adjust per instrument characteristics
• Higher for stocks, lower for forex
Volume Flow Period (12-35)
• Default: 18 bars
• Smoothing for volume analysis
• Shorter = responsive, longer = smooth
• Match to timeframe used
Section 7: Analysis Frequency Control
Maximum Analysis Points Per Hour (1-5)
• Default: 3
• Limits pattern frequency
• Prevents overtrading
• Scalpers: 4-5, Swing traders: 1-2
Section 8: Target Level Configuration
Target Calculation Method
• Default: Market Adaptive
• Three modes available:
- Fixed: Uses set point distances
- Dynamic: ATR-based calculations
- Market Adaptive: Structure-based levels
Minimum Target/Risk Ratio (1.0-3.0)
• Default: 1.5
• Minimum acceptable reward vs risk
• Higher filters lower probability setups
• Professional standard: 1.5-2.0
Fixed Mode Settings:
• Fixed Target Distance: 50 points default
• Fixed Invalidation Distance: 30 points default
• Use for consistent instruments
Dynamic Mode Settings:
• Dynamic Target Multiplier: 1.8x ATR default
• Dynamic Invalidation Multiplier: 1.0x ATR default
• Adapts to volatility automatically
Market Adaptive Settings:
• Use Structure Levels: True (default)
• Structure Level Buffer: 0.1% default
• Places levels at actual support/resistance
Section 9: Visual Display Settings
Color Theme Options
• Professional (Teal/Red)
- Bullish: Teal (#26a69a)
- Bearish: Red (#ef5350)
- Neutral: Gray (#78909c)
- Best for: Traditional traders, clean appearance
• Dark (Neon Green/Pink)
- Bullish: Neon Green (#00ff88)
- Bearish: Hot Pink (#ff0044)
- Neutral: Dark Gray (#333333)
- Best for: Dark theme users, high contrast
• Light (Green/Red Classic)
- Bullish: Green (#4caf50)
- Bearish: Red (#f44336)
- Neutral: Light Gray (#9e9e9e)
- Best for: Light backgrounds, traditional colors
• Vibrant (Cyan/Magenta)
- Bullish: Cyan (#00ffff)
- Bearish: Magenta (#ff00ff)
- Neutral: Medium Gray (#888888)
- Best for: High visibility, modern appearance
Dashboard Position
• Options: Top Left, Top Right, Bottom Left, Bottom Right, Middle Left, Middle Right
• Default: Top Right
• Choose based on chart layout preference
Dashboard Size
• Full: Complete information display (desktop)
• Mobile: Compact view for small screens
• Default: Full
Analysis Display Style
• Arrows : Simple directional markers
• Labels : Detailed text information
• Zones : Colored areas showing pattern regions
• Default: Labels (most informative)
Display Options:
• Display Analysis Strength: Shows star rating
• Display Target Levels: Shows target/invalidation lines
• Display Market Regime: Shows regime in pattern labels
---
HOW TO USE SMPS - DETAILED GUIDE
Understanding the Dashboard
Top Row - Header
• SMPS Dashboard title
• VALUE column: Current readings
• STATUS column: Condition assessments
Market Regime Row
• Shows: TRENDING, RANGING, VOLATILE, QUIET, or TRANSITIONAL
• Color coding: Green = Favorable, Red = Caution
• Status: FAVORABLE or CAUTION trading conditions
Market Score Row
• Percentage from 0-100%
• Above 60% = Strong conditions
• 40-60% = Moderate conditions
• Below 40% = Weak conditions
Structure Row
• Direction: BULLISH, BEARISH, or NEUTRAL
• Status: INTACT or BREAK
• Orange BREAK indicates structure failure
Volume Flow Row
• Direction: BUYING or SELLING
• Intensity: STRONG or WEAK
• Color indicates dominant pressure
Momentum Row
• Numerical momentum value
• Positive = Upward pressure
• Negative = Downward pressure
Volume Status Row
• INST = Institutional activity detected
• HIGH = Above average volume
• NORM = Normal volume levels
Adaptive Mode Row
• ACTIVE = Parameters adjusting
• STATIC = Fixed parameters
• Shows required confirmations
Analysis Level Row
• Minimum strength level setting
• Pattern separation in bars
Market State Row
• Current analysis: BULLISH, BEARISH, NEUTRAL
• Shows analysis price level when active
T:R Ratio Row
• Current target to risk ratio
• GOOD = Meets minimum requirement
• LOW = Below minimum threshold
Strength Row
• BULL or BEAR dominance
• Numerical strength value 0-100
Price Row
• Current price
• Percentage change
Last Analysis Row
• Previous pattern direction
• Bars since last pattern
Reading Pattern Signals
Bullish Structure Pattern
• Upward triangle or "Bullish Structure" label
• Star rating shows strength (★★★★★ = strongest)
• Green line = potential target level
• Red dashed line = invalidation level
• Appears below price bars
Bearish Structure Pattern
• Downward triangle or "Bearish Structure" label
• Star rating indicates reliability
• Green line = potential target level
• Red dashed line = invalidation level
• Appears above price bars
Pattern Strength Interpretation
• ★★★★★ = 6 confirmations (exceptional)
• ★★★★☆ = 5 confirmations (strong)
• ★★★☆☆ = 4 confirmations (moderate)
• ★★☆☆☆ = 3 confirmations (minimum)
• Below minimum = filtered out
Visual Elements on Chart
Lines and Levels:
• Gray Line = 21 EMA trend reference
• Green Stepline = Dynamic support level
• Red Stepline = Dynamic resistance level
• Green Solid Line = Active target level
• Red Dashed Line = Active invalidation level
Pattern Markers:
• Triangles = Arrow display mode
• Text Labels = Label display mode
• Colored Boxes = Zone display mode
Target Completion Labels:
• "Target" = Price reached target level
• "Invalid" = Pattern invalidated by price
---
RECOMMENDED USAGE BY TIMEFRAME
1-Minute Charts (Scalping)
• Sensitivity: 0.8-1.2
• Noise Reduction: 3-4
• Pattern Separation: 3-5 bars
• High Confirmation: Optional
• Best for: Quick intraday moves
5-Minute Charts (Precision Intraday)
• Sensitivity: 1.0 (default)
• Noise Reduction: 4 (default)
• Pattern Separation: 8 bars
• High Confirmation: Enabled
• Best for: Day trading
15-Minute Charts (Short Swing)
• Sensitivity: 1.0-1.5
• Noise Reduction: 4-5
• Pattern Separation: 10-12 bars
• High Confirmation: Enabled
• Best for: Intraday swings
30-Minute to 1-Hour (Position Trading)
• Sensitivity: 1.5-2.0
• Noise Reduction: 5-7
• Pattern Separation: 15-20 bars
• Regime Period: 75-100
• Best for: Multi-day positions
Daily Charts (Swing Trading)
• Sensitivity: 1.8-2.0
• Noise Reduction: 6-7
• Pattern Separation: 20 bars
• All filters enabled
• Best for: Long-term analysis
---
MARKET-SPECIFIC SETTINGS
Forex Pairs
• Minimum Move: 0.05-0.10%
• Institutional Threshold: 1.5-2.0
• Volume Surge: 1.8-2.2
• Target Mode: Dynamic or Market Adaptive
Stock Indices (ES, NQ, YM)
• Minimum Move: 0.10-0.15%
• Institutional Threshold: 2.0-2.5
• Volume Surge: 2.5-3.0
• Target Mode: Market Adaptive
Individual Stocks
• Minimum Move: 0.15-0.25%
• Institutional Threshold: 2.0-2.5
• Volume Surge: 2.5-3.5
• Target Mode: Dynamic
Cryptocurrency
• Minimum Move: 0.20-0.50%
• Institutional Threshold: 2.5-3.5
• Volume Surge: 3.0-4.5
• Target Mode: Dynamic
• Increase noise reduction
---
PRACTICAL APPLICATION EXAMPLES
Example 1: Strong Trending Market
Dashboard Reading:
• Market Regime: TRENDING
• Market Score: 75%
• Structure: BULLISH, INTACT
• Volume Flow: BUYING, STRONG
• Momentum: +0.45
Interpretation:
• Strong uptrend environment
• Institutional buying present
• Look for bullish patterns as continuation
• Higher probability of success
• Consider using lower sensitivity
Example 2: Range-Bound Conditions
Dashboard Reading:
• Market Regime: RANGING
• Market Score: 35%
• Structure: NEUTRAL
• Volume Flow: SELLING, WEAK
• Momentum: -0.05
Interpretation:
• No clear direction
• Low opportunity environment
• Patterns are less reliable
• Consider waiting for regime change
• Or switch to a range-trading approach
Example 3: Structure Break Alert
Dashboard Reading:
• Previous: BULLISH structure
• Current: Structure BREAK
• Volume: INST flag active
• Momentum: Shifting negative
Interpretation:
• Trend reversal potentially beginning
• Institutional participation detected
• Watch for bearish pattern confirmation
• Adjust bias accordingly
• Increase caution on long positions
Example 4: Volatile Market
Dashboard Reading:
• Market Regime: VOLATILE
• Market Score: 45%
• Adaptive Mode: ACTIVE
• Confirmations: Increased to 6
Interpretation:
• Choppy conditions
• Parameters auto-adjusted
• Fewer but higher quality patterns
• Wider stops may be needed
• Consider reducing position size
Below are a few chart examples of the Smart Money Precision Structure (SMPS) indicator in action.
• Example 1 – Bullish Structure Detection on SOLUSD 5m
• Example 2 – Bearish Structure Detected with Strong Confluence on SOLUSD 5m
---
TROUBLESHOOTING GUIDE
No Patterns Appearing
Check these settings:
• High Confirmation Mode may be too restrictive
• Minimum Strength Level may be too high
• Market Clarity threshold may be too high
• Regime filter may be blocking patterns
• Try increasing sensitivity
Too Many Patterns
Adjust these settings:
• Enable High Confirmation Mode
• Increase Minimum Strength Level to 5
• Increase Pattern Separation
• Reduce Sensitivity below 1.0
• Enable all technical filters
Dashboard Shows "CAUTION"
This indicates:
• Market conditions are unfavorable
• Regime is RANGING or QUIET
• Market score is low
• Consider waiting for better conditions
• Or adjust expectations accordingly
Patterns Not Reaching Targets
Consider:
• Market may be choppy
• Volatility may have changed
• Try Dynamic target mode
• Reduce target/risk ratio requirement
• Check if regime is VOLATILE
---
ALERTS CONFIGURATION
Alert Message Format
Alerts include:
• Pattern type (Bullish/Bearish)
• Strength rating
• Market regime
• Analysis price level
• Target and invalidation levels
• Strength percentage
• Target/Risk ratio
• Educational disclaimer
Setting Up Alerts
• Click Alert button on TradingView
• Select SMPS indicator
• Choose alert frequency
• Customize message if desired
• Alerts fire on pattern detection
---
DATA WINDOW INFORMATION
The Data Window displays:
• Market Regime Score (0-100)
• Market Structure Bias (-1 to +1)
• Bullish Strength (0-100)
• Bearish Strength (0-100)
• Bull Target/Risk Ratio
• Bear Target/Risk Ratio
• Relative Volume
• Momentum Value
• Volume Flow Strength
• Bull Confirmations Count
• Bear Confirmations Count
---
BEST PRACTICES AND TIPS
For Beginners
• Start with default settings
• Use High Confirmation Mode
• Focus on TRENDING regime only
• Paper trade first
• Learn one timeframe thoroughly
For Intermediate Users
• Experiment with sensitivity settings
• Try different target modes
• Use multiple timeframes
• Combine with price action analysis
• Track pattern success rate
For Advanced Users
• Customize per instrument
• Create setting templates
• Use regime information for bias
• Combine with other indicators
• Develop systematic rules
---
IMPORTANT DISCLAIMERS
• This indicator is for educational and informational purposes only
• Not financial advice or a trading system
• Past performance does not guarantee future results
• Trading involves substantial risk of loss
• Always use appropriate risk management
• Verify patterns with additional analysis
• The author is not a registered investment advisor
• No liability accepted for trading losses
---
VERSION NOTES
Version 1.0.0 - Initial Release
• Six-layer confluence system
• Adaptive parameter technology
• Institutional volume detection
• Market regime classification
• Structure break identification
• Real-time dashboard
• Multiple display modes
• Comprehensive settings
## My Final Thoughts
Smart Money Precision Structure represents an advanced approach to market analysis, bringing institutional-grade techniques to retail traders through intelligent automation and multi-dimensional evaluation. By combining six analytical frameworks with adaptive parameter adjustment, SMPS provides comprehensive market intelligence that single indicators cannot achieve.
The indicator serves as an educational tool for understanding how professional traders analyze markets, while providing practical pattern detection for those seeking to improve their technical analysis. Remember that all trading involves risk, and this tool should be used as part of a complete analysis approach, not as a standalone trading system.
- BullByte

VWAP BANDS [qrsq]Description
This indicator is used to find support and resistance utilizing both buying and selling volume. It can be used on lower and higher time frames to understand where price is likely to reject or bounce.
How it works
Instead of calculating the VWAP using the total volume, this script estimates the buying/selling volume and respectively calculates their individual VWAP's. The standard deviations of these are then calculated to create the set of two bands. The top bands being the VWAP from buying volume and bottom bands are from selling volume, with the option to use a double band on either pair.
How to use it
I like to use the bands for LTF scalping as well as HTF swings, I also like to use it alongside my SMA VWAP BANDS.
For scalping:
I tend to use either the 5m or 15m TF
I then set the indicator's TF to 1m
I will take a scalp based on the bands confluence with other PA methods, if price is being either supported or rejected.
For swings:
I tend to use a variety of TFs, including: 30m, 1H, 4H, D
I then set the indicator's TF to "Chart"
I will take a swing based on the bands confluence with other PA methods, if price is being either supported or rejected.
I also tend to use them on perpetual contracts as the volume seems to be more consistent and hence results in more accurate support and resistance.

Bitcoin Scalping Strategy (Sampled with: PMARP+MADRID MA RIBBON)
DISCLAIMER:
THE CONTENT WITHIN THIS STRATEGY IS CREATED FROM TWO INDICATORS CREATED BY TWO PINESCRIPTER'S. THE STRATEGY WAS EXECUTED BY MYSELF AND REVERSE-ENGINEERED TO MEET THE CONDITIONS OF THE INTENDED STRATEGY REQUESTOR. I DO NOT TAKE CREDIT FOR THE CONTENT WITHIN THE ESTABLISHED LINES MADE CLEAR BY MYSELF.
The Sampled Scripts and creators:
PMAR/PMARP by @The_Caretaker Link to original script:
Madrid MA RIBBON BAR by @Madrid Link to original script:
Cheat Code's strategy notes:
This sampled strategy (Requested by @elemy_eth) is one combining previously created studies. I reverse-engineered the local scope for the Madrid moving average color plots and set entry and exit conditions for certain criteria met. This strategy is meant to deliver an extremely high hit rate on a daily time frame. This is made possible because of the very low take profit percentage, during the context of a macro downtrend it is made easier to hit 1-3% scalps which is made visible with the strategy using sampled scripts I created here.
How it works:
Entry Conditions:
-Enter Long's if the lime color conditions are met true using the script detailed by Marid's MA
- No re-entry into positions needs to be met true (this prevents pyramiding of orders due to conditions being met true) applicable to both long and short side entries.
- To increase hit rate and prevent traps both the parameters of rsi being sub 80 and no previously engulfing candles need to be met true to enter a long position.
- Enter Short's if the red color conditions of Madrid's moving average are met true.
- Closing Long positions are typically not met within this indicator, however, it still sometimes triggers if necessary. This consists of a pmarp sub 99 and a position size greater than 0.0
- Closing Short positions are typically not met within this indicator, however, it still sometimes triggers if necessary. This consists of a pmarp over 01 and a position size less than 0.0
- Stop Loss: 27.75% Take Profit: 1% (Which does not trigger on ticks over 1% so you will see average trade profits greater than 1%)
BYBIT:BTCUSDT BINANCE:BTCUSDT COINBASE:BTCUSD
Best Of Luck :)
-CheatCode1

SMA VWAP BANDS [qrsq]Description
This indicator is used to find support and resistance utilizing both SMA and VWAP. It can be used on lower and higher time frames to understand where price is likely to reject or bounce.
How it works
Rather than using the usual calculation for the VWAP, instead this script smooths the volume first with the SMA and then respectively calculates the smoothed multiplication of high, low and close price with the volume individually. These values are then divided by the smoothed volume to find individual VWAP's for each of the sources. The standard deviations of these are calculated, resulting in an upper, lower and middle band. It is essentially VWAP bands with some smoothed calculations in the middle.
How to use it
I like to use the bands for LTF scalping as well as HTF swings.
For scalping:
I tend to use either the 5m or 15m TF
I then set the indicator's TF to 1m
I will take a scalp based on the bands confluence with other PA methods, if price is being either supported or rejected.
For swings:
I tend to use a variety of TFs, including: 30m, 1H, 4H, D
I then set the indicator's TF to "Chart"
I will take a swing based on the bands confluence with other PA methods, if price is being either supported or rejected.
I also tend to use them on perpetual contracts as the volume seems to be more consistent and hence results in more accurate support and resistance.

RSI Scalping & Swing Signals With AlertsThis RSI indicator shows a green or red ribbon when the smoothed RSI is bullish or bearish. It also includes a long moving average for overall trend confirmation. Wait until the ribbon holds above or below the long moving average and take positions in that direction.
To get an easier to read RSI indicator, I smoothed the RSI out and paired it next to a short term RMA. These two together form the ribbon that will show you early reversals and trend direction. The long moving average is used as an overall trend detector and confirmation for longer term trends.
***HOW TO USE***
Scalping: Enter longs when the ribbon turns green and enter shorts when the ribbon turns red. Exit positions when the ribbon turns the opposite color or crosses the long moving average.
Swing Trading: When the ribbon holds above the long moving average or breaks out and retests it, look for long positions and exit when the ribbon turns red or crosses the long moving average. When the ribbon holds below the long moving average or breaks down and retests it, look for short positions and exit when the ribbon turns green or crosses the long moving average.
***DETAILS***
This indicator gives early reversal signals very well and waiting for the RSI ribbon to cross the long moving average helps to get you into positions when the market is ready to really move while filtering out some of the noise.
The ribbon and background will change to green or red depending on whether it is currently bullish or bearish.
There is also a label that changes colors and tells you if RSI is bullish or bearish and also whether the RSI ribbon is above or below the long moving average.
Green or red circles will appear on the indicator when there is a bullish or bearish cross of the RSI ribbon and the long moving average.
It also has alerts that trigger when RSI is turning bullish/bearish or when the RSI ribbon is crossing the long moving average.
***CUSTOMIZATION***
Each piece of this indicator can be customized to suit your preferences including the RSI source, length, smoothing length, short moving average length and long moving average length. You can also turn off the labels, signals and long moving average. All of these settings can be managed within the indicator settings input tab.
***MARKETS***
This indicator can be used as a signal on all markets, including stocks, crypto, futures and forex.
***TIMEFRAMES***
This RSI Scalping & Swing Signals indicator can be used on all timeframes.
***TIPS***
Try using numerous indicators of ours on your chart so you can instantly see the bullish or bearish trend of multiple indicators in real time without having to analyze the data. Some of our favorites are Trend Friend Scalp & Swing Trade Signals, Volume Spike Scanner, Buy & Sell Pressure Volume Profile, and Momentum Scalper in combination with this RSI indicator. They all have real time Bullish and Bearish labels as well so you can immediately understand each indicator's trend.

Momentum Scalping & Swing Signals With AlertsThis Momentum indicator shows a green or red ribbon when smoothed momentum is bullish or bearish. It also includes a long moving average for overall trend confirmation. Wait until the ribbon holds above or below the long moving average and take positions in that direction.
To get an easier to read momentum indicator, I smoothed the momentum out and paired it next to a short term RMA. These two together form the ribbon that will show you early reversals and trend direction. The long moving average is used as an overall trend detector and confirmation for longer term trends.
***HOW TO USE***
Scalping: Enter longs when the ribbon turns green and enter shorts when the ribbon turns red. Exit positions when the ribbon turns the opposite color or crosses the long moving average.
Swing Trading: When the ribbon holds above the long moving average or breaks out and retests it, look for long positions and exit when the ribbon turns red or crosses the long moving average. When the ribbon holds below the long moving average or breaks down and retests it, look for short positions and exit when the ribbon turns green or crosses the long moving average.
***DETAILS***
This indicator gives early reversal signals very well and waiting for the momentum ribbon to cross the long moving average helps to get you into positions when the market is ready to really move while filtering out some of the noise.
The ribbon and background will change to green or red depending on whether it is currently bullish or bearish.
There is also a label that changes colors and tells you if momentum is bullish or bearish and also whether the momentum ribbon is above or below the long moving average.
Green or red circles will appear on the indicator when there is a bullish or bearish cross of the momentum ribbon and the long moving average.
It includes alerts that trigger when momentum is turning bullish/bearish or when the momentum ribbon is crossing the long moving average.
***CUSTOMIZATION***
Each piece of this indicator can be customized to suit your preferences including the momentum source, length, smoothing length, short moving average length and long moving average length. You can also turn off the labels, signals and long moving average. All of these settings can be managed within the indicator settings input tab.
***MARKETS***
This indicator can be used as a signal on all markets, including stocks, crypto, futures and forex.
***TIMEFRAMES***
This Momentum Scalping & Swing Signals indicator can be used on all timeframes.
***TIPS***
Try using numerous indicators of ours on your chart so you can instantly see the bullish or bearish trend of multiple indicators in real time without having to analyze the data. Some of our favorites are Trend Friend Scalp & Swing Trade Signals, Volume Spike Scanner, Buy & Sell Pressure Volume Profile, and RSI Scalper in combination with this momentum indicator. They all have real time Bullish and Bearish labels as well so you can immediately understand each indicator's trend.

CF - KAMI KAMI EMA-HMA-VWMA SCALPERThis is your dark knight, your shining light in the crypto darkness... It's you and me against the machine..... rage, rage against the dying of the night!
This my greedy minions is the ticket..... the disruptive technology, the red pill, that breaks the Matrix.... get ready to join the revolution.
DESCRIPTION:
Lowest green/red line
The lowest alternating green red band is simply a general market indicator. It's EMA 50 over 200. This is a generally good indicator of current market conditions. If the band is red, you should favor taking short positions. If the band is green, long positions.
The three MA colored bands
This sophisticated indicator uses 3 central MA's in calculating its goodness. The HMA (Hull's Moving Average), at the bottom (of the three principal bands), is the most sensitive and responsive to immediate market conditions. It will generally give you the signal to enter or exit at the beginning of the price action move. But, this could also be a "false" signal - that doesn't continue in the expected direction.
The middle band is VWMA, volume-weighted moving average, and it is sensitive to volume - so it may turn green or red faster as volume increases or decreases. It gives somewhat similar signals to the top moving average which is the EMA or exponential moving average.
The GREEN RED signals
The signals below the bands which are true green and true red are "SUPER" signals which represent that all of the six small bands of each MA agree. These are very strong signals to enter and exit a position. If multiple SUPER signals agree this is even more confirmation.
SETTINGS
You can change the ema signals. They are currently optimized for scalping, but this indicator can work for larger timeframes.
I couldn't make this open-source as it represents a lot of work to get it to this point. If you are interested in this indicator and would like to have a custom version coded for your purposes, let me know.
Maximized Scalping On Trend (by Coinrule)" The trend is your friend. " This is one of the most famous and valuable teachings that experienced traders can give to newbies. There is a reason for that.
No matter your views about where the price moves, what matters is where the price heads to . The market is always right, and ultimately it decides who gets the profit and who has to take a loss.
The purpose of this strategy is to spot when it's the most suitable time to buy an asset profiting from a potential short-term price increase. The strategy tends to open trades frequently, closing them on average in one and a half days.
ENTRY
The buy order is placed on assets that present strong momentum when it's more likely that it is about to increase further in the short term.
To capture momentum on the asset, the rule strategy requires:
the MA50 greater than the MA100
the RSI greater than 50
The rule, then, places the order when
The price crosses above the MA9.
EXIT
This strategy comes with a stop loss and a take profit which adapt dynamically to market conditions.
The trade is closed in profit when the RSI is greater than 70 , as the trend could experience a pull-back.
Alternatively, the trade is closed when the RSI is lower than 30 , being this a sign of weakening of the trend.
Pro tip : The 1-hour time frame has proven to return the best results on average. The strategy can also work well in the 15-min time frame if you want to increase the trades' frequency.
The strategy assumes each order to trade 30% of the available capital and opens a trade at a time. A trading fee of 0.1% is taken into account.

Seven CCI Binary System by Hashtag_binarySeven CCI binary system is trend-momentum strategy based on CCI and exponential moving averages. This trading system is also good for scalping and intraday trading.
Rules for Binary Options:
- Time Frame 5 min or 15 min.
- Expiry time 4-5 candles.
- Trades only in trend.
Buy Call:
- EMA's lines color magenta above EMA's lines color blue;
- CCI lines color magenta are above CCI lines color blue and zero level.
- When thes conditions are agree buy call at opening of the next bar.
Buy Put:
- EMA's lines color magenta below EMA's lines color blue;
- CCI lines color magenta are below CCI lines color blue and zero level.
- When thes conditions are agree buy put at opening of the next bar.
Scalping:
-Time Frame 5 min, 15min.
- Currency Pairs: EUR/USD, GBP/USD, AUD/USD, USD/CHF, USD/JPY.
- The rules for buy and sell are the same.
- When the price is within the bundle of the moving averages do not trade.
Exit position
- Make Profit on the pivot points levels or with fast profit target.
- Initial stop loss on the previous swing price.
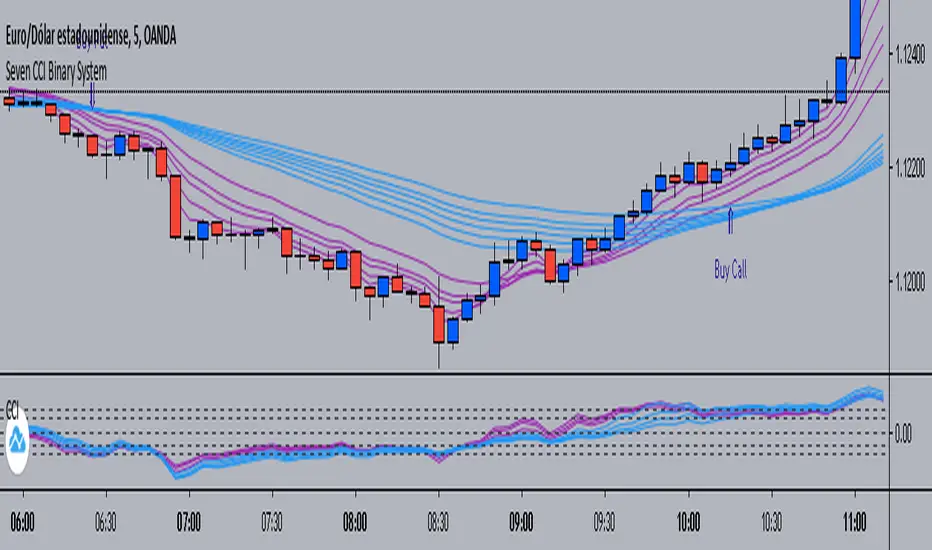
15MEX Momentum ScalperAlpha product project in development. Uses a combination of MACD and T3-CCI with tweaked settings to catch directional momentum and scalp a small move. Strategy is quantity of trades over quality of trades to build profits.
Use this strategy for 15-min Bitmex scalping on XBT contracts only. Recommend 100k contract size or less; backtested with 100k contracts.
Market enter, then use post-only limit exits and stop losses.
Setting is pre-optimized for 0.5% tp target and 0.5% sl of entry price. Recommend default 3 bars as basis for confirming recent MACD crossover as well as default 0.618 Fibonacci ratio as the T3-CCI basis.
Default risk level setting is approximately 2-3 trades a day. You can double the amount to 4-5 trades a day by enabling Aggressive mode. This may lead to larger profits and more entries, but with more frequent stop losses.
Future version will include trailing TPs/stops. Still undergoing optimization and refinement.