Screener based on Profitunity strategy for multiple timeframes
Screener based on Profitunity strategy by Bill Williams for multiple timeframes (max 5, including chart timeframe) and customizable symbol list. The screener analyzes the Alligator and Awesome Oscillator indicators, Divergent bars and high volume bars.
The maximum allowed number of requests (symbols and timeframes) is limited to 40 requests, for example, for 10 symbols by 4 requests of different timeframes. Therefore, the indicator automatically limits the number of displayed symbols depending on the number of timeframes for each symbol, if there are more symbols than are displayed in the screener table, then the ordinal numbers are displayed to the left of the symbols, in this case you can display the next group of symbols by increasing the value by 1 in the "Show tickers from" field, if the "Group" field is enabled, or specify the symbol number by 1 more than the last symbol in the screener table. 👀 When timeframe filtering is applied, the screener table displays only the columns of those timeframes for which the filtering value is selected, which allows displaying more symbols.
For each timeframe, in the "TIMEFRAMES > Prev" field, you can enable the display of data for the previous bar relative to the last (current) one, if the market is open for the requested symbol. In the "TIMEFRAMES > Y" field, you can enable filtering depending on the location of the last five bars relative to the Alligator indicator lines, which are designated by special symbols in the screener table:
⬆️ — if the Alligator is open upwards (Lips > Teeth > Jaw) and none of the bars is closed below the Lips line;
↗️ — if one of the bars, except for the penultimate one, is closed below Lips, or two bars, except for the last one, are closed below Lips, or the Alligator is open upwards only below four bars, but none of the bars is closed below Lips;
⬇️ — if the Alligator is open downwards (Lips < Teeth < Jaw), but none of the bars is closed above Lips;
↘️ — if one of the bars, except the penultimate one, is closed above the Lips, or two bars, except the last one, are closed above the Lips, or the Alligator is open down only above four bars, but none of the bars are closed above the Lips;
➡️ — in other cases, including when the Alligator lines intersect and one of the bars is closed behind the Lips line or two bars intersect one of the Alligator lines.
In the "TIMEFRAMES > Show bar change value for TF" field, you can add a column to the right of the selected timeframe column with the percentage change between the closing price of the last bar (current) and the closing price of the previous bar ((close – previous close) / previous close * 100). Depending on the percentage value, the background color of the screener table cell will change: dark red if <= -3%; red if <= -2%, light red if <= -0.5%; dark green if >= 3%; green if >= 2%; light green if >= 0.5%.
For each timeframe, the screener table displays the symbol of the latest (current) bar, depending on the closing price relative to the bar's midpoint ((high + low) / 2) and its location relative to the Alligator indicator lines: ⎾ — the bar's closing price is above its midpoint; ⎿ — the bar's closing price is below its midpoint; ├ — the bar's closing price is equal to its midpoint; 🟢 — Bullish Divergent bar, i.e. the bar's closing price is above its midpoint, the bar's high is below all Alligator lines, the bar's low is below the previous bar's low; 🔴 — Bearish Divergent bar, i.e. the bar's closing price is below its midpoint, the bar's low is above all Alligator lines, the bar's high is above the previous bar's high. When filtering is enabled in the "TIMEFRAMES > Filtering by Divergent bar" field, the data in the screener table cells will be displayed only for those timeframes that have a Divergent bar. A high bar volume signal is also displayed — 📶/📶² if the bar volume is greater than 40%/70% of the average volume value calculated using a simple moving average (SMA) in the 140 bar interval from the last bar.
In the indicator settings in the "SYMBOL LIST" field, each ticker (for example: OANDA:SPX500USD) must be on a separate line. If the market is closed, then the data for requested symbols will be limited to the time of the last (current) bar on the chart, for example, if the current symbol was traded yesterday, and the requested symbol is traded today, when requesting data for an hourly timeframe, the last bar will be for yesterday, if the timeframe of the current chart is not higher than 1 day. Therefore, by default, a warning will be displayed on the chart instead of the screener table that if the market is open, you must wait for the screener to load (after the first price change on the current chart), or if the highest timeframe in the screener is 1 day, you will be prompted to change the timeframe on the current chart to 1 week, if the screener requests data for the timeframe of 1 week, you will be prompted to change the timeframe on the current chart to 1 month, or switch to another symbol on the current chart for which the market is open (for example: BINANCE:BTCUSDT), or disable the warning in the field "SYMBOL LIST > Do not display screener if market is close".
The number of the last columns with the color of the AO indicator that will be displayed in the screener table for each timeframe is specified in the indicator settings in the "AWESOME OSCILLATOR > Number of columns" field.
For each timeframe, the direction of the trend between the price of the highest and lowest bars in the specified range of bars from the last bar is displayed — ↑ if the trend is up (the highest bar is to the right of the lowest), or ↓ if the trend is down (the lowest bar is to the right of the highest). If there is a divergence on the AO indicator in the specified interval, the symbol ∇ is also displayed. The average volume value is also calculated in the specified interval using a simple moving average (SMA). The number of bars is set in the indicator settings in the "INTERVAL FOR HIGHEST AND LOWEST BARS > Bars count" field.
In the indicator settings in the "STYLE" field you can change the position of the screener table relative to the chart window, the background color, the color and size of the text.
***
Скринер на основе стратегии Profitunity Билла Вильямса для нескольких таймфреймов (максимум 5, включая таймфрейм графика) и настраиваемого списка символов. Скринер анализирует индикаторы Alligator и Awesome Oscillator, Дивергентные бары и бары с высоким объемом.
Максимально допустимое количество запросов (символы и таймфреймы) ограничено 40 запросами, например, для 10 символов по 4 запроса разных таймфреймов. Поэтому в индикаторе автоматически ограничивается количество отображаемых символов в зависимости от количества таймфреймов для каждого символа, если символов больше чем отображено в таблице скринера, то слева от символов отображаются порядковые номера, в таком случае можно отобразить следующую группу символов, увеличив значение на 1 в настройках индикатора поле "Show tickers from", если включено поле "Group", или указать номер символа на 1 больше, чем последний символ в таблице скринера. 👀 Когда применяется фильтрация по таймфрейму, в таблице скринера отображаются только столбцы тех таймфреймов, для которых выбрано значение фильтрации, что позволяет отображать большее количество символов.
Для каждого таймфрейма в настройках индикатора в поле "TIMEFRAMES > Prev" можно включить отображение данных для предыдущего бара относительно последнего (текущего), если для запрашиваемого символа рынок открыт. В поле "TIMEFRAMES > Y" можно включить фильтрацию, в зависимости от расположения последних пяти баров относительно линий индикатора Alligator, которые обозначаются специальными символами в таблице скринера:
⬆️ — если Alligator открыт вверх (Lips > Teeth > Jaw) и ни один из баров не закрыт ниже линии Lips;
↗️ — если один из баров, кроме предпоследнего, закрыт ниже Lips, или два бара, кроме последнего, закрыты ниже Lips, или Alligator открыт вверх только ниже четырех баров, но ни один из баров не закрыт ниже Lips;
⬇️ — если Alligator открыт вниз (Lips < Teeth < Jaw), но ни один из баров не закрыт выше Lips;
↘️ — если один из баров, кроме предпоследнего, закрыт выше Lips, или два бара, кроме последнего, закрыты выше Lips, или Alligator открыт вниз только выше четырех баров, но ни один из баров не закрыт выше Lips;
➡️ — в остальных случаях, в то числе когда линии Alligator пересекаются и один из баров закрыт за линией Lips или два бара пересекают одну из линий Alligator.
В поле "TIMEFRAMES > Show bar change value for TF" можно добавить справа от выбранного столбца таймфрейма столбец с процентным изменением между ценой закрытия последнего бара (текущего) и ценой закрытия предыдущего бара ((close – previous close) / previous close * 100). В зависимости от величины процента будет меняться цвет фона ячейки таблицы скринера: темно-красный, если <= -3%; красный, если <= -2%, светло-красный, если <= -0.5%; темно-зеленый, если >= 3%; зеленый, если >= 2%; светло-зеленый, если >= 0.5%.
Для каждого таймфрейма в таблице скринера отображается символ последнего (текущего) бара, в зависимости от цены закрытия относительно середины бара ((high + low) / 2) и расположения относительно линий индикатора Alligator: ⎾ — цена закрытия бара выше его середины; ⎿ — цена закрытия бара ниже его середины; ├ — цена закрытия бара равна его середине; 🟢 — Бычий Дивергентный бар, т.е. цена закрытия бара выше его середины, максимум бара ниже всех линий Alligator, минимум бара ниже минимума предыдущего бара; 🔴 — Медвежий Дивергентный бар, т.е. цена закрытия бара ниже его середины, минимум бара выше всех линий Alligator, максимум бара выше максимума предыдущего бара. При включении фильтрации в поле "TIMEFRAMES > Filtering by Divergent bar" данные в ячейках таблицы скринера будут отображаться только для тех таймфреймов, где есть Дивергентный бар. Также отображается сигнал высокого объема бара — 📶/📶², если объем бара больше чем на 40%/70% среднего значения объема, рассчитанного с помощью простой скользящей средней (SMA) в интервале 140 баров от последнего бара.
В настройках индикатора в поле "SYMBOL LIST" каждый тикер (например: OANDA:SPX500USD) должен быть на отдельной строке. Если рынок закрыт, то данные для запрашиваемых символов будут ограничены временем последнего (текущего) бара на графике, например, если текущий символ торговался последний день вчера, а запрашиваемый символ торгуется сегодня, при запросе данных для часового таймфрейма, последний бар будет за вчерашний день, если таймфрейм текущего графика не выше 1 дня. Поэтому по умолчанию на графике будет отображаться предупреждение вместо таблицы скринера о том, что если рынок открыт, то необходимо дождаться загрузки скринера (после первого изменения цены на текущем графике), или если в скринере самый высокий таймфрейм 1 день, то будет предложено изменить на текущем графике таймфрейм на 1 неделю, если в скринере запрашиваются данные для таймфрейма 1 неделя, то будет предложено изменить на текущем графике таймфрейм на 1 месяц, или же переключиться на другой символ на текущем графике, для которого рынок открыт (например: BINANCE:BTCUSDT), или отключить предупреждение в поле "SYMBOL LIST > Do not display screener if market is close".
Количество последних столбцов с цветом индикатора AO, которые будут отображены в таблице скринера для каждого таймфрейма, указывается в настройках индикатора в поле "AWESOME OSCILLATOR > Number of columns".
Для каждого таймфрейма отображается направление тренда между ценой самого высокого и самого низкого баров в указанном интервале баров от последнего бара — ↑, если тренд направлен вверх (самый высокий бар справа от самого низкого), или ↓, если тренд направлен вниз (самый низкий бар справа от самого высокого). Если есть дивергенция на индикаторе AO в указанном интервале, то также отображается символ — ∇. В указанном интервале также рассчитывается среднее значение объема с помощью простой скользящей средней (SMA). Количество баров устанавливается в настройках индикатора в поле "INTERVAL FOR HIGHEST AND LOWEST BARS > Bars count".
В настройках индикатора в поле "STYLE" можно изменить положение таблицы скринера относительно окна графика, цвет фона, цвет и размер текста.
Cari dalam skrip untuk "screener"

[Screener]_[Detect_Day_Hi_Lo_Screener]_[with_Alerts]_ _
- A Screener that can scan a given list of symbols to detect Day High and Day Low as they occur.
- The Symbols can be selected from the settings
- Alerts can be configured to be informed as and when the Day High/Day Low is detected for any of the selected symbols
- This screener is best used along with my other indicator ---> " _ _ _ _ "
------------------
This screener can be configured with any condition to be alerted on.
------------------

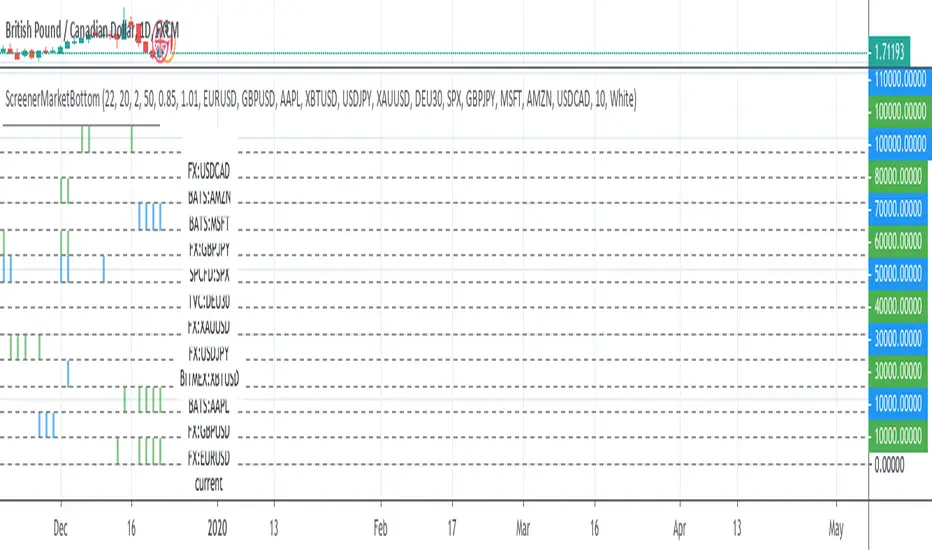
ScreenerMarketBottomThis study works as screener with alerts for ChrisMoody's scritp CM_Williams_Vix_Fix Finds Market Bottoms .
Refers to original study for the code: I converted it in a function and I used my snippets of pine script codes for convert it in a screener.
I'm thinking to transform it in a strategy: if someone has suggestion on startegy logic please let me know. For example enter long after three lime color bars?
Please use comment section for any feedback.
Next improvement (only to whom is interested to this script and follows me): study with alerts on multiple tickers all at one. Leave a comment if you want to have access to study.
Screener - Moving Average / ATR Breakout Signal [ARTech]Screener - Moving Average / ATR Breakout Signal
This indicator features a powerful multi-symbol screener that scans up to 40 user-defined symbols in real time for Moving Average (MA) and ATR breakout signals. Users can customize the list of symbols, select the asset class (e.g., Crypto, Stocks, Forex). The screener detects trend-following signals based on price crossing a chosen MA type and length, enhanced by optional ATR-based volatility filters and breakout thresholds to improve signal accuracy. Signals can be displayed on the chart via labels, tooltips, or a compact signal table, allowing traders to monitor multiple markets simultaneously without switching charts. The list of symbols generating signals can also be tracked with customizable alerts, enabling traders to receive real-time notifications for long and short breakout signals directly via TradingView alerts.
This indicator is developed based on the concept of Moving Average / ATR Breakout Signal script on TradingView, with enhancements to support multi-symbol scanning.
Key Features
• Multi-Symbol Screener: Scans up to 40 user-defined symbols simultaneously, with automatic separator detection and symbol validation.
• Repaint Prevention: Carefully designed to avoid repaint issues. The script structure and signal logic have been built to ensure reliable behavior, even across multiple symbols and varying chart conditions.
• Flexible Signal Display: Offers chart labels, tooltips, or a compact table to show signals, enabling multi-market monitoring without switching charts.
• Customizable Alerts: Supports alerts for both long and short signals, sending a list of symbols generating signals as real-time notifications.
• Multi-Type Moving Average Support: Choose from several MA types including EMA, SMA, Hull MA, VWMA, RMA, and TEMA, with customizable source and length settings.
• Flexible Signal Logic: Generates signals when price breaks above or below the selected MA, with options for confirmation candles and wick or close based breakout detection.
• ATR-Based Filtering: Utilizes ATR to create dynamic breakout bands around the MA, reducing noise and improving breakout validation.
• Breakout Threshold Filtering: Adds an optional minimum percentage price move before a new opposite signal is allowed, preventing rapid reversals.
Why use this indicator?
• Scans up to 40 symbols at the same time.
• Users can define the symbol list, asset class, and automatically detects the symbol separator; warns if any symbols are invalid
• Detected signals are shown directly on the chart as labels, tooltips, or in a compact table.
• The list of signal-generating symbols can be tracked with alerts — no need to watch the chart constantly.
How to Use
███████ Alerts ███████
🔸 Long / Short
To enable Custom Alerts, select the desired alert type (Long or Short) from the indicator's settings under the "Alerts" section, you can customize messages and enable notifications for Long and Short signals. Then, you need to activate the fx alert() function call option in TradingView’s alert creation dialog.
Alert messages include your custom message followed by a list of symbols currently giving signals, each shown on a new line. For example, if your input message is set to “🟢 Long Signal” and BTCUSD and ETHUSD are signaling, the alert will look like this:
🟢 Long Signal
BTCUSD
ETHUSD
This format helps you clearly see the type of signal and each symbol individually, making real-time monitoring easier.
🔸 Alert Delay (seconds)
This setting adds a delay before alerts are triggered. It helps ensure that signals are based on confirmed bar closures for slight timing differences between symbol data feeds (especially in multi-symbol mode). For example, setting a 30-second delay allows all symbols to finish processing before the alert fires, avoiding early or incomplete signal lists.
For best results, try different delay values to see what works best with your selected timeframe.
███████ Display / Signal ███████
🔸 Display Mode
Choose how the indicator presents signals on your chart. Focus on a single symbol (Chart mode), Scan and display multiple symbols at once (Screener mode), or hide visuals and use only tables or alerts (No mode).
• Chart Mode: Displays signals only for the current chart symbol. Useful for testing and optimizing signal conditions before scanning multiple assets.
• Screener Mode: Activates the screener functionality, showing results for all valid symbols in your list. Signals appear as labels on the chart and are also listed in the signal table for easy tracking.
• No (Table Only): Hides all on-chart visuals (labels, markers). Signals are still processed and can be viewed in tables or used with alerts. This mode is ideal when you're using multiple screeners at once and want to avoid overlapping visuals. Each screener can display its results in separate table positions (e.g., bottom right, top left, etc.), so turning off chart visuals helps keep your workspace clean while still tracking multiple symbol groups efficiently. This way, you can also track more than 40 symbols by using multiple screener instances with different symbol groups and table positions.
🔸 Long
You can independently turn ON or OFF the display of Long signals using the toggle.
🔸 Short
You can independently turn ON or OFF the display of Short signals using the toggle.
███████ Symbols ███████
🔸 Symbols
You can enter up to 40 symbols. Symbols must be written in full format. For example: BINANCE:BTCUSDT, NASDAQ:AAPL, or OANDA:EURUSD. TradingView requires this full format to correctly recognize each symbol. Due to TradingView’s limitations, only the first 40 symbols in your list will be processed
- Separator Rules: Letters (A–Z), numbers (0–9), underscore (_), dot (.), and exclamation mark (!) are allowed within symbol names (e.g., BINANCE:BTCUSDT.P). Therefore, avoid using them as separators. Instead, use comma (,) , semicolon (;) , space , or newline to separate multiple symbols.
- Auto Detection: The indicator automatically detects the separator used in your list. If the format is incorrect or a symbol is invalid, a warning will appear to help you fix it.
🔸 Symbol Filter
When scanning multiple symbols, it's important that they belong to the same market type (Crypto, Stocks, Forex, etc.). Different markets have different trading hours, and mixing them may cause issues.
For example, if your chart is using a stock symbol (like NASDAQ:AAPL) and your symbol list includes crypto symbols (like BINANCE:BTCUSDT), the screener may not work correctly. Since stock markets are not open 24/7, the chart time may fall outside of crypto trading hours — causing crypto signals to fail or not update properly.
To avoid this issue, the indicator includes a Symbol Filter. This lets you filter your symbol list to include only the correct asset type (e.g., only Crypto or only Stocks). By using this filter, you make sure the screener runs under the correct market conditions and avoids signal mismatches.
If you set the filter to None , no filtering will be applied. In this case, you are responsible for making sure all listed symbols match your chart’s market type.
For best results, always use symbols from the same market type as your chart symbol. This ensures that candle open/close times align across all symbols, avoiding timing mismatches. Symbols and the chart must follow the same market hours for accurate and consistent signal generation.
🔸 Show Symbols on Table
This feature helps you quickly review the symbols you've entered. When enabled, a table appears in the bottom-right corner of the chart displaying all symbols from your list along with their market types and statuses
- Green background: Symbol is valid and matches the selected Symbol Filter. It can generate signals.
- Gray background: Symbol is valid but does not match the selected filter. It will not generate signals.
- Red background: Symbol is invalid (e.g., due to incorrect names, delisting, or unsupported by broker).
You don’t need to remove invalid or mismatched symbols, but no signals will be generated for them. This visual check makes it easier to catch symbol issues before relying on the screener output.
███████ Signal Display Style ███████
🔸 Display Method
Choose how signals will be shown visually
• Label: The signal appears as a label on the candle. The label includes all triggering symbols as text.
• Tooltip: An icon (such as 🟢 or 🔴) is shown instead of full text. Hold your mouse pointer on the icon on chart for a few seconds to see a tooltip listing the triggered symbols. This method keeps your chart cleaner and less cluttered.
• None: No visual markers appear on candles. Signals are only visible in the signal table — ideal if you're using multiple indicators and want to avoid chart clutter.
🔸 Symbol Display Format
This setting affects the labels, tooltips, signal table, and alert messages, ensuring consistency across all displays. Select whether you want symbols to appear as:
• EXCHANGE:SYMBOL: BINANCE:BTCUSDT
• SYMBOL: BTCUSDT
🔸 Long Signal Icon
Used only in Tooltip mode, these icons (e.g., 🟢 for Long) appear on bars where signals are detected. Customize it freely to match your style or strategy.
🔸 Short Signal Icon
Used only in Tooltip mode, these icons (e.g., 🔴 for Short) appear on bars where signals are detected. Customize it freely to match your style or strategy.
🔸 Size
Adjust the visual size of labels or tooltips. Smaller sizes help reduce clutter when many signals trigger in close proximity.
███████ Signal Table ███████
This section controls the appearance and behavior of the signal table that displays last detected Long and Short signals for your symbols.
🔸 Show
Enable or disable the signal table display on the chart.
🔸 Highlight Signal Duration (Bars)
When a signal occurs, the corresponding cell in the table is highlighted using the selected Long or Short color for this many bars. This helps visually track recent signals over time. The bar where the signal icon appears is counted as 1.
🔸 Table Size
Choose the size of the table to fit your chart layout and readability preferences.
🔸 Table Position
Select where the table appears on your chart (e.g., top right, middle right, bottom left).
🔸 Title
Customize the table header text. The default is “Recent Signals”.
🔸 Background Color
Set the table’s background color and transparency to match your chart’s theme.
🔸 Long Signal Color
Choose the highlight color used to mark Long signals within the table.
🔸 Short Signal Color
Choose the highlight color used to mark Short signals within the table.
🔸 Text Color
Customize the text color inside the table for better contrast and readability.
🔸 Show Bars Since Signal
Optionally display how many bars have passed since each signal appeared. The bar where the signal occurs counts as 1.
███████ Signal ███████
This is the core component of the signal system. You can customize:
🔸 Moving Average Type
Choose from SMA, EMA, WMA, Hull MA, VWMA, RMA, or TEMA
🔸 Length
Adjust the length to suit your strategy.
🔸 Source
Select which price data (e.g., Close, Open, HL2) is used to calculate the MA.
🔸 Confirm Candles
Defines the number of consecutive candles that must break the selected level to confirm a signal.
– If ATR filter is enabled, this level is the ATR bands.
– If ATR is disabled, the Moving Average line is used.
This helps filter out noise and avoid premature signals.
🔸 Break Type
Specifies how the candle must break the level:
– Close: The candle must close beyond the level.
– Wick: A wick touching or exceeding the level is enough.
Both options generate signals only after the candle has closed.
🔸 Filter
This section provides optional filters to improve signal accuracy.
ATR
When the ATR filter is enabled, signals are generated only if the price breaks above the upper ATR line or below the lower ATR line—calculated by adding or subtracting the ATR multiplied threshold from the moving average—and the breakout must occur for the number of consecutive confirmation candles specified by the user input . This helps reduce false signals during low volatility periods.
• Multiplier: Adjusts the width of ATR bands by multiplying the ATR value.
• Length: Sets the period for ATR calculation.
• Smoothing: Selects the smoothing method applied to the ATR (RMA, SMA, EMA, WMA).
Breakout
When enabled, breakout confirmation requires the price to cross above the upper breakout line or below the lower breakout line by a specified percentage from the last signal price.
• Threshold (%): Defines the minimum percentage price movement required to validate a breakout.
• Show Breakout Levels: Toggle to display or hide breakout threshold area on the chart.

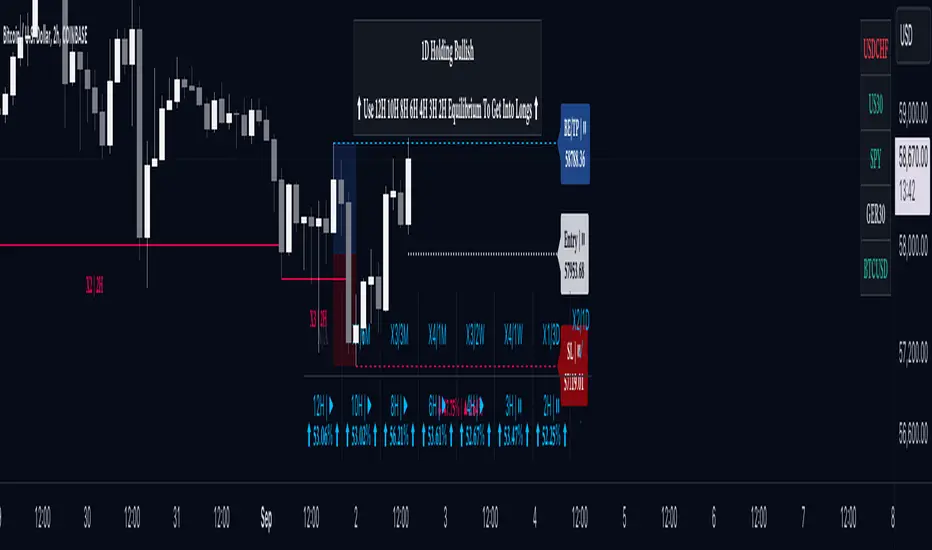
Screener | FractalystWhat’s the purpose of this indicator?
This indicator is part of the Optirange suite , which analyzes all timeframes using a mechanical top-down approach to determine the overall market bias. It helps you identify the specific timeframes and exact levels for positioning in longs, shorts, or guiding you on whether to stay away from trading a particular market condition.
The purpose of the Screener indicator is to track the contextual bias of multiple markets simultaneously on the charts without the need to switch between pairs. This allows traders to monitor various assets in real-time, enhancing decision-making efficiency and identifying potential trading opportunities more effectively.
-----
How does this indicator identify the overall market bias?
This indicator employs a systematic top-down approach, analyzing market structure, fractal blocks, and their mitigations from the 12M timeframe down to the 1D timeframe to uncover the story behind the market. This method helps identify the overall market bias, whether it’s bullish, bearish, or in consolidating conditions.
Below is a flowchart that illustrates the calculation behind the market context identification, demonstrating the systematic approach:
-----
According to the above trade plan, why do we only look for mitigations within Fractal Blocks of X1/X2?
In this context, "X" stands for a break in the market's structure, and the numbers (1 and 2) indicate the sequence of these breaks within the same trend direction, either up or down.
We focus on mitigations within Fractal Blocks during the X1/X2 stages because these points mark the early phase (X1) and the continuation (X2) of a trend. By doing so, we align our trades with the market's main direction and avoid getting stopped out in the middle of trends.
-----
How does this indicator identify ranges in a mechanical way?
Since the indicator is part of the Optirange suite , it follows the exact rules that Optirange utilizes to identify breaks of market structures in a mechanical manner.
Let’s take a closer look at how the ranges are calculated:
1- First, we need to understand the importance of following a set of mechanical rules in identifying market structure:
The image above illustrates the difference between a subjective and a mechanical approach to analyzing market structure. The subjective method often leads to uncertainty, where traders might struggle to pinpoint exact breaks in structure, resulting in inconsistent decision-making. Questions like “Is this a break?” or “Maybe this one...?” reflect the ambiguity of manual interpretation, which can cause confusion and errors in trading.
On the other hand, the mechanical approach depicted on the right side of the image follows a clear, rule-based method to define breaks in market structure. This systematic approach eliminates guesswork by providing precise criteria for identifying structural changes, such as marking structural invalidation levels where market bias shifts from bullish to bearish or vice versa. The mechanical method not only offers consistency but also integrates statistical probabilities , enhancing the trader's ability to make data-driven decisions.
By adhering to these mechanical rules, the Screener indicator ensures that ranges are identified consistently, allowing traders to rely on objective analysis rather than subjective interpretation . This approach is crucial for accurately defining market structures and making informed trading decisions.
2- Now let's take a look at a practical example of how the indicator utilizes Pivot points with a period of 2 to identify ranges:
In this image, we see a Bearish Scenario on the left and a Bullish Scenario on the right. The indicator starts by identifying the first significant swing on the chart. It then validates this swing by checking if there is a preceding swing high (for a bearish scenario) or swing low (for a bullish scenario). Once validated, the indicator confirms a break of structure when price closes below or above these points, respectively.
For instance, in the Bearish Scenario:
The first significant swing is identified.
The script checks for a preceding swing high before confirming any structural break.
A candle closure below the swing low confirms the first bearish break of structure.
This results in a confirmed market bias towards bearishness, with structural liquidity levels indicated for potential price targets.
In the Bullish Scenario:
The process is mirrored, identifying the first swing low and validating it with a preceding swing low.
A closure above this swing confirms the bullish break of structure.
This leads to a market bias towards bullishness, with invalidation levels to watch if the trend shifts.
This practical example demonstrates how the indicator systematically identifies market ranges, ensuring that traders can make informed decisions based on clear, rule-based criteria.
-----
How does this indicator identify ranges in a mechanical way, What are the underlying calculations?
Fractal blocks refer to the most extreme swing candle within the latest break. They can serve as significant levels for price rejection and may guide movements toward the next break, often in confluence with topdown analysis for added confirmation.
-----
What are mitigations, What are the underlying calculations?
Mitigations refer to specific price action occurrences identified by the script:
1- When the price reaches the most recent fractal block and confirms a swing candle, the script automatically draws a line from the swing to the fractal block bar and labels it with a checkmark.
2- If the price wicks through the invalidation level and then retraces back to the fractal block while forming a swing candle, the script labels this as a double mitigation on the chart.
This level will serve as the next potential invalidation level if a break occurs in the same direction.
-----
What does the right table display?
The table located at the right of your chart displays five colored symbols that represent the contextual market bias:
Green: The market is in a bullish condition.
Red: The market is in a bearish condition.
White: The market condition is uncertain, and it is advisable to stay away from trading.
-----
What does the bottom table display?
The bottom table can be turned on in the Optirange indicator and serves multiple purposes:
Range Counts and Mitigations: It shows the range counts and their mitigations across multiple timeframes, providing a comprehensive view of market dynamics.
Hourly Timeframe Probabilities: The bottom row of the bias table displays the probabilities for various hourly timeframes, helping to identify potential entry levels based on the multi-timeframe bias determined by the Screener.
In a bullish market context, you should look for long positions by focusing on hourly timeframes where buy-side probability exceeds 50%.
In a bearish market context, you should look for short positions by focusing on hourly timeframes where the sell-side probability exceeds 50%.
When the symbol is white within the Screener table, it signals that the market bias is unclear, and it's recommended to stay away from trading in such conditions.
-----
How the range probabilities are calculated?
Each break of market structure, denoted as X, is assigned a unique ID, starting from X1 for the first break, X2 for the second, and so on.
The probabilities are calculated based on breaks holding, meaning price closing through the liquidity level, rather than invalidation. This probability is then divided by the total count of similar numeric breaks.
For example, if 75 out of 100 bullish X1s become X2, then the probability of X1 becoming X2 on your charts will be displayed as 75% in the following format: ⬆ 75%
-----
What does the top table display?
The top table on the charts displays the current market context, offering insights into the underlying bias. It highlights the high-timeframe (HTF) bias and guides you on which timeframes you should use to enter long or short positions, based on the probability of success.
Additionally, when the market bias is unclear, the table clearly signals that it's best to avoid trading that specific market until the context or market story becomes clearer. This helps traders make informed decisions and avoid uncertain market conditions.
-----
How does the Screener indicator identify the market bias/context/story ?
- Market Structure: The Optirange indicator analyzes market structure across multiple timeframes, from a top-down perspective, including 12M, 6M, 3M, 1M, 2W, 1W, 3D, and 1D.
- Fractal Blocks: Once the market structure or current range is identified, the indicator automatically identifies the last push before the break and draws it as a box. These zones acts as a key area where the price often rejects from.
- Mitigations: After identifying the Fractal Block, the indicator checks for price mitigation or rejection within this zone. If mitigation occurs, meaning the price has reacted or rejected from the Fractal Block, the indicator draws a checkmark from the deepest candle within the Fractal Block to the initial candle that has created the zone.
- Bias Table: After identifying the three key elements—market structure, Fractal Blocks, and price mitigations—the indicator compiles this information into a multi-timeframe table. This table provides a comprehensive top-down perspective, showing what is happening from a structural standpoint across all timeframes. The Bias Table presents raw data, including identified Fractal Blocks and mitigations, to help traders understand the overall market trend. This data is crucial for the screener, which uses it to determine the current market bias based on a top-down analysis.
- Screener: Once all higher timeframes (HTF) and lower timeframes (LTF) are calculated using the indicator, it follows the exact rules outlined in the flowchart to determine the market bias. This systematic approach not only helps identify the current market trend but also suggests the exact timeframes to use for finding entry, particularly on hourly timeframes.
Example:
12M Timeframe:
OANDA:EURUSD
6M Timeframe :
OANDA:EURUSD
3M Timeframe :
OANDA:EURUSD
1M Timeframe :
OANDA:EURUSD
2W Timeframe :
OANDA:EURUSD
1W Timeframe :
OANDA:EURUSD
-----
User-input settings and customizations
Terms and Conditions | Disclaimer
Our charting tools are provided for informational and educational purposes only and should not be construed as financial, investment, or trading advice. They are not intended to forecast market movements or offer specific recommendations. Users should understand that past performance does not guarantee future results and should not base financial decisions solely on historical data. By utilizing our charting tools, the buyer acknowledges that neither the seller nor the creator assumes responsibility for decisions made using the information provided. The buyer assumes full responsibility and liability for any actions taken and their consequences, including potential financial losses. Therefore, by purchasing these charting tools, the customer acknowledges that neither the seller nor the creator is liable for any unfavorable outcomes resulting from the development, sale, or use of the products.
The buyer is responsible for canceling their subscription if they no longer wish to continue at the full retail price. Our policy does not include reimbursement, refunds, or chargebacks once the Terms and Conditions are accepted before purchase.
By continuing to use our charting tools, the user acknowledges and accepts the Terms and Conditions outlined in this legal disclaimer.
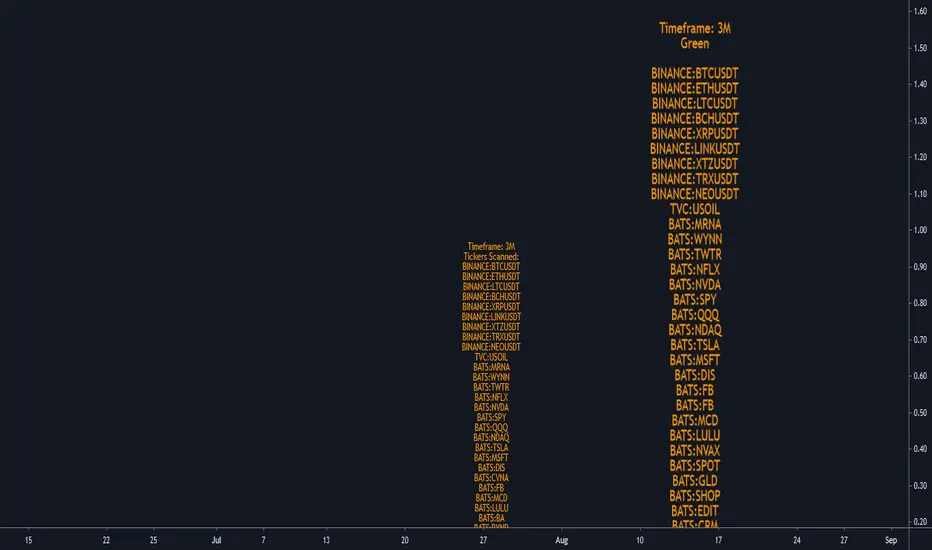
Screener for 40+ instrumentsAs you probably know in TradingView there is a limit of 40 instruments in one custom screener.
I created a script that will allow you to scan more symbols.
The idea of it is pretty simple. You have to add a screener a few times on your screen with a different set of symbols. Then select column width (as % of your chart width) and # of the screener right to left.
Script will plot #1 screener next to the right border. For #2 and all next tables, the script will compute the needed offset and will draw it on the left. This way it will look like one table and not a few separate indicators.
I created a script with an RSI screener, but you can create more complicated examples with it.
Off course, that's not a silver bullet solution but might work for some of you.
Disclaimer
Please remember that past performance may not be indicative of future results.
Due to various factors, including changing market conditions, the strategy may no longer perform as well as in historical backtesting.
This post and the script don’t provide any financial advice.

Screener (MC) [AlgoAlpha]🟠 OVERVIEW
This script is a multi-symbol scanner that works as a companion to the "Momentum Concepts" indicator. It provides a comprehensive dashboard view, allowing traders to monitor the momentum signals of up to 18 different assets in real-time from a single chart. The main purpose is to offer a bird's-eye view of the market, helping you quickly identify assets with strong momentum confluence or potential reversal opportunities without having to switch between different charts.
The screener displays the status of all key components from the Momentum Concepts indicator, including the Fast Oscillator, Scalper's Momentum, Momentum Impulse Oscillator, and Hidden Liquidity Flow, organizing them into a clear and easy-to-read table.
🟠 CONCEPTS
The core of this screener is built upon the analytical framework of the "Momentum Concepts" indicator, which evaluates market momentum across multiple layers: short-term, medium-term, and long-term. This screener applies those complex, proprietary calculations to each symbol in your watchlist and visualizes the current state of each component.
Each column in the table represents a specific aspect of momentum analysis:
Fast Oscillator Columns: These columns reflect the short-term momentum. They show the immediate trend direction, whether the asset is in an overbought or oversold condition, and flag high-probability events like divergences, reversals, or diminishing momentum.
Scalper's Momentum Column: This column gives insight into medium-term momentum. It distinguishes between strong, sustained moves and weakening, corrective moves, which is useful for gauging the health of a trend.
Momentum Impulse Column: This column represents the dominant, long-term trend bias. It helps you understand the underlying market regime (bullish, bearish, or consolidating) to align your trades with the bigger picture.
Hidden Liquidity Flow Column: This column provides a unique view into the market's underlying liquidity dynamics. It signals whether there is net buying or selling pressure and uses special coloring to highlight periods of unusually high liquidity activity, which often precedes volatile price movements.
By combining these perspectives, the screener justifies its utility by enabling traders to make more informed decisions based on multi-layered signal confluence.
🟠 FEATURES
This screener organizes momentum data into several key columns. Here is a breakdown of each column and its possible values:
Asset: Displays the symbol for the asset being analyzed in that row.
Fast Oscillator Trend: Shows the immediate, short-term momentum direction.
▲: Indicates a bullish short-term trend.
▼: Indicates a bearish short-term trend.
–: Indicates a neutral or transitional state.
Fast Oscillator Valuation: Measures whether the asset is in a short-term overbought or oversold state.
OB: Signals an "Overbought" condition, often associated with bullish exhaustion.
OS: Signals an "Oversold" condition, often associated with bearish exhaustion.
Neutral: The asset is trading in a neutral zone, neither overbought nor oversold.
Scalper's Momentum: Assesses the strength and direction of medium-term momentum.
Strong▲: Strong bullish momentum.
Weak▲: Bullish momentum exists but is weakening or corrective.
Strong▼: Strong bearish momentum.
Weak▼: Bearish momentum exists but is weakening or corrective.
–: Neutral or no clear medium-term momentum.
Momentum Impulse: Identifies the dominant, long-term trend bias. A colored background indicates that the momentum is in a strong "impulse" phase.
▲: Indicates a bullish long-term bias.
▼: Indicates a bearish long-term bias.
0: Indicates a neutral or ranging market condition.
Hidden Liquidity Flow: Tracks underlying buying and selling pressure. The background color highlights periods of unusual liquidity activity.
▲: Positive liquidity flow, suggesting net buying pressure.
▼: Negative liquidity flow, suggesting net selling pressure.
–: Neutral liquidity flow.
Dim. Momentum: Provides an early warning that short-term momentum is beginning to fade.
● (Bullish Color): Bullish momentum is weakening.
● (Bearish Color): Bearish momentum is weakening.
–: No diminishing momentum detected.
Divergence: Flags classic or hidden divergences between price and the Fast Oscillator.
Div▲: A bullish divergence has been detected.
Div▼: A bearish divergence has been detected.
–: No active divergence signal.
Reversal: Signals a potential reversal when the Fast Oscillator crosses its trend line from an overbought or oversold zone.
Rev▲: A bullish reversal signal has occurred.
Rev▼: A bearish reversal signal has occurred.
–: No active reversal signal.
🟠 USAGE
The primary function of this screener is to quickly identify trading opportunities and filter setups based on momentum confluence across your watchlist.
1. Setup and Configuration:
Add the indicator to your chart.
Go into the script settings and populate the "Watchlist" group with the symbols you wish to monitor.
Adjust the settings for the various momentum components (Fast Oscillator, Scalper's Momentum, etc.) to align with your trading strategy. These settings will be universally applied to all symbols in the screener.
2. Interpreting the Columns for Trading Decisions:
Momentum Impulse & Hidden Liquidity Flow: Use these columns to establish a directional bias. A bullish "▲" in both columns on an asset suggests a strong underlying uptrend with supportive buying pressure, making it a good candidate for long positions.
Scalper's Momentum: Use this for entry timing and trend health. A "Strong▲" reading can confirm the strength of an uptrend, while a shift to "Weak▲" might suggest it's time to tighten stops or look for an exit.
Fast Oscillator Trend & Valuation: These are best for precise entry triggers. For a "buy the dip" strategy in an uptrend, you could wait for the Fast Oscillator to show "OS" (Oversold) and then enter when the "Trend" column flips back to "▲".
Dim. Momentum: This is an excellent take-profit signal. If you are in a long position and a bullish-colored "●" appears, it's a warning that the upward move is losing steam, and you might consider closing your trade.
Divergence & Reversal: These columns are for identifying potential turning points. A "Div▲" or "Rev▲" signal is a strong alert that a downtrend might be ending, making the asset a prime candidate to watch for a long entry.
3. Finding High-Probability Setups:
Trend Confluence: Look for assets where multiple components show alignment. For example, an ideal long setup might show a bullish "Momentum Impulse" (▲), a "Strong▲" reading in "Scalper's Momentum," and a bullish trend in the "Fast Oscillator." This indicates that the long-term, medium-term, and short-term momentums are all in agreement.
Reversal and Exhaustion: Use the "Divergence" and "Reversal" columns to spot potential turning points. A "Div▲" signal appearing in an asset that is in an oversold "Fast Oscillator Valuation" zone can be a strong indication of an upcoming bounce.
Skrip berbayar

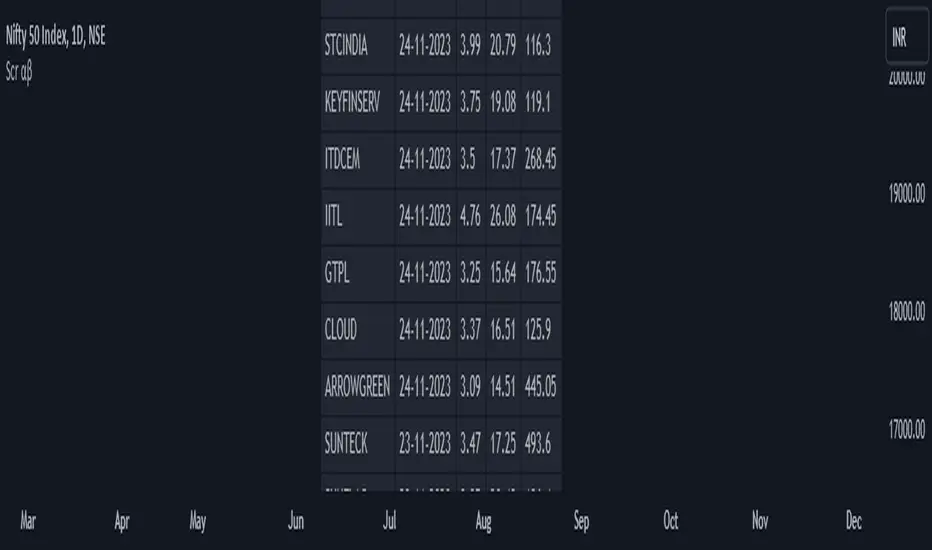
Screener: Alpha & BetaThis is a Live Screener for my previous Alpha & Beta indicator, which filters stocks lively based on the given values.
Use 5min timeframe for Live Intraday.
The default stocks in the screener is selected based on high beta value from F&O listed stocks. It may include other stocks also.
User can input stocks of your choice either through the menu or through the Pine editor.
The maximum number of stocks inputs is only 40. The indicator includes only 20 stocks by default.
More number of stocks can be added but it makes the screener slower to load.
Open the indicator in a sperate tab or window to avoided the loading lag.
It is recommended to choose only 10 to 20 stocks based on the weightage from each sectors.
Beta values are dynamic. It changes from day to day based on the trend and sector.
Update the sock list weekly or twice a week or monthly.
Use investing.com screener(preferably) or TradingView screener for shortlisting beta stocks.
Remember that majority of indicators fails in a sideways market, also every indicator is not 100% accurate.
MOST + Moving Average ScreenerScreener version of Anıl Özekşi's Moving Stop Loss (MOST) Indicator:
USERS MAY SCREEN MOST WITH 11 DIFFERENT TYPES OF MOVING AVERAGES + THEY CAN ALSO SCREEN SIGNALS WITH THAT 11 MOVING AVERAGES INSTEAD OF USING MOST LINE.
Adjustable Moving Average Types:
SMA : Simple Moving Average
EMA : Exponential Moving Average
WMA : Weighted Moving Average
DEMA : Double Exponential Moving Average
TMA : Triangular Moving Average
VAR : Variable Index Dynamic Moving Average aka VIDYA
WWMA : Welles Wilder's Moving Average
ZLEMA : Zero Lag Exponential Moving Average
TSF : True Strength Force
HULL : Hull Moving Average
TILL : Tillson T3 Moving Average
About Screener Panel:
Users can explore 20 different and user-defined tickers, which can be changed from the SETTINGS (shares, crypto, commodities...) on this screener version.
The screener panel shows up right after the bars on the right side of the chart.
-In this screener version of MOST, users can define the number of demanded tickers (symbols) from 1 to 20 by checking the relevant boxes on the settings tab.
-All selected tickers can be screened in different timeframes.
-Also, different timeframes of the same Ticker can be screened.
IMPORTANT NOTICE:
Screener shows the results in 3 different logic:
1st LOGIC (Default Settings):
BUY AND SELL SIGNALS of MOST and MOVING AVERAGE LINE
Most Buy Signal: Moving Average Crosses ABOVE the MOST LINE
Most Sel Signal: Moving Average Crosses BELOW the MOST LINE
Tickers seen in green are the ones that are in an uptrend, according to MOST.
The ones that appear in red are those in the SELL signal, in a downtrend.
The numbers before each Ticker indicate how many bars passed after MOST's last BUY or SELL signal.
For example, according to the indicator, when BTCUSDT appears (3) in GREEN, Bitcoin switched to a BUY signal 3 bars ago.
2nd LOGIC (Moving Average & Price Flips Screener Mode):
This mode can only be activated by checking the 'Activate Moving Average Screening Mode' box on the settings menu.
MOST line will be disappeared after checking the box.
Buy Signal: When the Selected Price crosses ABOVE the selected Moving Average.
Sell Signal: When the Selected Price crosses BELOW the selected Moving Average.
Tickers seen in green are the ones that are in an uptrend, according to Moving Average & Price Flips.
The ones that appear in red are those in the SELL signal, in a downtrend.
The numbers before each Ticker indicate how many bars passed after the last BUY or SELL signal of Moving Average & Price Flips.
For example, according to the indicator, when BTCUSDT appears (3) in GREEN, Bitcoin switched to a BUY signal 3 bars ago.
3rd LOGIC (Moving Average Color Change Screener Mode):
Both 'Activate Moving Average Screening Mode' and 'Activate Moving Average Color Change Screening Mode' boxes must be checked in the settings tab.
Moving Average Line will turn out into two colors.
Green color means the moving average value is greater than the previous bar's value.
Red color means the moving average value is smaller than the previous bar's value.
Buy Signal: After the Selected Moving Average turns GREEN from red.
Sell Signal: After the Selected Moving Average turns RED from green.
-Screener shows the information about the color changes of the selected Moving Average with default settings.
If this option is preferred, users are advised to enlarge the length to have better signals.
Tickers seen in green are the ones that are in an uptrend, according to Moving Average Color.
The ones that appear in red are those in the SELL signal, in a downtrend.
The numbers before each Ticker indicate how many bars passed after the last BUY or SELL signal of Moving Average Color Change.
For example, according to the indicator, when BTCUSDT appears (3) in GREEN, Bitcoin switched to a BUY signal 3 bars ago.

Screener - Mean Reversion Channel█ OVERVIEW
This is Screener script for Mean Reversion Channel Indicator
█ Description & How To Use
The screener works by scanning through up to 40 symbols and list down symbols that are currently within Overbought/Oversold Zone as defined by Mean Reversion Channel indicator.
The Overbought/Oversold Zone are further categorized and sorted by:
Strong : Indicated by "(Strong)" next to the symbol name
Normal : Indicated by the absence of "(Strong)" or "(Weak)" next to the symbol name
Weak : Indicated by "(Weak)" next to the symbol name
Notes: Refer to chart above to see how the Zone are categorized.
Notes: If the screener displays "Nothing Interesting". It simply means none of the screened assets are within the Overbought/Oversold Zone.
█ Features
- Scan up to 40 symbols at a time (By default, no asset is define. Once configured all the symbols you required, remember to save as default to save you from pain of configuring it again in the future)
- Options to scan by zones
- Custom Timeframe
█ Limitation
Due to multiple use of security() function required to call other symbols, expect the screener to be slow at certain times
█ Disclaimer
Past performance is not an indicator of future results.
My opinions and research are my own and do not constitute financial advice in any way whatsoever.
Nothing published by me constitutes an investment recommendation, nor should any data or Content published by me be relied upon for any investment/trading activities.
I strongly recommends that you perform your own independent research and/or speak with a qualified investment professional before making any financial decisions.
Any ideas to further improve this indicator are welcome :)
Credit: QuantNomad for his script idea on custom screener

Screener Price Percentage ChangeA screener that displays price percentage change in actual chart timeframe and the default Daily, Weekly and Monthly.
The actual time frame also displays last value percentage change.
For example, if actual timeframe is "Monthly, it is going to display also the last "previous Monthly percentage price change.
Can select 3 more assets to display.
Full control of Panel position and size.
A modified version of @Mohamed3nan
Para el Shiaks

Screener Red?Based on the teachings of Rob Smith
Ability to change the timeframe and the symbols this indicator is scanning through in the input tab under settings of this indicator. Maximum symbols 40. All of the symbols need to entered. If any symbol field is left empty, the script might not work properly.
This is a simple screener which checks if the current candle is red/going down.
I add it 4 times and change the timeframes on each one to tell me if any of the symbols scanning through have FTFC(Full time frame continuity). If a symbol appears in all of the timeframes selected, it would have continuity in all of those timeframes. Meaning going down in all of those selected timeframes.
I like to add a textbox on top of the labels manually when I change the timeframe to tell me which timeframe the indicator is scanning through.
Always double check in the settings of the indicator that the correct timeframe is selected.
First label is for all of the symbols the indicator is scanning.
Second label is the result of the scan. Text is bigger in this label than the first label to differentiate from the first label and for ease of use.
Please DM me on how to access this indicator.
Screener Green?Based on the teachings of Rob Smith
Ability to change the timeframe and the symbols this indicator is scanning through in the input tab under settings of this indicator. Maximum symbols 40. All of the symbols need to entered. If any symbol field is left empty, the script might not work properly.
This is a simple screener which checks if the current candle is green/going up.
I add it 4 times and change the timeframes on each one to tell me if any of the symbols scanning through have FTFC(Full time frame continuity). If a symbol appears in all of the timeframes selected, it would have continuity in all those timeframe. Meaning going up in all of those timeframes.
I like to add a textbox manually on top of the labels when I change the timeframe to tell me which timeframe the indicator is scanning through.
Always double check in the settings of the indicator that the correct timeframe is selected.
First label is for all of the symbols the indicator is scanning.
Second label is the result of the scan. Text is bigger in this label than the first label to differentiate from the first label and for ease of use.
Please DM me on how to access this indicator.
RunRox - Pairs Screener📊 Pairs Screener is part of our premium suite for pair trading.
This indicator is designed to scan and rank the most profitable and optimal pairs for the Pairs Strategy. The screener can backtest multiple metrics on deep historical data and display results for many pairs against one base asset at the same time.
This allows you to quickly detect market inefficiencies and select the most promising pairs for live trading.
HOW DOES THIS STRATEGY WORK⁉️
The core idea of the strategy is described in detail in our main indicator Pairs Strategy from the same product line.
There you can find a full explanation of the concept, the math behind pair trading, and the internal logic of the engine.
The Pairs Screener is built on top of the same core technology as the main indicator and uses the same internal logic and calculations.
It is designed as a key companion tool to the main strategy: it helps you find tradeable pairs, evaluate current deviations, sort and filter lists of candidates, and much more. All of these features will be described in this post.
✅ KEY FEATURES
More than 400+ assets available for scanning
Forex assets
Crypto assets
Lower Timeframe Backtester Strategy support
Invert signals mode
Hedge Coefficient (position size balancing between both legs)
6 hedge modes
Stop Loss support
Take Profit support
Whitelist with your own custom asset list
Blacklist to exclude unwanted assets
Custom filters
12 tracking metrics for pair evaluation
Customizable alerts
And many other tools for fine-tuning your search
The screener runs backtests simultaneously across a large number of assets and calculates metrics automatically.
This helps you very quickly find pairs with strong structural relationships or current inefficiencies that can be used as the basis for your pair trading strategies.
⚙️ MAIN SETTINGS
The first section controls the core parameters of the screener: Score, correlation, asset groups for scanning, and other base settings. All major crypto and forex symbols are embedded directly into the screener.
Since there are more than 400 assets, it is technically impossible to analyze everything at once, so we grouped them into batches of 40 assets per group.
The workflow is simple:
Open the chart of the asset you want to use as the base ticker.
In the screener settings choose the market (Crypto or Forex).
Select a Group (for example, Group 1) and the indicator will scan all assets inside that group against your base ticker.
Then you switch to Group 2, Group 3, etc., and repeat the scan.
Embedded universe:
400+ assets total
350+ Crypto – split into 10 groups
70+ Forex – split into 3 groups
Below is a description of each setting.
🔸 Exclude Dates
Allows you to specify a period that should be excluded from analysis.
Useful for removing abnormal spikes, news events, or any non-typical segments that distort the statistics for your pairs.
🔸 Market
Defines which universe will be used to build pairs with the current main asset:
Crypto – 350+ crypto symbols
Forex – 70+ FX symbols
Whitelist – your own custom list of assets
🔸 Group
Selects the asset group to scan.
As mentioned above, assets are split into groups of about 40 instruments:
350+ Crypto → 10 groups
70+ Forex → 3 groups
The screener will calculate all metrics only for the group you select.
🔸 Lower Timeframe
This option enables deep history analysis.
Each TradingView plan has a limit on the number of visible bars (for example, 5,000 bars on the basic plan). In standard mode you would only get statistics for the last 5,000 bars of your current timeframe.
If you want a deeper backtest on a lower timeframe, you can do the following:
Suppose your target timeframe for analysis is 5 minutes.
Switch your chart to a 30-minute timeframe.
Enable Lower Timeframe in the indicator.
Select 5 minutes as the lower timeframe inside the screener.
In this mode the screener can reconstruct and analyze up to 99,000 bars of data for your assets. This allows you to evaluate pairs on a much deeper history and see whether the results are stable over a larger sample.
🔸 Method
Here you choose the deviation model:
preferred Z-Score or S-Score for your analysis,
plus you can enable Invert to search for negatively correlated pairs and calculate their profit correctly.
🔸 Period
This is the lookback period for Z/S Score.
It defines how many bars are used to calculate the deviation metric for each pair.
🔸 Correlation Period
This is the number of bars used to calculate correlation between the base asset and each candidate in the group.
The resulting correlation value is also displayed in the results table.
🔀 HEDGE COEFFICIENT
The next block of settings is related to the hedge coefficient.
This defines how much margin is allocated to each leg of the pair.
The classic approach in pair trading is to split the position equally between both assets.
For example, if you allocate 100 USD to a trade , the standard model would open 50 USD long on one asset and 50 USD short on the other.
This works well for pairs with similar volatility , such as BTCUSDT / ETHUSDT
However, if you use a pair like BTCUSDT / DOGEUSDT , the volatility of these assets is very different.
They can still be correlated, but their amplitude is not the same. While Bitcoin might move 2% , Dogecoin can move 10% over the same period.
Because of that, for pairs with strongly different volatility, we can use a hedge coefficient and, for example, enter with 30 USD on one leg and 70 USD on the other, taking the volatility difference into account.
This is the main idea behind the Hedge Coefficient section and its primary use.
The indicator includes 6 methods of calculating the coefficient:
Cumulative RMA
Beta OLS
Beta TLS
Beta EMA
RMA Range
RMA Delta
Each method uses a different formula to compute the hedge coefficient and to size the position based on different metrics of the assets.
We leave it to the trader to decide which algorithm works best for their specific pair and style.
Below are the settings inside this section:
🔹 Method
When Auto Hedge is enabled, you can select which method to use from the list above.
The chosen method will automatically calculate the hedge coefficient between the two legs.
🔹 Hedge Coefficient
This is the manual hedge ratio per trade when Auto Hedge is disabled.
By default it is set to 1, which means the position is opened 50/50 between the two assets.
🔹 Min Allowed Hedge Coef.
This is the minimum allowed hedge coefficient.
By default it is 0.2, which means the model will not go below a 20% / 80% split between the legs.
🔹 MA Length
For methods that use moving averages (for example Beta EMA), this parameter sets the period used to calculate the hedge coefficient.
💰 STRATEGY SETTINGS
This section defines the base backtesting settings for all assets in the screener.
Here you configure entries, exits, Stop Loss, and other parameters used to find the most optimal pairs for your strategy. 🔸 Commission %
In this field you set your broker’s fee percentage per trade.
The indicator automatically calculates the correct commission for each leg of every trade. You only need to input the real commission rate that your broker charges for volume. No additional manual calculations are required.
🔸 Qty $
The margin amount used for backtesting across all assets in the screener.
This margin is split between both legs of the pair either equally or according to the selected hedge coefficient.
🔸 Entry
The Z/S Score deviation level at which the backtest opens a trade for each pair.
🔸 Exit
The Z/S Score level at which the backtest closes trades for the tested assets.
🔸 Stop Loss
PnL threshold at which a trade is force-closed during the historical test.
🔸 Cooldown
Number of bars the strategy will wait after a Stop Loss before opening the next trade.
This block gives you flexible control over how your strategy is tested on 400+ assets, helping you standardize the rules and compare pairs under the exact same conditions.
🗒️ WHITELIST
In this section you can define your own custom list of assets for monitoring and backtesting.
This is useful if you want to work with symbols that are not included in the built-in lists, such as exotic crypto from smaller exchanges, specific stocks, or any custom universe 🔹 Exchange Prefix
Enter the exchange prefix used for your tickers.
Example: BINANCE, OANDA, etc.
🔹 Ticker Postfix
Enable this option if the tickers require a postfix.
Example 1: .P for Binance Futures perpetual contracts.
Example 2: USDT if you only provide the base asset in the ticker list.
🔹 Ticker List
Enter a comma-separated list of tickers to analyze.
Example 1: BTCUSDT, ETHUSDT, BNBUSDT (when the exchange prefix is set).
Example 2: BTC, ETH, BNB (when using postfix USDT).
Example 3: BINANCE:BTCUSDT.P, OANDA:EURUSD (when different exchanges are used and the prefix option is disabled).
This gives you full flexibility to build a screener universe that matches exactly the assets you trade.
⛔ BLACKLIST
In this section you can enable a blacklist of unwanted assets that should be skipped during analysis. Enter a comma-separated list of tickers to exclude from the screener:
Example 1: BTCUSDT, ETHUSDT
Example 2: BTC, ETH (all tickers that contain these symbols will be excluded)
This helps you quickly remove illiquid, noisy, or unwanted instruments from the results without changing your main groups or whitelist.
📈 DASHBOARD
This section controls the results dashboard: table position, style, and sorting logic.
Here is what you can configure:
Result Table – position of the results table on the chart.
Background / Text – colors and opacity for the table background and text.
Table Size – overall size of the results table (from 0 to 30).
Show Results – how many rows (pairs) to display in the table.
Sort by (stat) – which metric to use for sorting the results.
Available options: Profit Factor, Profit, Winrate, Correlation, Score.
This lets you quickly focus on the most interesting pairs according to the exact metric that matters most for your strategy.
📎 FILTER SETTINGS
This section lets you filter the results table by metric values.
For example, you can show only pairs with a minimum correlation of 0.8 to focus on more stable relationships. 🔸 Min Correlation
Minimum allowed correlation between the two assets over the selected lookback period.
🔸 Min Score
Minimum absolute Score (Z-Score or S-Score) required to include a pair in the results.
For example, 2.0 means only pairs with Score >= 2.0 or <= -2.0 will be displayed.
🔸 Min Winrate
Minimum win rate percentage for a pair to be included in the table.
🔸 Min Profit Factor
Minimum profit factor required for a pair to stay in the results. These filters help you quickly narrow the list down to pairs that meet your quality criteria and match your risk profile.
📌 COLUMN SELECTION
This section lets you fully customize which metrics are displayed in the results table.
You can enable or hide any column to focus only on the data you need to identify the best pairs for trading. The screener allows you to show up to 12 metrics at the same time, which gives a detailed view of pair quality. Available columns:
🔹 Exchange Prefix
Show the exchange prefix in the ticker.
🔹 Correlation
Correlation between the two assets’ prices over the lookback period.
🔹 Score
Current Score value (Z-Score or S-Score).
On lower timeframe research, Score is not displayed.
🔹 Spread
Shows spread as % change since entry.
Positive value = profit on the main position.
🔹 Unrealized PnL
Shows unrealized PnL as a $ value based on current prices.
🔹 Profit
Total profit from all trades: Gross Profit − Gross Loss.
🔹 Winrate
Percentage of profitable trades out of all executed trades.
🔹 Profit Factor
Gross Profit / Gross Loss.
🔹 Trades
Total number of trades.
🔹 Max Drawdown
Maximum observed loss from peak to trough before a new peak is made.
🔹 Max Loss
Largest loss recorded on a single trade.
🔹 Long/Short Profit
Separate profit/loss for long trades and short trades.
🔹 Avg. Trade Time
Average duration of trades.
All these metrics are designed to help you quickly identify the strongest pairs for your strategy.
You can change colors, opacity, and hide any columns that are not relevant to your workflow.
🔔 ALERT
The alert system in this screener works in a specific way.
Alerts are tied directly to the filters you set in the Filter Settings section:
Minimum Correlation
Minimum Score
Minimum Winrate
Minimum Profit Factor
You can configure alerts to trigger when a new pair appears that matches all your filter conditions. 💡 Example
You set:
Minimum Score = 3
Then you create an alert based on the screener.
When any pair reaches a Score greater than +3 or less than −3, you will receive a notification.
This is how alerts work in this screener.
The idea is to deliver the most relevant information about the current market situation without forcing you to watch the screener all the time.
Supported placeholders for alert messages: {{ticker_1}} – main ticker (the one on the chart).
{{ticker_2}} – the paired ticker listed in the table.
{{corr}} – correlation value.
{{score}} – Score value (Z-Score or S-Score).
{{time}} – bar open time (UTC).
{{timenow}} – alert trigger time (UTC). You can use these placeholders to build alert text or JSON payloads in any format required by your tools.
The screener is designed to significantly enhance your pair trading workflow: it helps you quickly identify working pairs and current market inefficiencies, and with the alert system you can react to opportunities without constantly sitting in front of the screen.
Always remember that past performance does not guarantee future results.
Use the screener data within a risk-controlled trading system and adjust position sizing according to your own risk management rules.

Multiple Screeners with AlertsI already published few version of my custom screeners. Unfortunately, because of TradingView's security function call limit you can't use more than 40 stocks in 1 screener.
Fortunately, you can compute multiple values in your function and screen few indicators at once.
In this script I show how you can compute 5 indicators at the same time for 40 instruments. I display then in different labels.
Every label consist of list of instruments satisfying current indicator conditions and a value for it. It can be absolute value as for RSI or -1/1 representing Bullish/Bearish event.
Also you can create 1 alert with result of all screeners inside.
In this example I took 5 indicators with following conditions:
RSI - "RSI < 30" or "RSI > 70"
TSI - "TSI < -30" or "RSI >30"
ADX - "ADX > 40"
MACD - "MACD Bullish Cross" or "MACD Bearish Cross" (1 and -1 in screener)
AO - "AO Crosses 0 UP" or "AO Crosses 0 DOWN" (1 and -1 in screener)
Params
- bars_apart - this parameter define how may bars apart you labels are on your chart. If you see labels overlapping, increase this number.
- Parameters for all used indicators
- 40 symbol inputs for instruments you want to use in this screener
Alerts
You can create an alert from it easily by selecting screener name from the list and then selecting "Any alert() function call".
No additional configuration is required, message and alert on close is generated in the code.
You should better change default name for your alert. Sometimes because of big amount of inputs you might receive an error.
Disclaimer
Please remember that past performance may not be indicative of future results.
Due to various factors, including changing market conditions, the strategy may no longer perform as good as in historical backtesting.
This post and the script don’t provide any financial advice.

Psych Level ScreenerThis Script is intended for Pine Screener and is not designed as a indicator!!!
Pine Screener is something TradingView has recently added and is still only a Beta version.
Pine Screener itself is currently only available to members that are Premium and above.
What it does:
This screener will actively look for tickers that are close to Pysch level in your watchlist.
Psych level here refers to price levels that are round numbers such as 50,100,1000.
Users can specify the offset from a psych level (in %) and scanner will scan for tickers that are within the offset. For example if offset is set at 5% then it will scan for tickers that are within +/-5% of a ticker. (for $100 psych level it will scan for ticker in $95-105 range)
Once scan is completed you will be able to see:
- Current price of ticker
- Closest psych level for that ticker
- % and $ move required for it to hit that psych level
- Ticker's day range and Average range (with % of average range completed for the day)
- Ticker volume and average volume
Setting up:
www.tradingview.com
Above link will help you guide how to setup Pine screener.
Use steps below to guide you the setup for this specific screener:
1. Open Pine Screener (open new tab, select screener the "Pine")
2. At the top, click on "Choose Indicator" and select "Psych Level Screener"
3. At the top again, click "Indicator Psych Level Screener" and select settings.
4. Change setting to your needs. Hit Apply when done.
a)"% offset from Psych Level" will scan for any stocks in your watchlist which are +/- from the offset you chose for any given psych level. Default is 5. (e.g. If offset is 5%, it will scan for stocks that are between $95-$105 vs $100 psych level, $190-$210 for $200 psych level and so on)
b) ATR length is number of previous trading days you want to include in your calculation. Moving Average Type is calculation method.
c) Rvol length is number of previous trading days you want to include in your calculation.
5. On top left, click "Price within specified offset of Psych. Level" and select true. Then select "Scan" which is located at the top next to "Indicator Psych Level Screener". This will filter out all the stock that meets the condition.
6. At the end of the column on the right there is a "+" symbol. From there you can add/remove columns. 30min/1hr/4hr/1D Trend are disabled by default so if this is needed please enable them.
7. You can change the order of ticker by ascending and descending order of each column label if needed. Just click on the arrow that comes up when you move the cursor to any of the column items.
8. You can specify advanced filter settings based on the variables in the column. (e.g., set price range of stock to filter out further) To do so, click on the column variable name in interest, located above the screener table (or right below "scan") and select "manual setup".
How to read the column:
Current Price: Shows current price of the ticker when scan was done. Currently Pine Screener does NOT support pre/post-hours data so no PM and AH price.
Psych Level: Psych level the current price is near to.
% to Psych Level: Price movement in % necessary to get to the Psych level.
$ to Psych Level: Price movement in $ necessary to get to the Psych level.
DTR: Daily True Range of the stock. i.e. High - Low of the ticker on the day.
ATR: Average True Range of stock in the last x days, where x is a value selected in the setting. (See step 3 in Previous section)
DTR vs ATR: Amount of DTR a ticker has done in % with respect to ATR. (e.g., 90% means DTR is 90% of ATR)
Vol.: Volume of a ticker for the day. Currently Pine Screener does NOT support pre/post-hours data so no PM and AH volume.
Avg. Vol: Average volume of a ticker in the last x days, where x is a value selected in the setting. (See step 3 in Previous section)
Rvol: Relative volume in percentage, measured by the ratio of day's volume and average volume.
30min/1hr/4hr/1D Trend: Trend status to see if the chart is Bullish or Bearish on each of the time frame. Bullishness or Bearishness is defined by the price being over or under the 34/50 cloud on each of the time frame. Output of 1 is Bullish, -1 is Bearish. 0 means price is sitting inside the 34/50 cloud. Currently Pine Screener does NOT support pre/post-hours data so 34/50 cloud is based on regular trading hours data ONLY.
Some things user should be aware of:
- Pine Screener itself is currently only available to TradingView members with Premium Subscription and above. (I can't to anything about this as this is NOT set by me, I have no control) For more info: www.tradingview.com
- The Pine Screener itself is a Beta version and this screener can stop working anytime depending on changes made by TradingView themselves. (Again I cannot control this)
- Pine Screener can only run on Watchlists for now. (as of 03/31/2025) You will have to prepare your own watchlists. In a Watchlist no more than 1000 tickers may be added. (This is TradingView rules)
- Psych level included are currently 50 to 1500 in steps of 50. If you need a specific number please let me know. Will add accordingly.
- Unfortunately this screener does not update automatically, so please hit "scan" to get latest screener result.
- I cannot add 10min trend to the column as Pine Screener does NOT support 10min timeframe as of now. (03/31/2025)
- This code is only meant for Pine Screener. I do NOT recommend using this as an indicator.
- Currently Pine Screener does NOT support pre/post-hours data. So data such as Price, Volume and EMA values are based on market hours data ONLY! (If I'm wrong about this please correct me / let me know and will make look into and make changes to the code)
Other useful links about Pine Screener:
Quick overview of the Screener’s functionality: www.tradingview.com
what do you need to know before you start working? : www.tradingview.com
These links will go over the setting up with GIFs so is easier to understand.
-----------------------------------------------------------------------------------------------------------------
If there are other column variables that you think is worth adding please let me know! Will try add it to the screener!
If you have any questions let me know as well, will reply soon as I can!
Have a good trading day and hope it helps!

Your CRYPTO Screener - MACD 0 LAG editionHello traders
What's good?
1 - Quick introduction
This script is to demonstrate a proof-of-concept - showing you again what you thought wasn't possible might become (with some tricks) in the realm of possibles !!!.
I get requests for people who want a custom screener because the native TradingView Stocks/Forex/Crypto screeners don't allow to plug external indicators. (example: www.tradingview.com
This is entirely true and I have also good news for you, we can hack the system one more time. As Hackerman would say, "IT"S HACKING TIME !!!" (ref : KUNG FURY . (#geek #reference #done #for #today)
What if you could build your own personalized screener based on your custom indicator? "No Dave stop smoking, that's not possible, go back to eating your baguette". Say no more, let me present you my new script called YOUR CRYPTO Screener (MACD 0 LAG)
2 - What is a MACD ZERO LAG?
We'll all agree this indicator is NOT in the TradingView screeners so I'm not cheating here :)
A MACD ZERO LAG is a MACD that .... suspens.... wait for it.... DOES NOT lag.
The traditional MACD is based on exponential moving averages and as moving averages are lagging, then the MACD is lagging also. I'll spare you all the maths behind the MACD ZERO LAG but in short, this is a way more reactive indicator than the traditional MACD
I shared before the version that I personally use for my own trading : MACD 0 LAG nTREND coloring
3 - Crypto Screener specifications
If I could do a screener as complete as the native one, this would be wonderful but ... we cannot and this is due to technical reasons. To call indicators from different timeframes, I have to use the security function. And we're limited to 40 security calls per indicator.
That explains why I selected 4 crypto assets and 5 timeframes and the MACD zero lag output for each asset/timeframe - which gives a total of 4 * 5 * 2 = 40
You'll be able to select from the interface the 5 timeframes that you want for your screener
In this script, you'll get a :
- BUY whenever the MACD ZERO LAG for your asset/timeframe is green.
- SELL whenever the MACD ZERO LAG for your asset/timeframe is red.
4 - Can you hack it even more?
If you want to add other timeframes or assets, you can either, change the code or add the indicator on another chart.
I made the source code generic enough so that you can update it yourself easily
Example:
Chart 1 will list BTCUSD, ETHUSD, LTCUSD, and XRPUSD in m5/m15/m30/H1/H4 and Chart2 could list BTCUSD, ETHUSD, LTCUSD and XRPUSD in H6/H8/H12/Daily, etc...
Once again the sky (and your computer RAM capacity) is the limit
5 - Can you super hack it even more?
1/ This script is only a proof-of-concept that you can build your own custom screener. Imagine having the Algorithm Builder and being able to connect it in a single click to a custom screener using your own configuration :)
How coooooooooooooooool would that be!!!
This screener version will be available on my website in a few weeks along with all the tools I'm spamming you about since the beginning of July (#shameless #self-advertising)
2/ For a nicer scripter, let's keep in mind that TradingView just enabled Webhooks this week. This will allow my company to offer custom screeners design and hosted on your own website. Those screeners will be for sure nicer than the indicator version
That's it for today and for this week
I won't even touch the laptop this weekend and will enjoy life a bit
Love you all
Dave
____________________________________________________________
Be sure to hit the thumbs up. Building those indicators take a lot of time and likes are always rewarding for me :) (tips are accepted too)
- If you want to suggest some indicators that I can develop and share with the community, please use my personal TRELLO board
- I'm an officially approved PineEditor/LUA/MT4 approved mentor on codementor. You can request a coaching with me if you want and I'll teach you how to build kick-ass indicators and strategies
Jump on a 1 to 1 coaching with me
- You can also hire for a custom dev of your indicator/strategy/bot/chrome extension/python
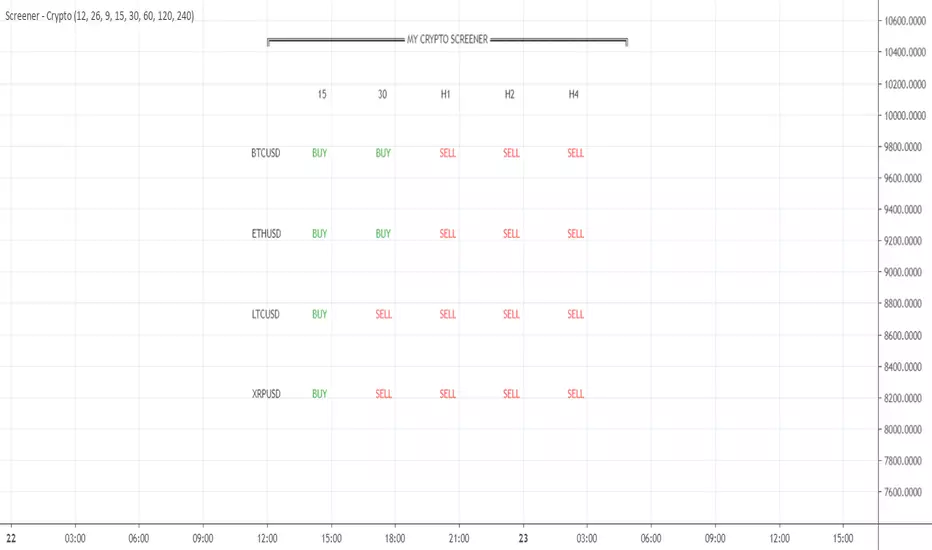
BEST Ultimate Engulfing ScreenerHello traders
Continuing deeper and stronger with the screeners serie. I keep getting requests private messages and requests saying that screeners aren't possible with TradingView.
My answer is always... "Reallyyy ??" (I never find a better answer than that...)
I'll publish a few screeners just for everyone to understand what can be done with Pinescript. We don't have to wait for TradingView to allow screener based on custom indicator - we can build our own ^^
I - What is an engulfing pattern
Let's start with a screener to check for a very famous candlestick pattern called engulfing
Engulfing candles tend to signal a reversal of the current trend in the market. This specific pattern involves two candles with the latter candle ‘engulfing’ the entire body of the candle before it.
The engulfing candle can be bullish or bearish depending on where it forms in relation to the existing trend
Source and more info here
These engulfing candles indicate a strong shift in direction, and when combined with observation of the price-trending direction that precedes it, this shift creates the opportunity for a trading strategy.
II - How did I set the screener
I added an optional filter being Price vs SMA. The idea is to select only the engulfing whenever the price also breaks an SMA - this usually translates a stronger move - but could sometimes give the signal too late (#meh #trading #ain't #easy)
The visual signals are as follow:
- square: whenever the engine detects an engulfing and an SMA breakout
- triangle: the engine only detects an engulfing
- dash: none of the above
Then the colors are:
- orange when bullish
- yellow when bearish
- aqua/dash when none of the above
Cool Hacks
"But sir... what can we do with only 5 instruments for a screener?" I agree not much but...
even if I allow only 5 instruments per indicator - nothing prevents you from adding multiple times the same indicator and changing the selected instruments for each. I also show why the SPX500 gave a yellow triangle (bearish engulfing) and how to match it with the screener.
=> imgur.com
Wishing you all the BEST trading
Dave
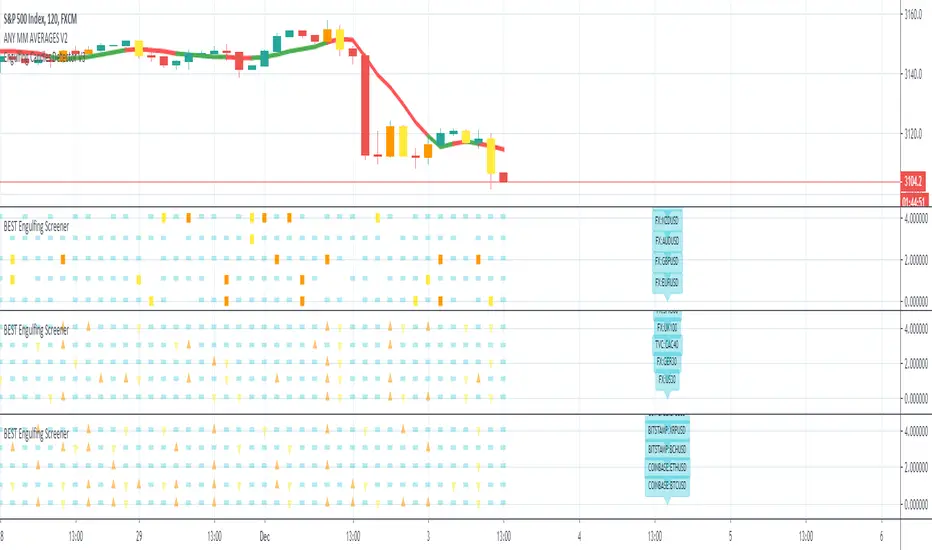
Linear Regression Channel Screener [Daveatt]Hello traders
First and foremost, I want to extend a huge thank you to @LonesomeTheBlue for his exceptional Linear Regression Channel indicator that served as the foundation for this screener.
Original work can be found here:
Overview
This project demonstrates how to transform any open-source indicator into a powerful multi-asset screener.
The principles shown here can be applied to virtually any indicator you find interesting.
How to Transform an Indicator into a Screener
Step 1: Identify the Core Logic
First, identify the main calculations of the indicator.
In our case, it's the Linear Regression
Channel calculation:
get_channel(src, len) =>
mid = math.sum(src, len) / len
slope = ta.linreg(src, len, 0) - ta.linreg(src, len, 1)
intercept = mid - slope * math.floor(len / 2) + (1 - len % 2) / 2 * slope
endy = intercept + slope * (len - 1)
dev = 0.0
for x = 0 to len - 1 by 1
dev := dev + math.pow(src - (slope * (len - x) + intercept), 2)
dev
dev := math.sqrt(dev / len)
Step 2: Use request.security()
Pass the function to request.security() to analyze multiple assets:
= request.security(sym, timeframe.period, get_channel(src, len))
Step 3: Scale to Multiple Assets
PineScript allows up to 40 request.security() calls, letting you monitor up to 40 assets simultaneously.
Features of This Screener
The screener provides real-time trend detection for each monitored asset, giving you instant insights into market movements.
It displays each asset's position relative to its middle regression line, helping you understand price momentum.
The data is presented in a clean, organized table with color-coded trends for easy interpretation.
At its core, the screener performs trend detection based on regression slope calculations, clearly indicating whether an asset is in a bullish or bearish trend.
Each asset's price is tracked relative to its middle regression line, providing additional context about trend strength.
The color-coded visual feedback makes it easy to spot changes at a glance.
Built-in alerts notify you instantly when any asset experiences a trend change, ensuring you never miss important market moves.
Customization Tips
You can easily expand the screener by adding more symbols to the symbols array, adapting it to your watchlist.
The regression parameters can be adjusted to match your preferred trading timeframes and sensitivity.
The alert system is already configured to notify you of trend changes, but you can customize the alert messages and conditions to your needs.
Limitations
While powerful, the screener is bound by PineScript's limitation of 40 security calls, capping the maximum number of monitored assets.
Using AI to Help With Conversion
An interesting tip:
You can use AI tools to help convert single-asset indicators to screeners.
Simply provide the original code and ask for assistance in transforming it into a screener format. While the AI output might need some syntax adjustments, it can handle much of the heavy lifting in the conversion process.
Prompt (example) : " Please make a pinescript version 5 screener out of this indicator below or in attachment to scan 20 instruments "
I prefer Claude AI (Opus model) over ChatGPT for pinescript.
Conclusion
This screener transformation technique opens up endless possibilities for market analysis.
By following these steps, you can convert any indicator into a powerful multi-asset scanner, enhancing your trading toolkit significantly.
Remember: The power of a screener lies not just in monitoring multiple assets, but in applying consistent analysis across your entire watchlist in real-time.
Feel free to fork and modify this screener for your own needs.
Happy trading! 🚀📈
Daveatt

Options Screener [Pro] - IVRank, IVx, Deltas, Exp.move, Skew
𝗢𝗽𝘁𝗶𝗼𝗻 𝘀𝗰𝗿𝗲𝗲𝗻𝗲𝗿 𝗼𝗻 𝗧𝗿𝗮𝗱𝗶𝗻𝗴𝗩𝗶𝗲𝘄 𝘄𝗶𝘁𝗵 𝗿𝗲𝗮𝗹 𝗱𝗮𝘁𝗮, 𝗮𝘃𝗮𝗶𝗹𝗮𝗯𝗹𝗲 𝗳𝗼𝗿 𝗼𝘃𝗲𝗿 𝟭𝟱𝟬+ 𝗹𝗶𝗾𝘂𝗶𝗱 𝗨𝗦 𝗺𝗮𝗿𝗸𝗲𝘁 𝘀𝘆𝗺𝗯𝗼𝗹𝘀!
𝗢𝘂𝗿 𝘀𝗰𝗿𝗲𝗲𝗻𝗲𝗿 𝗽𝗿𝗼𝘃𝗶𝗱𝗲𝘀 𝗲𝘀𝘀𝗲𝗻𝘁𝗶𝗮𝗹 𝗸𝗲𝘆 𝗺𝗲𝘁𝗿𝗶𝗰𝘀 𝘀𝘂𝗰𝗵 𝗮𝘀:
✅ IVRank
✅ IVx
✅ 5-Day IVx Change
✅ Vertical Pricing Skew
✅ Horizontal IVx Skew
✅ Delta Skew
like TastyTrade, TOS, IBKR etc.
Designed to help you assess option market conditions and make well-informed trading decisions, this tool is an essential addition for every serious options trader!
Ticker Information:
This screener is currently implemented for more than 150 liquid US market tickers and we are continuously expanding the list:
SP:SPX AMEX:SPY NASDAQ:QQQ NASDAQ:TLT AMEX:GLD
NYSE:AA NASDAQ:AAL NASDAQ:AAPL NYSE:ABBV NASDAQ:ABNB NASDAQ:AMD NASDAQ:AMZN AMEX:ARKK NASDAQ:AVGO NYSE:AXP NYSE:BA NYSE:BABA NYSE:BAC NASDAQ:BIDU AMEX:BITO NYSE:BMY NYSE:BP NASDAQ:BYND NYSE:C NYSE:CAT NYSE:CCJ NYSE:CCL NASDAQ:COIN NYSE:COP NASDAQ:COST NYSE:CRM NASDAQ:CRWD NASDAQ:CSCO NYSE:CVNA NYSE:CVS NYSE:CVX NYSE:DAL NASDAQ:DBX AMEX:DIA NYSE:DIS NASDAQ:DKNG NASDAQ:EBAY NASDAQ:ETSY NASDAQ:EXPE NYSE:F NYSE:FCX NYSE:FDX AMEX:FXI AMEX:GDX AMEX:GDXJ NYSE:GE NYSE:GM NYSE:GME NYSE:GOLD NASDAQ:GOOG NASDAQ:GOOGL NYSE:GPS NYSE:GS NASDAQ:HOOD NYSE:IBM NASDAQ:IEF NASDAQ:INTC AMEX:IWM NASDAQ:JD NYSE:JNJ NYSE:JPM NYSE:JWN NYSE:KO NYSE:LLY NYSE:LOW NYSE:LVS NYSE:MA NASDAQ:MARA NYSE:MCD NYSE:MET NASDAQ:META NYSE:MGM NYSE:MMM NYSE:MPC NYSE:MRK NASDAQ:MRNA NYSE:MRO NASDAQ:MRVL NYSE:MS NASDAQ:MSFT AMEX:MSOS NYSE:NCLH NASDAQ:NDX NYSE:NET NASDAQ:NFLX NYSE:NIO NYSE:NKE NASDAQ:NVDA NASDAQ:ON NYSE:ORCL NYSE:OXY NASDAQ:PEP NYSE:PFE NYSE:PINS NYSE:PLTR NASDAQ:PTON NASDAQ:PYPL NASDAQ:QCOM NYSE:RBLX NYSE:RCL NASDAQ:RIOT NASDAQ:RIVN NASDAQ:ROKU NASDAQ:SBUX NYSE:SHOP AMEX:SLV NASDAQ:SMCI NASDAQ:SMH NYSE:SNAP NYSE:SQ NYSE:T NYSE:TGT NASDAQ:TQQQ NASDAQ:TSLA NYSE:TSM NASDAQ:TTD NASDAQ:TXN NYSE:U NASDAQ:UAL NYSE:UBER AMEX:UNG NYSE:UPS NASDAQ:UPST AMEX:USO NYSE:V AMEX:VXX NYSE:VZ NASDAQ:WBA NYSE:WFC NYSE:WMT NASDAQ:WYNN NYSE:X AMEX:XHB AMEX:XLE AMEX:XLF AMEX:XLI AMEX:XLK AMEX:XLP AMEX:XLU AMEX:XLV AMEX:XLY NYSE:XOM NYSE:XPEV CBOE:XSP NASDAQ:ZM
How does the screener work and why is it unique?
This Pine Script screener is an expert tool created to provide various option metrics and visualization tools for options market traders. The screener extracts raw options data from an external data provider (ORATS), processes, and refines the delayed data package using pineseed, and sends it to TradingView. The data is calculated using specific formulas or interpolated values, such as delta distances. This method of integrating options data into a screener framework is unique and innovative on TradingView.
The screener aims to offer a comprehensive view of the current state of options for the implemented instruments, including implied volatility index (IVx), IV rank (IVR), options skew, and expected market movements, which are objectively measured as detailed below.
The options metrics displayed may be familiar to options traders from various major brokerage platforms such as TastyTrade, IBKR, TOS, Tradier, TD Ameritrade, Schwab, etc.
🟨 𝗗𝗘𝗧𝗔𝗜𝗟𝗘𝗗 𝗗𝗢𝗖𝗨𝗠𝗘𝗡𝗧𝗔𝗧𝗜𝗢𝗡 🟨
~~~~~~~~~~~~~~~~~~~~~~~~~~~~~~~~~~~~~~~~~~~~~~~~~~
~~~~~~~~~~~~~~~~~~~~~~~~~~~~~~~~~~~~~~~~~~~~~~~~~~
🔶 Auto-Updating Option Metrics
~~~~~~~~~~~~~~~~~~~~~~~~~~~~~~~~~~~~~~~~~~~~~~~~~~
~~~~~~~~~~~~~~~~~~~~~~~~~~~~~~~~~~~~~~~~~~~~~~~~~~
🔹 IVR (IV Rank)
The Implied Volatility Rank (IVR) indicator helps options traders assess the current level of implied volatility (IV) in comparison to the past 52 weeks. IVR is a useful metric to determine whether options are relatively cheap or expensive. This can guide traders on whether to buy or sell options. We calculate IVrank, like TastyTrade does.
IVR Calculation: IV Rank = (current IV - 52 week IV low) / (52 week IV high - 52 week IV low)
IVR Levels and Interpretations:
IVR 0-10 (Green): Very low implied volatility rank. Options might be "cheap," potentially a good time to buy options.
IVR 10-35 (White): Normal implied volatility rank. Options pricing is relatively standard.
IVR 35-50 (Orange): Almost high implied volatility rank.
IVR 50-75 (Red): Definitely high implied volatility rank. Options might be "expensive," potentially a good time to sell options for higher premiums.
IVR above 75 (Highlighted Red): Ultra high implied volatility rank. Indicates very high levels, suggesting a favorable time for selling options.
Extra: If the IVx value is also greater than 30, the background will be dark highlighted, because a high IVR alone doesn’t mean much without high IVx.
🔹IVx (Implied Volatility Index)
The Implied Volatility Index (IVx) displayed in the option chain is calculated similarly to the VIX. The Cboe employs standard and weekly SPX options to measure the expected volatility of the S&P 500. A similar method is utilized to calculate IVx for each option expiration cycle.
For our purposes, we aggregate the IVx values specifically for the 35-70 day monthly expiration cycle . This aggregated value is then presented in the screener and info panel, providing a clear and concise measure of implied volatility over this period.
We will display a warning if the option chain is heavily skewed and valid, symmetric 16 delta options are not found at optimal monthly expirations.
IVx Color coding:
IVx above 30 is displayed in orange.
IVx above 60 is displayed in red
Important Note: The IVx value alone does not provide sufficient context. There are stocks that inherently exhibit high IVx values. Therefore, it is crucial to consider IVx in conjunction with the Implied Volatility Rank (IVR), which measures the IVx relative to its own historical values. This combined view helps in accurately assessing the significance of the IVx in relation to the specific stock's typical volatility behavior.
This indicator offers traders a comprehensive view of implied volatility, assisting them in making informed decisions by highlighting both the absolute and relative volatility measures.
🔹IVx 5 days change %
We are displaying the five-day change of the IV Index (IVx value). The IV Index 5-Day Change column provides quick insight into recent expansions or decreases in implied volatility over the last five trading days.
Traders who expect the value of options to decrease might view a decrease in IVX as a positive signal. Strategies such as Strangle and Ratio Spread can benefit from this decrease.
On the other hand, traders anticipating further increases in IVX will focus on the rising IVX values. Strategies like Calendar Spread or Diagonal Spread can take advantage of increasing implied volatility.
This indicator helps traders quickly assess changes in implied volatility, enabling them to make informed decisions based on their trading strategies and market expectations.
🔹 Vertical Pricing Skew
At TanukiTrade, Vertical Pricing Skew refers to the difference in pricing between put and call options with the same expiration date at the same distance (at expected move). We analyze this skew to understand market sentiment. This is the same formula used by TastyTrade for calculations.
PUT Skew (red): Put options are more expensive than call options, indicating the market expects a downward move (▽). If put options are more expensive by more than 20% at the same expected move distance, we color it lighter red.
CALL Skew (green): Call options are more expensive than put options, indicating the market expects an upward move (△). If call options are priced more than 30% higher at the examined expiration, we color it lighter green.
We focus on options with 35-70 days to expiration (DTE) for optimal analysis. We always evaluate the skew at the expected move using linear interpolation to determine the theoretical pricing of options. If the pricing have more than C50%/P35% we are highlighting the cell.
This approach helps us gauge market expectations accurately, providing insights into potential price movements.
🔹 Horizontal IVx Skew
In options pricing, it is typically expected that the implied volatility (IVx) increases for options with later expiration dates. This means that options further out in time are generally more expensive. At TanukiTrade, we refer to the phenomenon where this expectation is reversed—when the IVx decreases between two consecutive expirations—as Horizontal Skew or IVx Skew.
Horizontal IVx Skew occurs when: Front Month IVx < Back Month IVx
This scenario can create opportunities for traders who prefer diagonal or calendar strategies. Based on our experience, we categorize Horizontal Skew into two types:
Weekly Horizontal Skew: When IVx skew is observed between two consecutive non-monthly expirations , the displayed value is the rounded-up percentage difference. On hover, the approximate location of this skew is also displayed. The precise location can be seen on the Overlay indicator.
Monthly Horizontal Skew: When IVx skew is observed between two consecutive monthly expirations , the displayed value is the rounded-up percentage difference. On hover, the approximate location of this skew is also displayed. The precise location can be seen on the Overlay indicator.
The Monthly Vertical IVx skew is consistently stronger (more liquid) on average symbols than the weekly vertical IVx skew. Weekly Horizontal IVx Skew may not carry relevant information for symbols not included in the 'Weeklies & Volume Masters' preset.
If the options chain follows the normal IVx pattern, no skew value is displayed.
Additionally , if the Implied Volatility Rank (IVR) is low (indicated by green), the Horizontal Skew background turns black, because this environment is good for Calendar+Diagonal.
Additionally , if the % of the skew is greater than 10, the Horizontal Skew font color turns lighter.
🔹 Delta Skew 🌪️ (Twist)
We have a metric that examines which monthly expiration indicates a "Delta Skew Twist" where the 16 delta deviates from the monthly STD. This is important because, under normal circumstances, the 16 delta is positioned between the expected move and the standard deviation (STD1) line. However, if the interpolated 16 delta line exceeds the STD1 line either upwards or downwards, it represents a special case of vertical skew.
Normal case : exp.move < delta16 < std1
Delta Skew Twist: exp.move < std1 < delta16
If the Days to Expiration of the twist is less than 75, we use a lighter color.
~~~~~~~~~~~~~~~~~~~~~~~~~~~~~~~~~~~~~~~~~~~~~~~~~~
~~~~~~~~~~~~~~~~~~~~~~~~~~~~~~~~~~~~~~~~~~~~~~~~~~
🔶 HOW WE CALCULATE
~~~~~~~~~~~~~~~~~~~~~~~~~~~~~~~~~~~~~~~~~~~~~~~~~~
~~~~~~~~~~~~~~~~~~~~~~~~~~~~~~~~~~~~~~~~~~~~~~~~~~
🔹 Expected Move
The expected move is the predicted dollar change in the underlying stock's price by a given option's expiration date, with 68% certainty. It is calculated using the expiration's pricing and implied volatility levels.
Expected Move Calculation
Expected Move = (ATM straddle price x 0.6) + (1st OTM strangle price x 0.3) + (2nd OTM strangle price x 0.1)
For example , if stock XYZ is trading at 121 and the ATM straddle is 4.40, the 120/122 strangle is 3.46, and the 119/123 strangle is 2.66, the expected move is calculated as follows: 4.40 x 0.60 = 2.64; 3.46 x 0.30 = 1.04; 2.66 x 0.10 = 0.27; Expected move = 2.64 + 1.04 + 0.27 = ±3.9
🔹 Standard deviation
One standard deviation of a stock encompasses approximately 68.2% of outcomes in a distribution of occurrences based on current implied volatility.
We use the expected move formula to calculate the one standard deviation range of a stock. This calculation is based on the days-to-expiration (DTE) of our option contract, the stock price, and the implied volatility of a stock:
Calculation:
Standard Deviation = Closing Price * Implied Volatility * sqrt(Days to Expiration / 365)
According to options literature, there is a 68% probability that the underlying asset will fall within this one standard deviation range at expiration.
∑ Quant Observation: The values of the expected move and the 1st standard deviation (1STD) will not match because they use different calculation methods, even though both are referred to as representing 68% of the underlying asset's movement in options literature. The expected move is based on direct market pricing of ATM options. The 1STD, on the other hand, uses the averaged implied volatility (IVX) for the given expiration to determine its value. Based on our experience, it is better to consider the area between the expected move and the 1STD as the true representation of the original 68% rule.
~~~~~~~~~~~~~~~~~~~~~~~~~~~~~~~~~~~~~~~~~~~~~~~~~~
~~~~~~~~~~~~~~~~~~~~~~~~~~~~~~~~~~~~~~~~~~~~~~~~~~
🔶 USAGE
~~~~~~~~~~~~~~~~~~~~~~~~~~~~~~~~~~~~~~~~~~~~~~~~~~
~~~~~~~~~~~~~~~~~~~~~~~~~~~~~~~~~~~~~~~~~~~~~~~~~~
🔹 Create a new empty layout for the screener!
You can access this from the dropdown menu in the upper right corner. In the popup window, name it as you like, for example, "Option Screener."
🔹 Hide the candlestick chart
Make the chart invisible using the "Hide" option from the three-dot dropdown menu located in the upper left corner.
🔹 Other Unwanted Elements
If other unnecessary elements are distracting you (e.g., economic data, volume, default grid), you can easily remove them from the layout. Right-click on the empty chart area. Here, click on the gear (Settings) icon and remove everything from the "Events" tab, as well as from the "Trading" tab. Under the "Canvas" tab, it is recommended to set the "Grid lines" setting to "None."
~~~~~~~~~~~~~~~~~~~~~~~~~~~~~~~~~~~~~~~~~~~~~~~~~~
~~~~~~~~~~~~~~~~~~~~~~~~~~~~~~~~~~~~~~~~~~~~~~~~~~
🔶 Screener Settings
~~~~~~~~~~~~~~~~~~~~~~~~~~~~~~~~~~~~~~~~~~~~~~~~~~
~~~~~~~~~~~~~~~~~~~~~~~~~~~~~~~~~~~~~~~~~~~~~~~~~~
Naturally, the font size and position can be easily adjusted.
Additionally, there are two basic usage modes: manual input or using the preset list.
🔹If you selected “Manual Below” in the preset dropdown, the tickers you chose from the dropdown (up to a maximum of 40) will be displayed. The panel name will be the one you specified.
🔹If you selected a pre-assembled list , the manually entered list will be ignored, and the preset list will be displayed. (In the future, we will expand the preset list based on your feedback!).
~~~~~~~~~~~~~~~~~~~~~~~~~~~~~~~~~~~~~~~~~~~~~~~~~~
~~~~~~~~~~~~~~~~~~~~~~~~~~~~~~~~~~~~~~~~~~~~~~~~~~
🔶 Best Practices for TanukiTrade Option Screener:
~~~~~~~~~~~~~~~~~~~~~~~~~~~~~~~~~~~~~~~~~~~~~~~~~~
~~~~~~~~~~~~~~~~~~~~~~~~~~~~~~~~~~~~~~~~~~~~~~~~~~
🔹 Every Preset on a New Layout:
If you following the steps above, you easy can setup this screener in one window with one split layout:
🔹 Split Layout:
- Left Side: The underlying asset with our Options IV Overlay (IVR, Deltas, Expected Move, STD1, Skew visualized) along with the Enhanced Murrey Math Indicator and Option Expiry.
- Right Side: Searching for opportunities using our Options Screener.
Opportunities Search
🔹 Everything in One Layout + One Window:
This is the all-in-one view:
- The underlying asset with our Options IV Overlay (IVR, Deltas, Expected Move, STD1, Skew visualized)
- Enhanced Murrey Math Indicator and Option Expiry
- Options Screener on the left
~~~~~~~~~~~~~~~~~~~~~~~~~~~~~~~~~~~~~~~~
🔶 ADDITIONAL IMPORTANT COMMENTS
- U.S. market only:
Since we only deal with liquid option chains: this option indicator only works for the USA options market and do not include future contracts; we have implemented each selected symbol individually.
- Why is there a slight difference between the displayed data and my live brokerage data? There are two reasons for this, and one is beyond our control.
- Brokerage Calculation Differences:
Every brokerage has slight differences in how they calculate metrics like IV and IVx. If you open three windows for TOS, TastyTrade, and IBKR side by side, you will notice that the values are minimally different. We had to choose a standard, so we use the formulas and mathematical models described by TastyTrade when analyzing the options chain and drawing conclusions.
- Option-data update frequency:
According to TradingView's regulations and guidelines, we can update external data a maximum of 5 times per day. We strive to use these updates in the most optimal way:
(1st update) 15 minutes after U.S. market open
(2nd, 3rd, 4th updates) 1.5–3 hours during U.S. market open hours
(5th update) 10 minutes before market close.
You don’t need to refresh your window, our last refreshed data-pack is always automatically applied to your indicator , and you can see the time elapsed since the last update at the bottom of your indicator.
- Weekly illiquid expiries:
The Weekly Horizontal IVx Skew may not carry relevant information for instruments not included in the 'Weeklies & Volume Masters' preset package.
-Timeframe Issues:
Our option indicator visualizes relevant data on a daily resolution. If you see strange or incorrect data (e.g., when the options data was last updated), always switch to a daily (1D) timeframe. If you still see strange data, please contact us.
Disclaimer:
Our option indicator uses approximately 15min-3 hour delayed option market snapshot data to calculate the main option metrics. Exact realtime option contract prices are never displayed; only derived metrics and interpolated delta are shown to ensure accurate and consistent visualization. Due to the above, this indicator can only be used for decision support; exclusive decisions cannot be made based on this indicator . We reserve the right to make errors.This indicator is designed for options traders who understand what they are doing. It assumes that they are familiar with options and can make well-informed, independent decisions. We work with public data and are not a data provider; therefore, we do not bear any financial or other liability.

LuxAlgo® - Screener (OSC)The LuxAlgo® - Screener (OSC) is a complete tool allowing users to check returned information from the Oscillator Matrix™ toolkit's features for various user selected tickers and timeframes.
Users can customize the returned information by the screener, as well as filtering out displayed tickers based on custom user set rules.
🔶 FEATURES
Users can place the location of the screener everywhere they want, multiple locations are supported, you can even have it on your chart by drag and dropping the screener to your chart, allowing you to analyze them alongside your favorite indicators.
Keeping track of various tickers is crucial to have a deeper understanding of the overall market activity.
Our screener let you quickly access your preferred information in a convenient way thanks to the described features below:
Screening of the main Oscillator Matrix™ features on up to 10 user selected tickers and timeframes.
Ticker filtering based on custom user set rules.
Ticker sorting based on ascending/descending user selected data returned by the screener.
The LuxAlgo® - Screener (OSC) returns the following information:
Current price
Current volume
Current price percent change (% CHG)
Current price change (CHG)
Current rating
Most recent HyperWave signal
Current Money Flow value
Current Overflow value
Current HyperWave value
Most recent reversal signal
Most recent divergence
Current Confluence status
🔹 Rating
Users can quickly check the overall sentiment based on the screeners returned information by looking at the Rating column. Tickers can be rated as follows:
▲ Strong Bullish (more than 80% of the returned information is bullish)
△ Bullish (60% to 80% of the returned information is bullish)
― Neutral (40% to 60% of the returned information is bullish)
▽ Bearish (20% to 60% of the returned information is bullish)
▼ Strong Bearish (less than 20% of the returned information is bullish)
This can be a quick way to asses the confluence between all the returned information on the screener for a specific ticker.
🔹 Filtering
Thanks to the integrated filtering capabilities of the LuxAlgo® - Screener (OSC) you will be able to keep track of the information from tickers that return specific information you want to see.
For example do you want to only see the information from tickers with bullish money flow?
Nothing easier, all you need is to select the "Above" option in the Money Flow dropdown menu and set the value 50 in the input to the right.
However, you don't have to stop at 1 filtering condition, create more complex ones that fits your trading style for the tickers you truly want to look at!
🔹 Sorting
As traders we want to quickly spot the tickers with most volume, most volatility, with the strongest uptrend or downtrend.
The LuxAlgo® - Screener (OSC) lets you do that by sorting supported information in an ascending or descending order, letting you access the most relevant information faster.
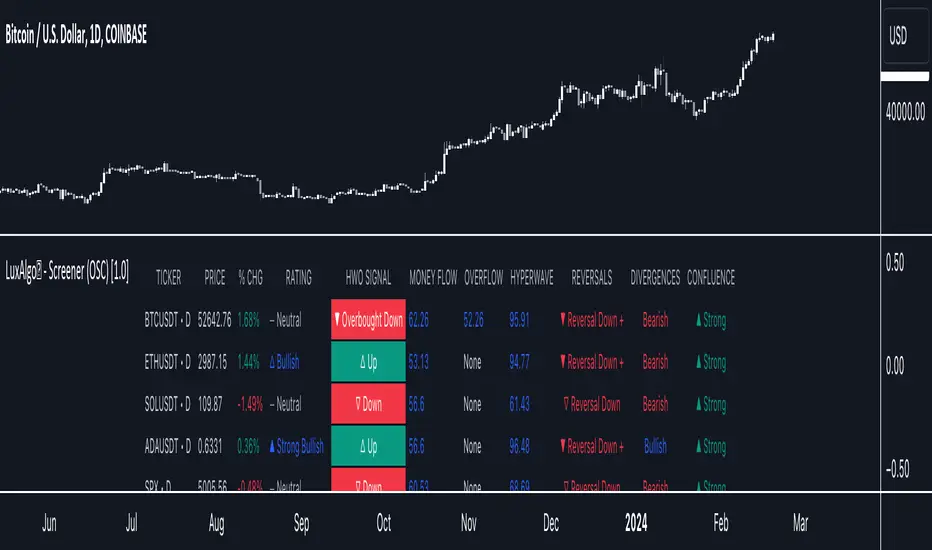
LuxAlgo® - Screener (PAC)The LuxAlgo® - Screener (PAC) is a complete tool allowing users to check returned information from the Price Action Concepts™ toolkit's features for various user selected tickers and timeframes.
Users can customize the returned information by the screener, as well as filtering out displayed tickers based on custom user set rules.
🔶 FEATURES
Users can place the location of the screener everywhere they want, multiple locations are supported, you can even have it on your chart by drag and dropping the screener to your chart, allowing you to analyze them alongside your favorite indicators.
Keeping track of various tickers is crucial to have a deeper understanding of the overall market activity.
Our screener let you quickly access your preferred information in a convenient way thanks to the described features below:
Screening of the main Price Action Concepts™ features on up to 10 user selected tickers and timeframes.
Ticker filtering based on custom user set rules.
Ticker sorting based on ascending/descending user selected data returned by the screener.
The LuxAlgo® - Screener (PAC) returns the following information:
Current price
Current volume
Current price percent change (% CHG)
Current price change (CHG)
Current rating
Most recent market structure
Most recent Order Block type and relative position to price
Order Block buy volume
Order Block sell volume
Order Block total volume
Most recent user set imbalance type status. Options include screening for FVG, Inverse FVG, Double FVG, Volume Imbalance and Opening Gap
Price position relative to Premium/Discount zones
Most recent liquidity grab
Most recent equal high/low
🔹 Rating
Users can quickly check the overall sentiment based on the screeners returned information by looking at the Rating column. Tickers can be rated as follows:
▲ Strong Bullish (more than 80% of the returned information is bullish)
△ Bullish (60% to 80% of the returned information is bullish)
― Neutral (40% to 60% of the returned information is bullish)
▽ Bearish (20% to 60% of the returned information is bullish)
▼ Strong Bearish (less than 20% of the returned information is bullish)
This can be a quick way to asses the confluence between all the returned information on the screener for a specific ticker.
🔹 Filtering
Thanks to the integrated filtering capabilities of the LuxAlgo® - Screener (PAC) you will be able to keep track of the information from tickers that return specific information you want to see.
For example do you want to only see the information from up trending tickers? Nothing easier, all you need is to select the up trending related options (▲ Strong Bullish or △ Bullish) in the rating dropdown menu.
However, you don't have to stop at 1 filtering condition, create more complex ones that fits your trading style for the tickers you truly want to look at!
🔹 Sorting
As traders we want to quickly spot the tickers with most volume, most volatility, with the strongest uptrend or downtrend.
The LuxAlgo® - Screener (PAC) lets you do that by sorting supported information in an ascending or descending order, letting you access the most relevant information faster.
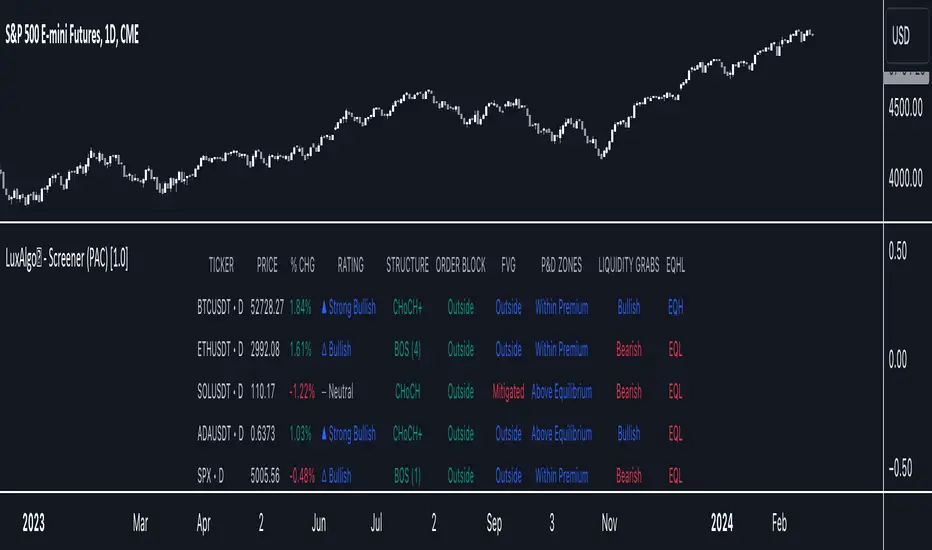
LuxAlgo® - Screener (S&O)The LuxAlgo® - Screener (S&O) is a complete tool allowing users to check returned information from Signals & Overlays™ features for various user selected tickers and timeframes.
Users can customize the returned information by the screener, as well as filtering out displayed tickers based on custom user set rules.
🔶 FEATURES
Users can place the location of the screener everywhere they want, multiple locations are supported, you can even have it on your chart by drag and dropping the screener to your chart, allowing you to analyze them alongside your favorite indicators.
Keeping track of various tickers is crucial to have a deeper understanding of the overall market activity.
Our screener let you quickly access your preferred information in a convenient way thanks to the described features below:
Screening of the main Signals & Overlays™ features on up to 10 user selected tickers and timeframes.
Ticker filtering based on custom user set rules.
Ticker sorting based on ascending/descending user selected data returned by the screener.
The LuxAlgo® - Screener (S&O) returns the following information:
Current price
Current volume
Current price percent change (% CHG)
Current price change (CHG)
Current rating
Most recent signal
Number of Exits since most recent signals
Current Smart Trail status
Current Reversal Zones status
Current Trend Catcher status
Current Trend Tracer status
Current Neo Cloud status
Current Trend Strength value
Current Lux Volatility value
Current Squeeze Index value
Current Volume Sentiment value
🔹 Rating
Users can quickly check the overall sentiment based on the screeners returned information by looking at the Rating column. Tickers can be rated as follows:
▲ Strong Bullish (more than 80% of the returned information is bullish)
△ Bullish (60% to 80% of the returned information is bullish)
― Neutral (40% to 60% of the returned information is bullish)
▽ Bearish (20% to 60% of the returned information is bullish)
▼ Strong Bearish (less than 20% of the returned information is bullish)
This can be a quick way to asses the confluence between all the returned information on the screener for a specific ticker.
🔹 Filtering
Thanks to the integrated filtering capabilities of the LuxAlgo® - Screener (S&O) you will be able to keep track of the information from tickers that return specific information you want to see.
For example do you want to only see the information from up trending tickers? Nothing easier, all you need is to select the up trending related options (▲ Strong Bullish or △ Bullish) in the rating dropdown menu.
However you don't have to stop at 1 filtering condition, create more complex ones that fits your trading style for the tickers you truly want to look at!
🔹 Sorting
As traders we want to quickly spot the tickers with most volume, most volatility, with the strongest uptrend or downtrend.
The LuxAlgo® - Screener (S&O) lets you do that by sorting supported information in an ascending or descending order, letting you access the most relevant information faster.
