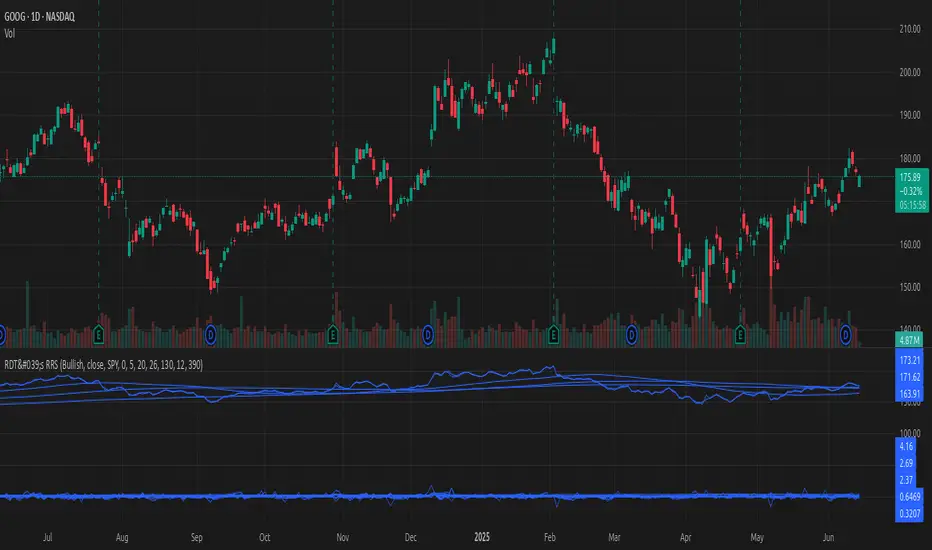
Breakout FilterIntroduction:
The Breakout Filter is a technical analysis indicator designed to identify potential breakout trading opportunities in the financial markets. It combines breakout conditions based on price and volume with the visualization of Exponential Moving Average (EMA) lines. This indicator can be a valuable tool for traders seeking to capture breakout movements while utilizing EMA lines for additional trend analysis.
Indicator Overview:
The Breakout Filter consists of three main filters: Filter 1, Filter 2, and Filter 3. Each filter has its own set of conditions that need to be met for a breakout signal to be generated. Additionally, the indicator plots EMA lines on the chart to provide further insights into the market trend.
Filter 1: Price & Volume Breakout (Default symbol: Tiny Yellow Triangle)
Filter 1 focuses on identifying breakouts based on both price and volume criteria. It considers the following conditions:
- Price Breakout: The close price crosses above the Donchian Channel's middle line, indicating a potential upward breakout.
- Volume Breakout: The trading volume exceeds the moving average of volume, suggesting increased market participation during the breakout.
When both the price breakout and volume breakout conditions are met, Filter 1 generates a signal indicating a potential breakout in the market. This filter helps traders identify significant price movements accompanied by higher trading volumes.
Filter 2: Upper Band Breakout
Filter 2 specifically looks for breakouts above the upper band of the Donchian Channel. This condition suggests a potential strong upward momentum in the market. When the high price exceeds the upper band, Filter 2 generates a signal, indicating a breakout above the recent price range.
Filter 3: Combined Filter 1 and Filter 2
Filter 3 combines the conditions of both Filter 1 and Filter 2. It requires that both Filter 1 and Filter 2 generate signals simultaneously. When this happens, it indicates a strong breakout signal with price and volume confirming the upward momentum.
EMA Lines:
The Breakout Filter with EMA Lines also includes the visualization of Exponential Moving Average (EMA) lines on the chart. EMA is a popular technical indicator used to identify the overall trend in the market. The indicator plots three EMA lines with different periods: EMA1, EMA2, and EMA3. Traders can choose the periods for each EMA line based on their preference and trading strategy.
The EMA lines can provide additional insights into the market trend and potential support or resistance levels. By observing the interaction between the price and the EMA lines, traders can gain a better understanding of the prevailing market sentiment and make informed trading decisions.
How to screen these filters using Trading View Screener
Insert column "DONCHIAN20 UP" and set to "EQUAL HIGH"
Conclusion:
The Breakout Filter with EMA Lines is a comprehensive indicator that combines breakout conditions based on price and volume with the visualization of EMA lines. It helps traders identify potential breakout trading opportunities while providing insights into the market trend. By using this indicator, traders can enhance their trading strategies and potentially improve their trading outcomes.
Please note that this write-up is for informational purposes only and should not be considered as financial advice. Traders should conduct their own analysis and exercise caution when making trading decisions.
Cari dalam skrip untuk "screener"
ATR VisualizerAdvance Your Market Analysis with the True Range Indicator
The True Range Indicator is a sophisticated screener meticulously developed to bolster your trading execution by presenting an exceptional understanding of the market direction. The centerpiece of this instrument is a distinctive candle configuration depicting the Average True Range (ATR) and the Bear/Bull range. However, it traverses beyond the conventional channels to offer specific market settings to boost your trading decisions.
User-Defined Settings
Broadly, the indicator offers five dynamic settings:
Bear/Bull Range
The Bear/Bull Range outlines the ATR for each candle type - bearish and bullish - and then smartly opts for the pertinent one based on the prevalent market circumstances. This feature aids in comparing the range of bullish and bearish candlesticks, which deepens your understanding of the price action and volatility.
Bearish Range
The Bearish Range isolates and computes the ATR for bearish candles solely. Utilizing this option spots the bear-dominated periods and provides insights about potential market reversals or downward continuations.
Bullish Range
Opposite to the Bearish Range, the Bullish Range setting tabulates the ATR exclusively for bullish candles. It assists in tracking the periods when bulls control, enlightening traders about the possibility of upward continuations or trend reversals.
Average Range
The Average Range provides an unbiased measure of range without prioritizing either bull or bear trends. This model is ideal for traders looking for a holistic interpretation of market behavior, regardless of direction.
Cumulative Average Range
Equally significant is the Cumulative Average Range which calculates the aggregate moving average of the true ranges for an expressed period. This setting is extremely valuable when evaluating the long-term volatility and spotting potential breakouts.
Dual Candle Configuration
Going a step ahead, the True Range Indicator uniquely offers the possibility to incorporate more than one candle estimate on your screen. This ensures simultaneous analysis of multiple market dynamics, thereby enhancing your trading precision multifold.
Concluding Thoughts
In essence, the True Range Indicator is an indispensable companion for traders looking to not only leverage market volatility but also make educated predictions. Equipped with an array of insightful market settings and the ability to display dual candle estimates on-screen, you can customize the functionality to suit your unique trading style and magnify your market performance dramatically.
Sessions[Lenny Kiruthu]The script below is designed to show up to 4 different trading sessions i.e. London, New York, Tokyo and Sydney sessions, it also displays the days each session is taking place in as well as two horizontal lines one for the previous days high and the other for the previous days low.
It also displays a table that shows the user the highest and lowest price for 4 different currency pairs the previous day as well as their current prices and below it a confirmation row that shows whether price is currently above, below or within yesterdays range. Note that it only states "High Broken" or "Low Broken" if the current close is above or below the lines.
What you can change
Your time zone for example GMT -4 or GMT +3
The session start and end time
The colors, border type and border width of the session ranges
Displaying the table
Ability to choose the 4 symbols to view on the table
BEST ABCD Pattern Screener Deribit:DVOL BTC DXY scannerModified this script by Daveatt (based on Ricardo Santos Fractals)
to scan patterns in BTCUSD, ETHUSD, DVOL, DXY, DVOL/VV
Fixed Quantum VectorSelect a zone to analyse the vectors.
This screener show the ratio of the bullish and bearish candle vector and on volume.
Slide the white bar to choose your sample size or you can enter the date.
Click label to hide start calculation and end calculation.
- Happy trading
Quantum Vector AlertsIts the part 2 of Multiple Indicators 50EMA Cross Alerts.
Its more suitable for the seconds chart. Beside, you can use it in higher timeframe.
The input bars length is the sample size that the code will use to trigger all alert. 20 mean 20 bar after the current candle.
When you activate volume alert you can select an amount of volume that when volume cross it you will be notified. The volume of every bar is displayed in the screener below volume.
In the section percentage vector counting the script do the sum of the red vector and green vector and give a ratio. In bullish vector count percentage for alert, you can select the percentage difference that you want to receive an alert. If your sample have 3 red vectors and 7 green vectors you will receive an alert saying that there is an imbalance of 70% showing more green vectors.
You can select a variant of percentage vector. The variant will do a summation of volume. If 1 vector candle is the size of the 3 other vector, they will have the same ponderation.
Normal alert counting count the number of vectors in the bars length. You can count the red and green candle only or add the blue and violet.
Bullish vector count will show a notification when the number of green candle will appear on the chart in the selected length. The same process is valid for bearish vector count. For example, if you want 3 bullish candle in 20 bar. You select bars length 20 and bullish vector count 3.
These alerts are suitable to the hybrid system. Thanks to our teacher Trader Reality and to all the member that contribute to this great discord community.
Beta ScreenerThis script allows you to screen up to 38 symbols for their beta. It also allows you to compare the list to not only SPY but also CRYPTO10! Features include custom time frame and custom colors.
Here is a refresher on what beta is:
Beta (β) is a measure of the volatility—or systematic risk—of a security or portfolio compared to the market as a whole (usually the S&P 500 ). Stocks with betas higher than 1.0 can be interpreted as more volatile than the S&P 500 .
Beta is used in the capital asset pricing model (CAPM), which describes the relationship between systematic risk and expected return for assets (usually stocks). CAPM is widely used as a method for pricing risky securities and for generating estimates of the expected returns of assets, considering both the risk of those assets and the cost of capital.
How Beta Works
A beta coefficient can measure the volatility of an individual stock compared to the systematic risk of the entire market. In statistical terms, beta represents the slope of the line through a regression of data points. In finance, each of these data points represents an individual stock's returns against those of the market as a whole.
Beta effectively describes the activity of a security's returns as it responds to swings in the market. A security's beta is calculated by dividing the product of the covariance of the security's returns and the market's returns by the variance of the market's returns over a specified period.
cov (a,b)/var(b)
Line Break Heikin AshiThis script takes two candle styles and combines then into one. By only using the closing price to inform the heikin ashi candles you get a lovely line break style heiken ashi candle. The advantage to this if you are into this kind of thing is that it makes for a smoother experience. You still get wicks just because of the nature of heikin ashi but they are dramatically reduced. This is defiantly an experimental indicator as its just a different way to look at the chart. I hope some one can find use in this outside of a work around pine script limitations. I had to create this for my sentiment tracker section of my qqe bb screener because it uses so many symbols that I cant get the open, high, or low for each. If you find any bugs please report them, or if you have any feedback please leave it. Enjoy!
QQE Student's T-Distribution Bollinger Bands ScreenerThis script scans 20 custom symbols and displays the QQE Students T-Distribution Bollinger Bandwidth as a percentage, the quarter segment percentage, a score that tells you what segment of the band the price is in, and what direction the market is going in. This is useful because it can tell you how volatile a market is and how much reward is in the market. It also tells you what direction the market is going in so you can pick a symbol that has the best looking reward. I really hope that this script complements the group of indicators I have made so far. Here is a list of the other two indicators related to this script.
Please enjoy!
MA Cross ScreenerThis script lets you pick 20 symbols to check for ma crosses. The way it works is it scans all 20 of your symbols for moving average crosses and then it sends an both a regular alert and a visual alert inside of the indicator. I found that ma cross strategies are very popular right now so I thought it would be nice to have one indicator instead of 20 discord servers. The features include: 20 custom symbols, alerts, custom colors, ma select, and custom time frames. If you want to use the custom time frame option, use the lowest time frame possible. That way you wont have gaps. If you have any comments please voice them, that includes suggestions!
I hope you all find this useful!
[ChasinAlts] RSI (Time-Spent) Count[MO]// Hello fellow traduers, hope all is well in your neck of the woods. Anywho, I'll attempt to be short and sweet.
// I've been doing a LOT of work recently with RSI to figure out what its all about and to learn the ins and outs.
// Some great ideas (I think at least) have come to fruition from the deep-dive into RSI, thus, I've got 2 of these ideas
// to share. One notable feature for the RSI is when there is a BULLISH trend, it is VERY likely to stay within the upper
// 2/3rds of the RSI extremes (0-100) and vise-versa for BEARISH trends and the lower 2/3rds of the RSI extremes.
// That is where this script's idea was derived. Now PLEASE, do tell, if you disagree with me (preferably via a cool,
// calm, and collected comment...but hey, that's up to you). Ok, now the script.
//
// What this does is gives you a Bullish and Bearish count for the bars. Bullish Cnt counts up by +1 per every PRINTED bar
// that is above OverSold and vise-versa for the Bearish Cnt and being below OverBought. That does VERY MUCH make it
// possible for both counts to have a high value if RSI is staying between OverBought and OverSold for extended periods
// of time. Though, the ONLY count that will be shown is the one with the highest value.
//
// There are tooltips describing each of the settings but I will quickly talk about 3 more things. First of all, I prefer
// to have as few settings in the settings menu as possible thus the "Boundaries to OB/OS" setting can be viewed as the
// OverSold input and the OverBought setting is configured from this by subtracting "Boundaries to OB/OS" from 100
// (ie. 100-Oversold = OverBought). There Lastly, there is the option to show ONLY the coin with the MAX Count from each
// 'set' of coins. When that count resets to 0 then the next highest count coin will take its place. To use this instead
// of how the script is currently constructed you only need to comment out (add '//' at the beginning of each line of) the current
// plot functions and uncomment the lines at the very bottom under the 'MAX' section. Doing so also reveals the possibility of
// setting an alert for when the coin with the max count changes between different coins. This is very helpful because since it
// only gives the top count of ALL the coins in the selected set, this count is most likely going to continue forward with its
// count for a while thus when the alert goes off I prefer to look at the potential trades in the opposite direction of which
// the max coin was just in (ie. if its count plot/label is red and it stops then look for a potential long trade on the coin
// who's count just reset. Only ONE more piece of the script I have yet to talk about. There is a filter in the code and you
// can select to use or not use within the settings. What this filter does is it counts all the printed bars within the last
// ___bars(user selectable). This is due to the fact that if there is no trade that occurs on a bar then TradingView does not
// print the bar. The coins that have fewer updates also tend to stay within a tighter range for it's RSI thus many times
// giving the illusion that the coin is a good trade bc its trending count is very high (tending to be higher than the others)
// thus hogging the precious chart space if using the script in its current form, or hogging up the MAX slot so that no other
// (and most likely BETTER-TO-TRADE) coins will be shown. It is a great volatility indicator (that of which I have published
// a script using the idea in the recent past). If selected in the settings menu and if the % of printed bars count goes below
// the user set minimum % then both Bullish and Bearish counts will be reset. This is indicated within the counts plots by looking
// at the plots whose counts reset and rather than the plots just stopping printing in mid-air, they will continue to plot while the
// counts reset and fall down to 0. These types of coins will keep you in a trade longer that you'd probably want gaining less than
// you'd probably expect.
//
// Peace Folks & Happy Trading,
//
// ChasinAlts
AlphaTrend StrategyThe strategy version of AlphaTrend indicator for backtesting and optimisation purposes for TradingView users:
Screener / Explorer version and an English explantion video will be published soon...
AlphaTrend's parameters are designed for daily and 4H charts, feel free to optimize on all time frames.
Hope you all use Alphatrend in your profitable trades.
Kıvanç
Donchian Channels+Standard Donchian Channels, this includes a Trend EMA which can be configured and the channels will use to give buy and sell signals. The channels are also colored in such a way to indicate a trend reversals. My favorite part that sets this apart from others is, if using the bClose option (which I recommend you do) the trend will not reverse until there is a close above/below the previous channel high/low. i.e. a reversal into an uptrend requires the current bar to close above the previous upper channel rather than just a new high.
The coloring of the current trend allows for a quick read of current market conditions and I use this on any timeframe across all forms of charts (forex stock, futures , crypto, etc). When taking one of the signals I use the opposite channel as the stop loss (when buying use bottom, and selling use top channel)
Update 1:
- Added my name to the code
- Updated the picture to show off the indicator better
- Raised the brightness of the fill color a bit, looks nicer I think
As a warning: I have obviously hand picked this picture to really show off this indicator's power to work in a trending market. Donchian Channels are a trending indicator and work best in trending markets with decent pull backs. If there are multiple signals going in each direction, it is a choppy market and you should stay out until it starts trending again. I generally use a 1:1.5 risk to reward ratio but sometimes will stretch it to 1:2 if it is a nice trade and I feel the market is in my favor as you can see from the trades placed in the picture (and I use that method for any commodity / chart and timeframe). I use the close of the white candle and then (since they are trades going short) I use the upper Donchian Channel as my stop loss.
I personally like to have the lines and labels turned off and enable all other options. Labels are just there to really stand out so you don't miss the white candle indication for a trade. OH! Also, I've had comments from friends that the white candles are hard to see, I turn off my candle borders in settings; makes it super easy to see them then. I turn lines off as the fill does the job well enough and it seems cleaner in my eyes.
If you'd like to see this picture on your chart, it is Micro E-Mini S&P 500 Futures from July 10, 2022 @ 18:00 on the 1-min chart.
just now
Update 2:
- Added day trading time highlights
- Added ranging market indicator (This I'm still working on so use at your own discretion, it's intended purpose is to tell when the Donchian Channels are not going to give great signals and to use a ranging indicator instead)
- Added multi-timeframe trend screener (handy if you want to quickly see the trend direction (based on the Trend EMA you set) of several time frames without having to change charts). It will draw in the bottom right of the chart.
Volume Spikes & Growing Volume Signals With Alerts & ScannerVOLUME SPIKES & GROWING VOLUME SIGNALS WITH ALERTS & SCANNER
This indicator shows arrows when there is a volume spike. It also paints the background when volume is growing. There is also a volume scanner for 8 tickers that will change color in real time when your other favorite tickers see volume growth and spikes.
You can customize the length of DMI, the number of bars to calculate the current volume average from, the number of bars back to get the overall volume average from, the multiple that needs to be hit to give a signal, the position of the scanner table and which tickers are used in the scanner. There are detailed directions as tooltips in the indicator settings you can read to understand exactly what each input does.
All features are customizable as well as which tickers the screener uses.
***HOW TO USE***
Watch for volume to pick up before placing trades as this will help you stay out of the markets when price is choppy. Volume usually brings volatility so watch for the volume signals to show up on the chart. Typically when price has made a big move one direction or is consolidating and you see the volume indicator start giving signals, the market is ready to reverse or continue its current trend but move faster in that direction.
Volume Spikes
When there is a volume spike that is larger than the average of volume over the last 100+ bars(depending on your settings) multiplied by the volume amount multiplier(in your settings) then an arrow will show up on the chart. This arrow will be green if DMI is bullish and red if DMI is bearish.
Volume Growth
A Background color will appear when the average volume over the last 5 bars(depending on your settings) is higher than the average volume over the last 100+ bars(depending on your settings) and is greater than your multiple. It will also paint the background when the volume moving average has increased over the last 3 bars consecutively. The background colors will be red or green depending on buy & sell pressure(DMI). If the background color appears, then you know volume is growing and volatility is near.
Volume Scanner
The scanner can be customized to have all of your favorite tickers by changing the tickers used in the indicator settings at the bottom. When no volume growth or spikes are detected, the ticker will show as light blue. When volume spikes or growth is detected, the ticker will turn orange to notify you.
Alerts
You can set up alerts as well when there is volume growth, bullish volume spikes and bearish volume spikes on any chart or timeframe.
Indicator Settings
Settings will need to be adjusted across different tickers as some have large swings in volume and some stay pretty even, so make sure to set up different chart layouts with settings that work for each ticker and save them individually so you don’t have to reset these values every time you switch charts.
***MARKETS***
This indicator can be used as a signal on all markets, including stocks, crypto, futures and forex as long as Tradingview has volume and DMI data for that ticker.
***TIMEFRAMES***
This volume spike indicator can be used on all timeframes as long as there is enough data for Tradingview to use for calculations.
***TIPS***
Try using numerous indicators of ours on your chart so you can instantly see the bullish or bearish trend of multiple indicators in real time without having to analyze the data. Some of our favorites are our Auto Fibonacci, Volume Profile, Momentum, Auto Support And Resistance and Money Flow Index in combination with this Volume Growth indicator. They all have real time Bullish and Bearish labels as well so you can immediately understand each indicator's trend.
Multiple Indicator 50EMA Cross AlertsHere’s a screener including Symbol, Price, TSI, and 50 ema cross in a table output.
The 50 Exponential Moving Average is a trend indicator
You can find bullish momentum when the 50 ema crossed over or a bearish momentum when the 50 ema crossed under we are looking to take advantage by trading the reversion of these trends.
True strength index (TSI) is a trend momentum indicator
Readings are bullish when the True Strength Index shows positive values
Readings are bearish when the indicator displays negative values.
When a value is above 20, we look for selling overbought opportunity and when the value is under 20, we look for buying oversold opportunity.
You can select the pair of your choice in the settings.
Make sure to create an alert and choose any alerts then an alert will trigger when a price cross under or cross over the 50 ema for every pair separately.
This allow the user to verify if there is a trade set up or not.
Disclaimer
This post and the script don’t provide any financial advice.
MomentumThis indicator will give you the momentum readings (rate of change) for five lookback periods (15m, 60m, 4hr, 24hr, 48hr).
This is useful when backtesting or retroactively logging the readings into your trade journal (there is no way to roll back the Forex Factory momentum screener that I know of).
There are lines drawing in the background which are set to 100% transparency by default, so don't be puzzled when you occasionally see the bubbles for the line plots being highlighted on your chart.
Message me with any questions or suggestions.
Frog in Pan IndicatorWhat is it?
This indicator is the percent of negative days minus the percent of positive days in a year multiplied by the sign of the overall return of the lookback (365 days for crypto and 252 days for stocks).
FIP = sign(return of lookback) *
What is it used for?
This indicator is used as a quality screener for momentum stocks. It is based behind the ideas in Wesley Gray & Jack Vogel's book: Quantitative Momentum: A Practitioner's Guide to Building a Momentum-Based Stock Selection System that iterates that quality momentum stocks consist of steady uptrends (where more days are positive rather than negative) as opposed to characteristics of "lottery-like" stocks that are "jumpy" and more volatile. More research behind this indicator can be found here
How to use
In the indicator settings, the default lookback parameter is set to 365 days for analysis on cryptocurrencies and was used on a daily timeframe. If you want to use this indicator on individual stocks, it is best to change this lookback to 252 days. The more negative the value is, the higher quality of momentum it is.
Wick Pressure by SiddWolfMultiple Wicks forming at OverSold & OverBought levels create Buying and Selling Pressure. This Script tries to capture the essence of the buy and sell pressure created by those wicks. Wick pressure shows that the trend is Exhausted.
How it works:
This Wick Pressure Indicator checks for three candles forming the wicks in overbought and oversold zones. The zones are set by RSI and can be changed in settings. Those three candles should form a bit long wick and length of the wick is determined by ATR. The ATR multiple can be changed from settings. And then the script draws a box in the area formed by three candle wicks.
Confluence:
This indicator should not be used on its own. You should include it in your existing trading strategy. Any indicator should be rigorously tested before making any real trades.
Settings is the Key:
Settings are key to all of my indicators. Play around with it a bit. Change the ATR multiplier. Read the tooltips to understand what each settings mean. Tooltips are the (i) button in-front of each settings.
FAQs:
Q. Does the indicator Repaint ?
--- No. None of my indicators repaints. What you see now is what's drawn in real time.
Q. Indicator doesn't show anything ?
--- Maybe you've messed up the settings so reset it. or try different coin/stock.
Q. Does this indicator give financial advice?
--- No. Nope. Nein. Não. नहीं.
Conclusion:
This indicator is very basic but if used correctly it can be very powerful. Hit me up if you'd like to see the screener/scanner for this or any of my indicators. If you have any questions or suggestions feel free to comment below. I'd love to connect with you. Thank you.
~ SiddWolf
Syminfo [Epi]Hello! This little script tells you everything TradingView lets you access in a ticker's syminfo in Pine Script:
- description
- type: crypto, economic, forex, fund, futures, index, spread, stock
- tickerid, such as AMEX:BLOK
- prefix, such as AMEX
- Ticker, such as BLOK
- root: for derivatives such as futures contracts
- currency, such as USD
- base currency: returns 'BTC' for the ticker 'BTCUSD'
- mintick
- point value
- session: regular, extended
- timezone
Some surprises I found in my development:
- there are some more types than mentioned in the documentation,
- the tickerid takes on additional information if you adjust for dividends or show extended session,
- the prefix contains "_DL" additions depending on your data subscriptions, .e.g. "CME_MINI_DL:ES1!",
- with futures, TV will show session.regular both for the 'regular' and the 'electronic' session.
- Unfortunately, syminfo does not contain the 'sector', although TV has the information in the database (the sector is shown in the screener but not accessed in Pine Script).
I use this little utility in my development and hope it's useful for the community. I see such a great number of contributions from the community and would like to give back, even if it's not much.
Runners & Laggers (scanner)Firstly, seems to me this may only work with crypto but I know nothing about the other sectors so i could be wrong. I was trying to think up a good way to find moving coins(other than by volume bc theres holes in the results when using it this way). Thought this was an interesting concept so decided to publish it as I've seen no others like it (though i did not extensively search for it. We need to start with a little Tradingview(TV) common knowledge. When there is no update of trades/volume in a candle TV does not print the candle. So when looking at (let's say) a 1 second chart, if the coin being observed by the user has no update from a trade in the time of that 1 sec candle it is skipped over. This means that a coin with a ton of volume might fill an entire 60 seconds with 60 candles and conversely with a low volume coin there could be as little as 0 1-second candles. BUT even for normally low volume coins, when a pump is beginning with the coin it could literally go from 0 1-second candles within a minute to 60 1-second candles within the next minute. ***NOTE: This DOES NOT show ANY information if the coin is going up or down but rather that a LOT more trading volume is occurring than normal.*** What this script does is scans (via request.security feature) up to 40 coins at a time and counts how many candles are printed within a user set timespan calculated in minute. 1 candle print per incremented timeframe that the chart is on. ie. if the chart is a 1 min chart it counts how many 1 min candles are printed. So, (as is in the captured image for the script) if you wanted to count how many 5 second candles are printed for each coin in 1 min then you would have to put the charts timeframe on 5sec and the setting titled 'Window of TIME(in minutes) to count bars' as 1.0 (which bc it's in minutes 1.0m = 60sec and bc 60s / 5s = 12 there would be 12 possible values that each coin can be at depending on how many bars are counted within that 1min/60sec. *** I will update to show an image of what I'm talking about here. Now, the exchange I'm scanning here is Kucoin's Margin Coins. There are 170 something coins total but I removed a few i didn't care for to make it a round 40 coins per set (there being 4 sets of 40 coins total=160 coins being scanned). To scan all 4 sets the indicator must be added 4 times to the chart and a different 'set' selected for each iteration of the script on the chart. Free users can only scan 3 at the most. All others can scan all 4 sets. In the script you can change the exchange and coins as necessary. If there done so and there are not 40 coins total just put '' '' in the extra coins spots that are not filled and the script will skip over these blankly filled spots. The suffix (traded pair) for the tickerID on all Kucoin's Margin Coin's is USDT so that's what i have inputted in the main function on line 46 (will need to be changed if that differs from the coins you want to scan. Next in the line of settings is 'Window of TIME(in minutes) to count bars' which has already been discussed. Following that is the setting "Table Shows" which the results are all in a table and the table will present the coins that have either "Passed" or "Failed" depending on which you choose. The next setting determines what passes or fails. If there are 12 possible rows for the coins to be in (as described above) then this setting is the "Pass/Fail Cutoff" level. So if you want to show all the coins that are in rows 11 and 12 (as in the image at top) then 11 should be selected here. At this point you will see all the coins that have a lot of volume in them. Finding coin names in the table that are usually not with a ton of volume will present your present movers. NOTE: coins like BTC and ETH will almost always be in these levels so it does not indicate anything different from the norm of these coins. Last setting is the ability to show the table on the main window or not. Hope you enjoy and find use in it. BTW this screener format is the same as the others I have published. If you like, check those out too. If you find difficulty using then refer to those as well as they have additional info in them on how to use the scanner and its format. Lastly, in the script is the ability to print the plots and labels but I commented them out bc its really just a jumbled mess. In the commented out sections there is a Random Color Function (provided by @hewhomustnotbenamed which was developed on the basis of Function-HSL-color by @RicardoSantos. All right, peace brothers....and sisters.
**** Also, I see how the "levels" could be confusing so I will put them into a % format soon (probably not today) so that the "Pass/Fail Cutoff" can be in % format so that if "passed" is chosen and 50% is chosen (in the new setting that will be changed) then it'll show you all the coins that have more than 50% of the bars printed within the time window chosen. Goodluck in all your trading adventures. ChasinAlts out.
multicolor Bollinger Bands (BB <-> KC)Concept:
After every low volatile phase comes a high volatile phase and after every high volatile phase comes a low volatile phase.
If the Bollinger bands are smaller then the Keltner channel (colored red), the price action is low in volatility… meaning a breakout (colored green) will happen soon.
If Bollinger band is bigger than the Keltner channel = green
If Bollinger band is smaller than the Keltner channel = red
Displaying the Keltner Channel is optional
If multicolor BB is disabled, BB color = blue (default color)
Customise colors to your liking under settings -> style
-----------------------------------
To get alerts for all coins
1. visit » tradingview.com/crypto-screener
2. set the filter to »
Bollinger Upper Band (20) below Keltner Channels Upper Band (20)
Bollinger Lower Band (20) above Keltner Channels Lower Bands (20)
3. add your own custom filters, like: exchange, marketcap, etc…
4. choose the timeframe you want
5. enable alerts
Right Way OscillatorThis is a large composite screener indicator that includes 14 different indicators, the values of which are arranged in a color format and show the current market situation,
as well as all these values are summarized in a chart, each value is weighted by strength, which allows you to get a comprehensive picture of the market at the moment,
2 signal lines are plotted on the indicator, their intersection means that most indicators will show the maximum score.
Also, at the expected moments of the appearance of a trend movement, a gray background lights up on the indicator and 2 colored lines of the DI indicator appear, the color of the bottom line indicates what kind of movement is brewing.
ADX Screener// Identify potential trend reversals using ADX on up to 40 crypto assets.
// ADX shows the strength of a trend, not the direction.
// By monitoring the difference of ADX values between candles, you can potentially identify reversals before they happen.
// A strong trend has a 14 period ADX slope increasing .5 or more from the prior candle.
// At a minimum, a weak trend has a 14 period ADX slope of +.25 or less, and strictly it would be decreasing.
// This indicator prints one row for each asset with three columns for ADX differences one candle back each.
// The asset name is colored green or red dependent on whether +DI > -DI or not.
The market was in a down trend (-DI > +DI).
A bullish wave moved price up to EMA 8 resistance with strong ADX momentum (ADX diff of prior candle >= 0.5).
A Spinning Top showed that the trend was losing momentum (ADX diff lower than previous candle, showed the bullish wave losing momentum).
A Morning Star bearish reversal pattern draws resistance at the high of the pattern. (ADX Bullish momentum exhausted).
Symbol: -DI > +DI
2: Strong momentum
1: Losing momentum (spinning top)
0: Trend reversal (bearish engulfing pattern)