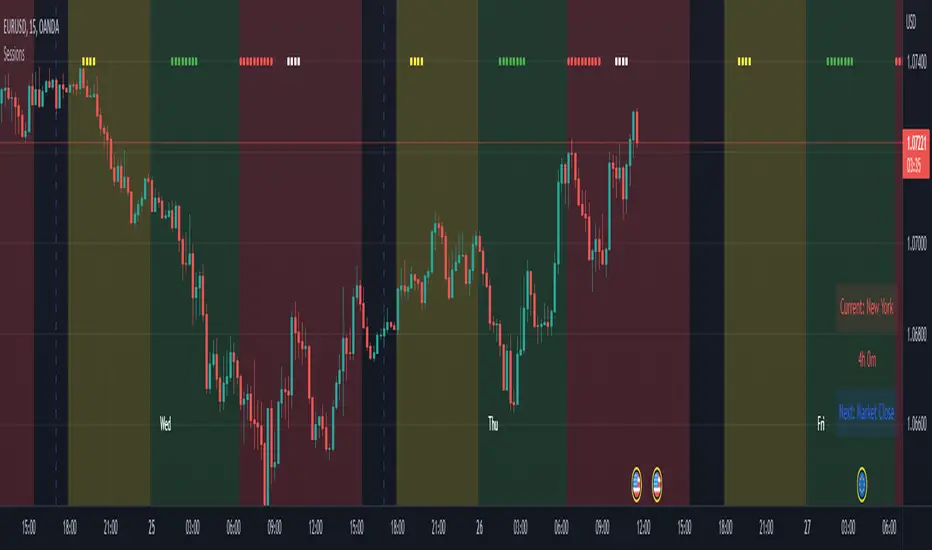
Institutional Sessions Overlay (Asia/London/NY)Institutional Sessions Overlay is a professional TradingView indicator that visually highlights the main trading sessions (Asia, London, and New York) directly on your chart.
Customizable: Easily adjust session start and end times (including minutes) for each market.
Timezone Alignment: Shift session boxes using the timezone offset parameter so sessions match your chart’s timezone exactly.
Clear Visuals: Colored boxes and optional labels display session opens and closes for fast institutional market structure reference.
Toggle Labels: Show or hide session open/close labels with a single click for a clean or detailed look.
Intuitive UI: User-friendly grouped settings for efficient configuration.
This tool is designed for day traders, institutional traders, and anyone who wants to instantly recognize global session timing and ranges for SMC, ICT, and other session-based strategies.
How to use:
Set your chart to your local timezone.
Use the "Session timezone offset" setting if session boxes do not match actual session opens on your chart.
Adjust the hours and minutes for each session as needed.
Enable or disable labels in the “Display” settings group.
Tip: Use the overlay to spot session highs and lows, volatility windows, and institutional liquidity sweeps.
Cari dalam skrip untuk "session"

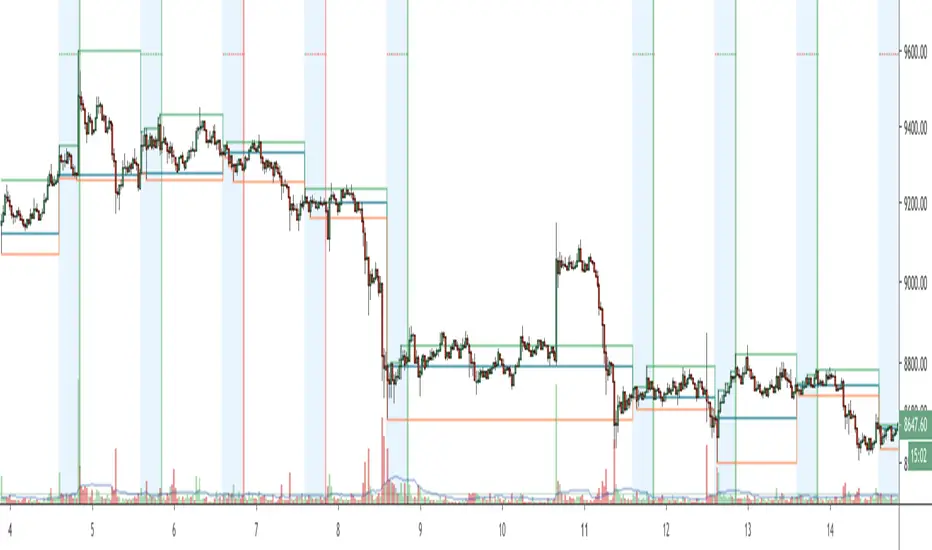
Worldwide Sessions and Open Range BreakoutThis script shows when the various normal market hours for each of the major worldwide markets (Asia, New York, and London). It also draws a line on the opening range for each of these market sessions. The opening range defaults to the first 15 minutes of the session, but this can be customized.
This script does automatically handle the session times regardless of your time zone or what time frame you are on. No need to set anything! This probably can't handle non-normal trading days, such as partial days.
This script is made for futures, but would likely work for other markets, like Forex.

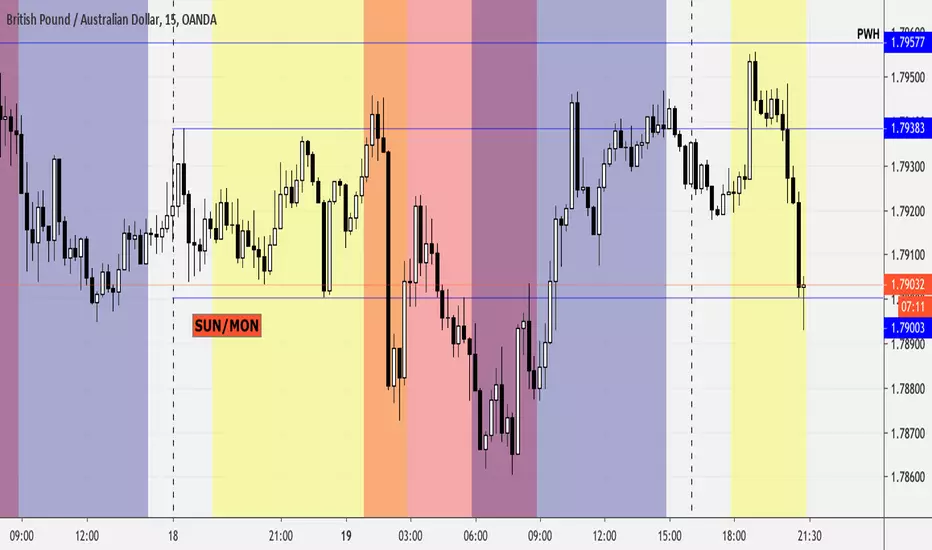
London/NY Sessions + SMC Levels📜 Indicator Description: London/NY Sessions + SMC Levels
Overview: This indicator highlights the key trading sessions — London, New York, NY Lunch, and Asian Range — providing structured visual guides based on Smart Money Concepts (SMC) and ICT principles.
It dynamically plots:
Session Backgrounds and Boxes for London, NY, Lunch, and Asian sessions
Reference Levels for the High, Low, and Close from today, previous day, or weekly data
Midnight Open line for ICT-style power of three setups
Real-time alerts for session starts, session closes, and important price level crossings
Features:
🕰️ Session Visualization:
Toggle London, NY, Lunch, and Asian session ranges individually, with customizable colors and transparent backgrounds.
🔔 Built-in Alerts:
Alerts for:
Price crossing the previous day's high/low
Price crossing the Midnight Open
Start and end of major sessions (London, NY, Lunch, Asian)
🟩 Reference Levels:
Plot selectable session reference levels:
Today’s intraday High/Low/Close
Previous Day’s High/Low/Close
This Week’s or Previous Week’s levels for broader context.
🌙 Midnight Open:
Track the Midnight New York Open as a reference point for daily bias shifts.
🎯 Customizable Settings:
Choose your session time zones (UTC, New York, London, etc.)
Customize all border colors, background colors, and session hours.
Use Cases:
Identify killzones and optimal trade entry windows for Smart Money Concepts (SMC) and ICT strategies.
Monitor liquidity pool sweeps and session transitions.
Confirm or refine your intraday or swing trading setups by referencing session highs/lows.
Recommended For:
ICT traders
Smart Money Concepts (SMC) practitioners
Forex, indices, crypto, and futures traders focusing on session-based volatility patterns
Anyone wanting a clean, professional session mapping tool
📈
Designed to help you trade with session precision and Smart Money accuracy.
Integrates seamlessly into any ICT, Wyckoff, or Liquidity-based trading approach.

Advanced Time SessionsIntroducing a new improved Sessions indicator, still using that 24 hour look ahead plotting, this time with a twist of eye pleasing data. Now traders at a quick glance can see what session they trading in, time till its done, and what is the next session. Including daily dividers, day labels and kill zone highlighters. This tool is a day traders dream to have this subtle and stylish data at a glance letting you focus on more strategically placing your trades based around time and price!
NYSE Session for 24/7 marketsThis script is used for analyzing the correlation between 24/7 markets with regards to the price action during NYSE session. Defaults to showing daily session open/high/low but there is the option to show the weekly session data.
Forex Sessions (Asian, London, New York)This script lines up the different sessions for New York, Asian, and London. It also have overlap between the sessions and the colors have been adjusted to make it easier to read.
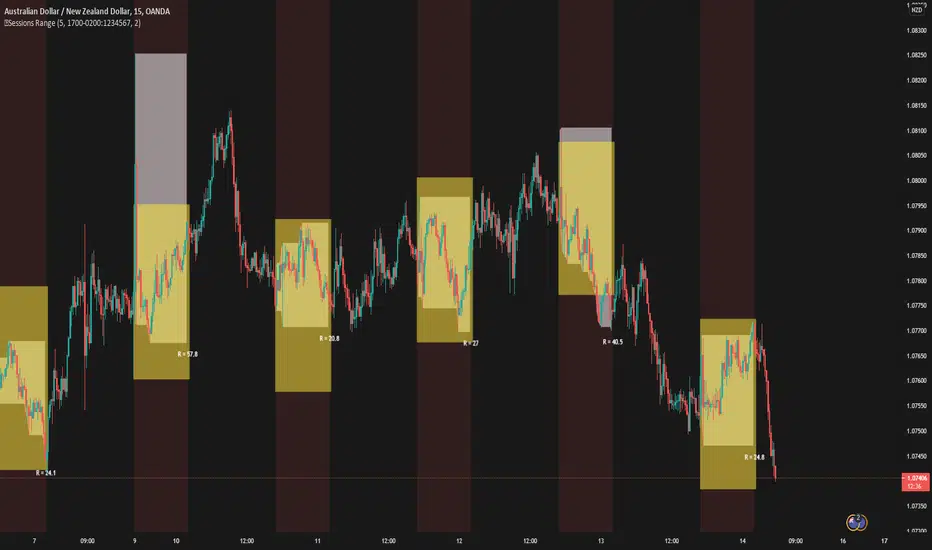
5 Sessions RangeThis script averages the range of the previous 5 sessions and displays it on the chart
The sessions are adjustable
Custom Colored Session (Pre, Open, Close, Post, Outside)Another script enabling coloring of sessions. Variables for all session timings and colors are exposed. Backgrounds and/or dividers can be enabled. If you only want dividers, just uncheck all of the background sections.
Note: Due to the way weekends are handled on some exchanges, displaying the divider on Friday is not possible.
Note: Displaying backgrounds or dividers in the future does not seem to be possible. I would gladly add this if I can figure it out.

OutsiderEdge - Adaptive Session Flow Engine🔹 OVERVIEW
The OutsiderEdge – Adaptive Session Flow Engine (ASFE) is a professional-grade session analysis tool that visualizes true session-based volume distribution, key auction nodes, and institutional interaction levels across Asia, London, and New York.
ASFE is designed to help traders understand where price actually traded, where it was accepted or rejected, and how liquidity reacts around session-defined control levels without repainting or hindsight bias.
🔹 FEATURES
Session Volume Profile Core
True session-anchored volume profiles (Asia / London / New York)
Independent profiles per session with automatic close handling
Configurable row resolution and value area coverage
Optional background session shading
Control Nodes (POC & POV)
Point of Control (POC): highest volume acceptance level
Point of Volume (POV): lowest volume / thin auction node inside value area
Displayed for both closed and developing sessions
Visual separation between acceptance and rejection zones
Adaptive Extension Logic
POC / POV levels extend forward until interaction
Two extension modes: Until Breach or Until N Retests
Non-repainting, bar-confirmed logic
Fully session-aware behavior
Retest Engine (NBE-Compatible)
Optional retest mode with configurable retest count
Retest logic based on clean approach + rejection
Supports final-retest-only signaling
Consistent behavior with OutsiderEdge NBE methodology
Session Filters & Trade Windows
Trade Inside / Skip Inside session logic
Independent control for Asia, London, and New York
Ensures signals only occur during intended trading windows
Visual Feedback & Labels
Directional breach labels (bullish / bearish)
Clear differentiation between POC and POV interactions
Optional body-based rejection filtering
Minimalist, chart-friendly visuals
🔹 ALERT SYSTEM
Breach Alerts
Alert on any POC or POV interaction
Directional alerts (Long / Short)
Separate alerts for POC and POV
Retest Alerts
Alerts on valid retests when retest mode is enabled
Optional final-retest-only signaling
Designed for automation and discretionary workflows
🔹 WHY ASFE?
Session-First Design
Levels are derived from session structure, not arbitrary lookbacks
Respects real market transitions between sessions
Auction Market Logic
POC = acceptance
POV = rejection / inefficiency
Helps distinguish continuation vs rotation environments
Built for Confluence
Works alongside price action, footprint, delta, and orderflow tools
Designed as a decision-support engine, not a signal spam indicator
🔹 WHO IS THIS FOR?
Discretionary Traders
Session-based traders
Liquidity and auction-theory traders
Index, FX, and futures traders
System & Automation Traders
Clear, deterministic alert conditions
Non-repainting logic
Suitable for strategy integration and execution layers
🔹 IMPORTANT NOTES
This indicator does NOT repaint
All signals are generated on confirmed bars
ASFE does NOT provide trade entries or exits by itself
Always combine with proper risk management and context
Trading involves substantial risk. This tool is for educational purposes only and is not financial advice. Past performance does not guarantee future results. You are solely responsible for your trading decisions and risk management.

SMC Sessions NYThis script plots vertical session markers on the chart to highlight session opens and closes based on New York time.
Key characteristics:
The indicator is plotted on the price chart (overlay).
It draws thin, dotted vertical lines at specific session times.
Sessions are calculated using the America/New_York timezone to ensure correct alignment.
Only weekdays (Monday to Friday) are considered.
The script draws sessions for today and up to one week back (maximum 7 calendar days).
All drawings are created once on the last bar to avoid duplicates and performance issues.
Each session has its own color for clear visual distinction:
Asia session (open)
London session (open and close)
New York / Kill Zone Morning (open and close)
Lunch session (open and close)
New York / Kill Zone Afternoon (open and close)
The Asia session open at 20:00 NY is intentionally excluded on Fridays, as there is no valid Asia session start on Friday evening.
The vertical lines extend across the entire visible price range of the chart.
The script is optimized to stay well within TradingView object limits.
Purpose:
The indicator is designed to give traders a clean, non-intrusive visual reference for key session transitions, helping to analyze price behavior around session opens and closes without cluttering the chart.
This approach is suitable for intraday and session-based trading models, including SMC-style workflows.

Apex Edge - London Open Session# Apex Edge - London Open Session Trading System
## Overview
The London Open Session indicator captures institutional price action during the first hour of the London forex session (8:00-9:00 AM GMT) and identifies high-probability breakout and retest opportunities. This system tracks the session's high/low range and generates precise entry signals when price breaks or retests these key institutional levels.
## Core Strategy
**Session Tracking**: Automatically identifies and marks the London Open session boundaries, creating a trading zone from the first hour's price range.
**Dual Entry Logic**:
- **Breakout Entries**: Triggers when price closes beyond the session high/low and continues in that direction
- **Retest Entries**: Activates when price returns to test the broken level as new support/resistance
**Performance Analytics**: Built-in win rate tracking displays real-time performance statistics over user-defined lookback periods, enabling data-driven optimization for each currency pair.
## Key Features
### Automated Zone Detection
- Precise London session timing with timezone offset controls
- Visual session boundaries with customizable colours
- Automatic high/low range calculation and display
### Smart Entry System
- Breakout confirmation requiring candle close beyond zone
- Retest detection with configurable pip distance tolerance
- Separate risk/reward ratios for breakout vs retest entries
- Visual entry arrows with clear trade direction labels
### Performance HUD
- Real-time win rate calculation over customizable periods (7-365 days)
- Total trades tracking with win/loss breakdown
- Average risk-reward ratio display
- Color-coded performance metrics (green >70%, yellow >50%, red <50%)
### PineConnector Integration
- Direct MT4/MT5 execution via PineConnector alerts
- Proper forex pip calculations for all currency pairs
- Customizable risk percentage per trade
- Symbol override capability for broker compatibility
- Automatic SL/TP level calculation in pips
## Critical Usage Requirements
### Pair-Specific Optimization
Each currency pair requires individual optimization due to varying volatility characteristics, institutional participation levels, and typical price ranges during London hours. The performance HUD is essential for identifying optimal settings before live trading.
**Recommended Testing Process**:
1. Apply indicator to desired currency pair and timeframe
2. Experiment with session timing - while 8:00-9:00 AM GMT is standard, some pairs may show improved performance with alternative hourly windows (e.g., 7:00-8:00 AM or 9:00-10:00 AM)
3. Adjust Stop Loss distances, Risk/Reward ratios, and Retest distances
4. Monitor win rate over 30+ day periods using the performance HUD
5. Only proceed with live alerts once consistent 60%+ win rates are achieved
6. Create separate optimized chart setups for each profitable pair/timeframe combination
### Timeframe Specifications
This indicator is specifically designed and tested for:
- **1-minute charts**: Optimal for capturing immediate institutional reactions
- **5-minute charts**: Balanced approach between noise reduction and opportunity frequency
Higher timeframes generally produce inferior results due to increased noise and reduced institutional edge during the London session window.
## Settings Configuration
### Session Timing
- **London Open/Close Hours**: Adjust for your chart's timezone
- **Rectangle End Time**: Set to 4:30 PM to stop signals before NY session close
- **Timezone Offset**: Ensure accurate London session capture
### Entry Parameters
- **Retest Distance**: 3-8 pips depending on pair volatility
- **Stop Loss Pips**: Separate settings for breakouts (10-15 pips) and retests (8-12 pips)
- **Risk/Reward Ratios**: Independent ratios for different entry types
### PineConnector Setup
- **License ID**: Your PineConnector license key
- **Symbol Override**: MT4/MT5 symbol names if different from TradingView
- **Risk Percentage**: Position size as percentage of account balance
- **Prefix/Comment**: Organize trades in terminal
## Manual Trading Limitations
Without PineConnector automation, traders face significant practical challenges:
**Settings Management**: Each currency pair requires different optimized parameters. Switching between charts means manually adjusting multiple settings each time, creating potential for errors and missed opportunities.
**Timing Sensitivity**: London Open signals can occur rapidly during high-volatility periods. Manual execution may result in slippage or missed entries.
**Multi-Pair Monitoring**: Tracking 4-11 currency pairs simultaneously while manually adjusting settings for each switch becomes impractical for most traders.
**Parameter Consistency**: Risk of using suboptimal settings when quickly switching between pairs, potentially compromising the careful optimization work.
## Recommended Workflow
1. **Historical Testing**: Use win rate HUD to identify profitable pairs and optimal parameters
2. **Demo Automation**: Test PineConnector alerts on demo accounts with optimized settings
3. **Live Implementation**: Deploy alerts only on proven profitable pair/timeframe combinations
4. **Ongoing Monitoring**: Regular review of performance metrics to maintain edge
## Risk Disclaimer
This indicator provides analysis tools and automation capabilities but does not guarantee profitable trading outcomes. Past performance does not predict future results. Users should thoroughly backtest and demo trade before risking live capital. The London session strategy works best during specific market conditions and may underperform during low volatility or unusual market environments.
## Support Requirements
Successful implementation requires:
- Basic understanding of London session market dynamics
- PineConnector subscription for automation features
- Patience for proper optimization process
- Realistic expectations about win rates and drawdown periods
This system is designed for serious traders willing to invest time in proper optimization and risk management rather than plug-and-play solutions.

Ultra SessionsThe "Ultra Sessions" indicator is designed to enhance your trading strategy by clearly marking key market sessions and their associated "kill zones" directly on your chart. This powerful tool supports multiple time zones and provides customizable alerts for session opens, closes, and critical kill zones, ensuring you never miss important market movements.
Customizable Time Zones: Align the indicator with your local time by selecting from a wide range of global time zones.
Market Session Tracking: Visually track the New York, London, and Tokyo trading sessions with distinct color-coded markers.
Kill Zones: Highlight the high-volatility periods within each session to focus on key trading opportunities.
Alert System: Receive real-time alerts for session openings, closings, and kill zones, so you stay informed without constantly monitoring the chart.
Flexible Positioning: Choose the positioning of session markers to fit your chart layout, whether at the top or bottom.
Ideal for traders who want to optimize their entry and exit points by focusing on the most active and volatile times in the market, the indicator is a must-have for any serious trading setup.

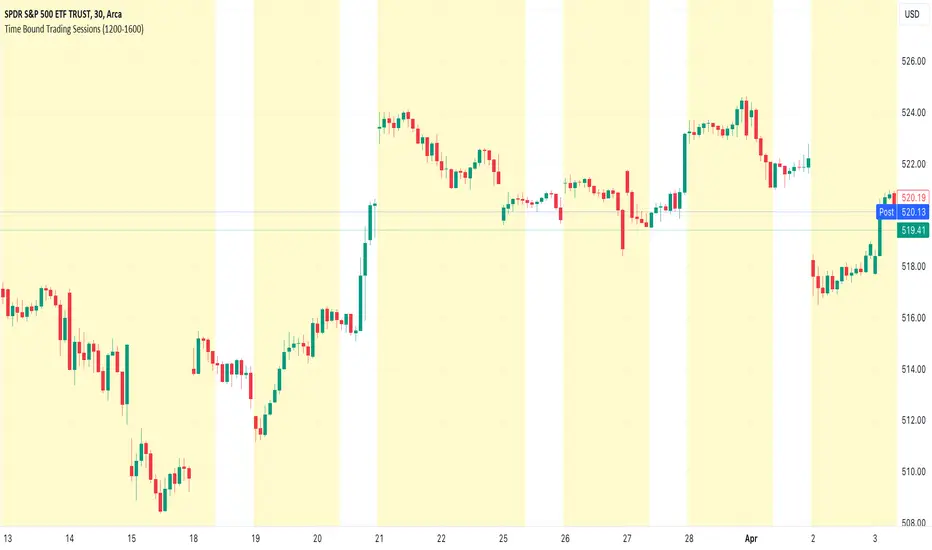
Time Bound Trading SessionsTime Bound Trading Sessions allows to add time bound conditions to your trading sessions given a date range , a time range and/or days of the week .
This indicator can be very handy if you want to control your trading sessions along those three time boundaries, applying them together and/or separately.
Feel free to reuse this code in your own strategy, and leverage the inSession condition as needed.
Features
+ It allows for date range start and/or end to be set.
+ It allows for session time range to be set.
+ It allows for days of the week to be set.
+ It applies chart background color if we are not within the given time bound session parameters.
+ It includes turn on/off functionality.
Settings
Date Range
+ {Start} checkbox: turns on/off start date
+ {Start} date/time
+ {End} checkbox: turns on/off end date
+ {End} date/time
Time Range
+ {Session} checkbox: turns on/off session time range
+ {Session} time range
Days
+ {M} checkbox: turns on/off Mondays
+ {T} checkbox: turns on/off Tuesdays
+ {W} checkbox: turns on/off Wednesdays
+ {T} checkbox: turns on/off Thursdays
+ {F} checkbox: turns on/off Fridays
+ {S} checkbox: turns on/off Saturdays
+ {S} checkbox: turns on/off Sundays
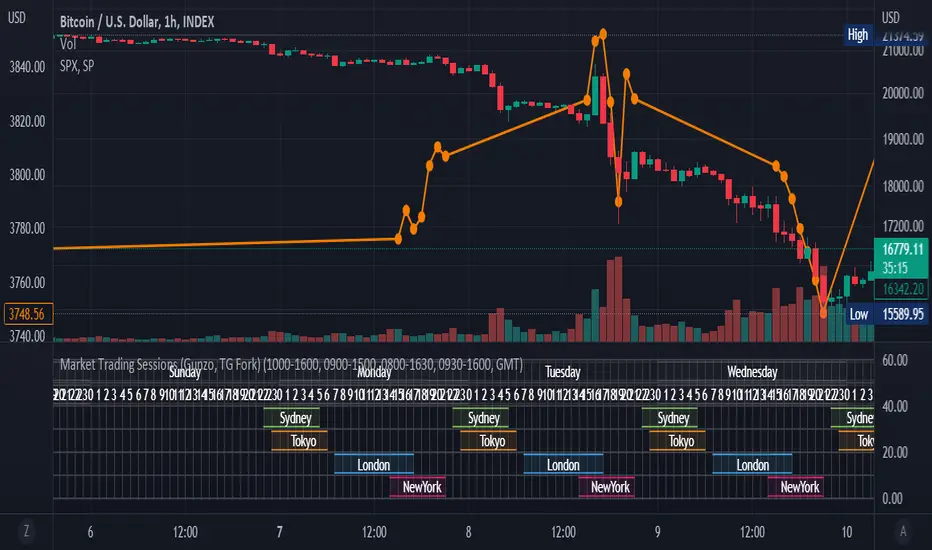
Market Trading Sessions (TG Fork)Visualize trading sessions opening hours of several international exchanges on a grid. Contrary to other indicators, this one automatically aligns the session with the current chart's timezone.
This is helpful for bar replay or manual backtesting, to spot patterns of correlations (this can also be used in conjunction with correlation indicators, see my other indicators).
Original indicator by Gunzo, if you like this indicator, please show the original author some love:
This indicator is also inspired by the following indicators:
ZenAndTheArtOfTrading with
UnknownUnicorn468659 with
This fork implements the following features:
Converted to PineScript v5.
Adapted default color palette to dark mode, as is the default in TradingView now.
Fix drawing issues, now the design shows as it was originally meant to be.
Fixed mistiming issue that made some sessions display with a delay compared to the real session, especially the first session was bar at the start of the session was not displayed.
Inputted the accurate timings for each session, instead of the default 0800-1600 in the original indicator.
Essentially, you can just add this indicator and it should work out of the box. If not, please let me know, and I'll try to fix it!
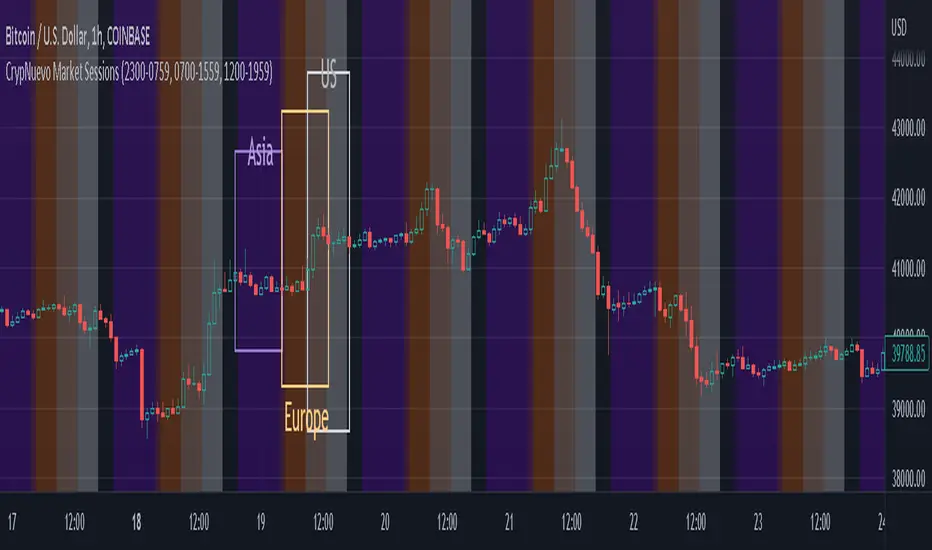
CrypNuevo Market SessionsExperimental script showing a different background color per market session. The session hours and colors can be customized. Note that the session hours can overlap.
Based on a thread by CrypNuevo on Twitter.
Futures Exchange Sessions 2.0Description
Successor to Futures Exchange Sessions indicator. Completely rebuilt code from the ground up. Every feature has been redesigned and refactored to be the most beneficial while allowing for complete configuration by the user.
This indicator displays Futures Sessions as live boxes that expand dynamically as price moves over the time interval. These boxes make liquidity levels extremely easy to spot and visualize. It helps the user identify market structure and develop their own bias of price action. Everything about the Session boxes can be configured. Box color, border color, border style, and border width are all individually controllable. Each Future Session can be turned on or off at any time. Also, each box has their own text label (Asian Session, London Session, New York Session) and this text can be moved around the box, change color, and change size.
Previous days highs and lows (major liquidity levels) are always important to the futures trader. This indicator now allows the user to individually display the three previous days highs and low levels as lines with optional label. Each line can be independently toggled on or off and like always, every conceivable customization option is available to the user. And the labels can be moved to the right (via the Input Settings) to allow unobstructed views of candles.
The midnight EST open and 8:30 AM EST open horizontal lines (developed by the Inner Circle Trader) are returning in this indicator. But the biggest improvement is that the lines stop at the current bar or the last bar of the trading day. Additionally, the time lines are displayed on previous days so the user can easily see how the candles reacted to these important times of the day.
The Session boxes and the horizontal time lines now can be set to only display a certain number of day back. If the user wants just to see Session boxes for the previous day only, they can do that. If the user wants to see the last 15 days of boxes or lines it is very easy to increase the days back in the settings. Currently, the max days back is 80 calendar days.
Additional Images
Easily visualize and understand price action across time
Everything is customizable so the user can easily match this indicator to their color preferences
Special Notes
To turn off box session text set opacity to 0%
Boxes and horizontal time lines only display when timeframe is <= 30 minute

[DisDev] 12 Candle|Round#|Future SessionsThis indicator has many components; below, each component is explained and how it can be used as a trading tool.
1) Future Lines
a. Vertical lines are projected into the future to mark the beginning of each of the three major markets, Tokyo, London, and New York.
b. When major markets open, this can cause an increase in price action. So this component provides the trader with a reminder of when the next major market opens.
c. Also, the days of the week are displayed to allow the user to backtest price reaction for certain days of the week easily (e.g., Major Markets reopening after the weekend).
2) 12 Hour Candle Sessions High and Low
a. As price intersects with the beginning of the session, the vertical line disappears, and two corresponding horizontal lines begin. These horizontal lines dynamically adjust to mark each session's high and low, and a semi-transparent box fills the space between the high and low lines.
b. The duration of each session is a three-hour window, which each consists of 12 Fifteen-Minute Candles. This marks the hour prior to equity markets open, the opening hour, and the post-open hour.
c. The sessions highs and lows can be selected within the settings show for a 24 hour period. This assists the trader with session range breakouts; three examples of how this could be traded are below.
Example 1
d. The Tokyo and London session high kept the price action within a range. Once it broke the range, the Tokyo and London session highs were used as support, resulting in a range breakout.
Example 2
e. The below picture shows price action failing to break London Session Low and New York Session High; this is followed by Tokyo Low acting as resistance and price moving down 9%.
Example 3
f. Below price action with an increased volume of 323% (based on the average of the last 10 bar) fails to break the Tokyo High on the 1st attempt. The second attempt fails on 241% volume. The third attempt at 475% breaks the range, completing the range breakout seeing a move of 3.4% in price.
4) High of Day (HOD) and Low of Day (LOD)
a. As the trading day unfolds, we mark the HOD (d-High) and LOD (d-Low) with blue dotted horizontal lines. Then at the start of the next trading day, the former High and Low become the Previous Day High (pd-High) and Low (pd-Low) and are changed to dashes.
b. These high and low levels add extra confluence with the session high and lows for Swing Failure Patterns (SFP) and confirmation of trends.
5) Round Numbers
a. As humans, it's hard to use just any number to make sense of things. We prefer to use round numbers. This is important for trading as many traders will automatically use round numbers as their stop losses.
b. This indicator component reminds users of this fact and displays round numbers such as 00, 25, 50, and 75. The indicator automatically calculates and displays lines for the round numbers for as many as twelve levels above and below the current price.
c. Below are examples of how round numbers are broken to trigger stop losses; you may want to break the habit of using round numbers as your stop losses.
Below is the indicator in full swing, displaying all the elements described above.

Background to highlight cash/session range [Futures]A simple script which allows the user to highlight the background of a certain session. At the moment there is only one session available, I will work on multiple highlights for numerous sessions at a later date.

G Trade SessionsWe built this indicator because we was tired of guessing when major markets open and close. It draws simple boxes around each trading session so you can instantly see where the action is.
What it does:
Shows you the four key sessions — Asia, Frankfurt, London, and New York — as transparent boxes right on your chart. Each box marks the high and low of that session, which is super useful for spotting support/resistance levels.
Why I like it:
No clutter — boxes are subtle and don't get in the way
Labels switch from black to white automatically depending on your chart theme (dark or light)
Sessions don't overlap, so the chart stays clean
You can turn off any session you don't care about
Hope you find it useful!

Simple Trading SessionsThis indicator highlights the major global trading sessions (Tokyo, London, and New York) directly on your chart with clean background shading.
Tokyo Session (default 00:00–09:00 exchange time)
London Session (default 07:00–16:00 exchange time)
New York Session (default 12:30–21:00 exchange time)
Each session is displayed as a different shaded block, making it easy to:
Spot when the market is most active.
Identify overlapping periods (e.g., London–New York overlap).
Backtest strategies that depend on session timing.
⚙️ How to Use
Add the indicator to any intraday chart.
Adjust session times in the settings panel to match your broker or preferred timezone.
Use the shading to guide your trading around regional liquidity zones.
✅ Notes
By default, session times follow the chart’s exchange timezone.
You can change the inputs to match your own session definitions.
Very lightweight and designed for traders who want a simple, uncluttered session map without extra calculations.

Forex Sessions(IST)📌 Forex Sessions (IST Version)
This indicator highlights the four major Forex market sessions — Asia, Frankfurt, London, and New York — automatically adjusted to Indian Standard Time (IST).
Session Timings in IST:
Asia: 02:30 – 10:30
🇩🇪 Frankfurt: 11:30 – 12:30
🇬🇧 London: 12:30 – 21:30
🇺🇸 New York: 17:30 – 02:30 (next day)
Trading Advantages:
Asia session → Spot the range high/low
Frankfurt → Detect inducement moves
London → Identify the main push/trend move
New York → Catch reversals & profit taking
Features:
Clean session highlights with custom colors
Optional tools: range, trendlines, mean, VWAP, max/min levels
Adjustable transparency and display settings
With this, you can easily track session overlaps, volatility shifts, and trade setups — all aligned with IST Forex timings.
[TTM] ICT Sessions & Ranges🌟 Overview 🌟
The ICT Sessions & Ranges Indicator helps traders identify key intraday price levels by marking custom session highs/lows and opening ranges.
It helps traders spot potential liquidity grabs, reversals, and breakout zones by tracking price behavior around these key areas
🌟 Session Highs & Lows – Liquidity Zones 🌟
Session highs and lows often attract price due to stop orders resting above or below them. These levels are frequently targeted during high-volatility moves.
🔹 Asia Session
- Usually ranges in low volatility.
- Highs/lows often get swept during early London.
- Price may raid these levels, then reverse.
🔹 London Session
- First major volatility of the day.
- Highs/lows often tested or swept in New York.
- Commonly forms the day’s true high or low.
🌟 Opening Range Concepts 🌟
The Opening Range is the first 15, 30, or 60 minutes of a session (e.g., New York).
The high (ORH) and low (ORL) define the market’s initial balance and key reaction levels.
🔹 Breakout Trade
- Price breaks ORH/ORL with momentum.
- Signals directional intent.
- Traders enter on the breakout, with stops inside the range.
🔹 Liquidity Raid
- Price briefly breaks ORH/ORL to trigger stops.
- Reverses after the sweep.
- Look for structure shift and entry near FVG or OB.
🌟 Customizable Settings 🌟
The indicator includes 3 configurable ranges , each with:
Start & End Time – Set any custom time window.
Display Type – Choose Box (highlight range) or Lines (mark high/low).
Color Settings – Set custom colors for boxes and lines.
🌟 Default Settings 🌟
Range 1 : 19:00–00:00 (Asia Session)
Range 2 : 01:45–05:15 (London Session)
Range 3 : 09:30–10:00 (NY Opening Range – 30m)

Market Session Times by MadDogMoneyMarket Sessions is a simple indicator allowing you to quickly see the 3 Major Trading Session Open and Close times
Three major Sessions - Asia, UK & NY are included.
(The Australian & Asian markets are so close on time, they have been joined for brevity.)
The Open & Close times for each Session is displayed in the Settings in UTC and can be edited depending on the time of year or market you are following.
By setting the Session indicators partially transparent (as is by default), you can quickly see which Market Sessions, and for how long, they overlap.
Additionally, the Indicator can be hidden for different timeframes.
- 1 HR is the upper limit of visibility
- Visibility on the 1HR, 15min and 5min and below can be toggled on an off to fit your requirements.
