Session Markers - JDK AnalysisSession Markers is a tool designed to study how markets behave during specific, recurring time windows. Many traders know that price behaves differently depending on the day of the week, the time of the day, or particular market sessions such as the weekly open, the London session, or the New York open. This indicator makes those recurring windows visible on the chart and then analyzes what price typically does inside them. The result is a clear statistical understanding of how a chosen session behaves, both in direction and in strength.
The script works by allowing the trader to define any time window using a start day and time and an end day and time. Every time this window occurs on the chart, the indicator highlights it with a full-height vertical band. These visual markers reveal patterns that are otherwise difficult to detect manually, such as whether certain sessions tend to trend, reverse, consolidate, or create large imbalances. They also help the trader quickly scan through historical price action to see how the market has behaved under similar conditions.
For every completed session window, the indicator measures how much price changed from the moment the window began to the moment it ended. Instead of using raw price differences, it converts these changes into percentage moves. This makes the measurement consistent across different price ranges and market regimes. A one-percent move always has the same meaning, whether the asset is trading at 100 or 50,000. These percentage moves are collected for a user-selected number of past sessions, creating a dataset of how the market has behaved in the chosen time window.
Based on this dataset, the indicator generates several statistics. It counts how many past sessions closed higher and how many closed lower, producing a directional tendency. It also computes the probability of an upward session by dividing the number of positive sessions by the total. More importantly, it calculates the average percentage movement for all sessions in the lookback period. This average move reflects not just the direction but also the magnitude of price changes. A session with frequent small upward moves but occasional large downward moves will show a negative average movement, even if more sessions ended positive. This creates a more realistic representation of true market behavior.
Using this average movement, the script determines a “Bias” for the session. If the average percentage move is positive, the bias is considered bullish. If it is negative, the bias is bearish. If the values are very close to zero, the bias is neutral. This way, the indicator takes both frequency and impact into account, producing a magnitude-aware assessment instead of one that only counts wins and losses. A sequence such as +5%, –1% results in a bullish bias because the overall impact is strongly positive. On the other hand, a series of small gains followed by a large drop produces a bearish bias even if more sessions ended positive, because the large move dominates the average. This provides a far more truthful picture of what the market tends to do during the chosen window.
All relevant statistics are displayed neatly in a small panel in the top-right corner of the chart. The panel updates in real time as new sessions complete and older ones fall out of the lookback range. It shows how many sessions were analyzed, how many ended up or down, the probability of an upward move, the average percentage change, and the final bias. The background color of the panel instantly reflects that bias, making it easy to interpret at a glance.
To use the tool effectively, the trader simply needs to define a time window of interest. This could be something like the weekly opening window from Sunday to Monday, the London open each day, or even a unique custom window. After selecting how many past sessions to analyze, the indicator takes care of the rest. The vertical session markers reveal the structure visually. The statistics summarize the historical behavior objectively. The magnitude-weighted bias provides a realistic indication of whether the window tends to produce upward or downward movement on average.
Session Markers is helpful because it translates repeated market timing behavior into measurable data. It exposes hidden tendencies that are easy to feel intuitively but hard to quantify manually. By analyzing both direction and magnitude, it prevents misleading interpretations that can arise from looking only at win rates. It helps traders understand whether a session typically produces meaningful moves or just small noise, whether it tends to trend or reverse, and whether its behavior has recently changed. Whether used for bias building, session filtering, or deeper market research, it offers a structured framework for understanding the market through time-based patterns.
Cari dalam skrip untuk "session"

Session Range Boxes GR v2.1This indicator draws intraday range boxes for the main Forex sessions based on Europe/Budapest time (CET/CEST).
Tracked sessions (Budapest time):
Asia: 01:00 – 08:00
Frankfurt (pre-London): 08:00 – 09:00
London: 09:00 – 18:00
New York: 14:30 – 23:00
For each session, the script:
Detects the session start and session end using the current chart timeframe and the Europe/Budapest time zone.
Tracks the high and low of price during the session.
Draws a colored box from session open to session close, covering the full price range between the session high and low.
Draws a white midline inside every box at the midpoint between the session high and low (and keeps it visible for all past sessions).
Optionally plots a small label (“Asia”, “Fra”, “London”, “NY”) above the first bar of each session.
Color scheme:
Asia: soft orange box
Frankfurt: light aqua box
London: darker blue box
New York: light lime box
Use this tool to:
Quickly see which session created the high or low of the day,
Highlight important liquidity zones and prior session ranges that price may revisit,
Visually separate Asia, Frankfurt, London and New York volatility profiles on intraday charts.
Optimized for intraday trading (Forex / indices), but it works on any symbol where session behavior and time-of-day structure matter.

Session ParmezanForex Session Range Boxes (Asia, Europe, US) — visual intraday session tracker for Forex and metals.
This indicator automatically marks the three major Forex trading sessions — Asian (Tokyo), European (London), and American (New York) — directly on your chart using dynamic colored boxes.
Each box represents the full price range (High–Low) formed during that session, helping traders visualize how volatility and liquidity evolve across the global trading day.
The script is built for intraday traders and session-based strategies, especially those who monitor breakouts from the Asian range or reactions during London–New York overlaps.
⚙️ Features
• Accurate session timing (UTC+3 / Moscow Time) — Asia: 03:00–12:00, Europe: 11:00–20:00, US: 16:00–01:00.
• Dynamic range boxes: each box expands in real time as new highs and lows are set during the session.
• Clear visual separation: each session is shown in its own color (blue for Asia, orange for Europe, green for US).
• Automatic daily reset — new boxes start every new session.
• Intraday focus only — visible up to the 1-hour timeframe (M1–H1) for clarity.
• Transparent design — semi-transparent fills keep candles readable even when sessions overlap.
• Lightweight performance — optimized use of box.new() and var variables avoids lag on lower timeframes.
🧭 Typical Use-Cases
• Identify Asian session ranges and watch for London breakouts or New York reversals.
• Visually align your intraday strategy with session volatility cycles.
• Combine with VWAP, liquidity zones, or market profile indicators for deeper confluence.
• Spot overlapping sessions — often the most active periods of the day.

Session Range Control [PointAlgo]Session Range Control (SRC)
The Session Range Control (SRC) indicator provides a structured view of intraday price behavior by tracking where the current price sits within the session’s high–low range and how today’s volatility compares to the Average Daily Range (ADR). It combines range analytics, momentum context, volatility interpretation, and visual cues to help traders understand session strength and shifts in intraday conditions.
Core Concept
Every trading session forms a unique high and low. SRC continuously reads these values and calculates the Position in Range, expressed on a scale from 0% to 100%:
0% → Price at Day Low
100% → Price at Day High
50% → Mid-range equilibrium
By normalizing price into a percentage, traders can quickly interpret where market pressure is concentrated during the session.
Trend Zones and Market State
SRC divides the range into logical zones to show the likely sentiment of the session:
1. Strong Uptrend Zone (Above Threshold)
When price consistently holds above the user-defined upper threshold (e.g., 60%), the indicator marks a Strong Uptrend.
This typically reflects:
Persistent intraday buying pressure
Price acceptance near the upper part of the range
Reduced likelihood of deep pullbacks
2. Strong Downtrend Zone (Below Threshold)
When price remains below the lower threshold (e.g., 40%), SRC signals a Strong Downtrend, indicating:
Dominant intraday selling
Consistent pressure keeping price near session lows
3. Bullish / Bearish Zones
Between the midline and strong thresholds, SRC displays softer trend zones:
Above 50% = Bullish Zone
Below 50% = Bearish Zone
These zones help classify whether price is trending, balanced, or drifting.
4. Neutral Territory
When price hovers around the mid-level without conviction, the indicator treats it as a neutral or undecided phase.
Signal Logic :
SRC includes built-in momentum shift signals based on range transitions:
Long Signal
Triggered when price crosses upward through 50%, often showing:
A shift from intraday weakness to strength
Buyers gaining control of the session
Short Signal
Triggered when price crosses downward through 50%, suggesting:
Loss of intraday strength
Sellers taking control
These signals help highlight potential turning points inside the session.
Extreme Levels :
SRC highlights the top and bottom 10% of the range:
> 90% = Extreme High (Overbought intraday condition)
< 10% = Extreme Low (Oversold intraday condition)
These conditions can be useful for identifying overextended movements or potential reaction zones.
ADR Comparison and Volatility Context :
The indicator also measures how today’s price range compares to the Average Daily Range (ADR):
Range Expanding: Today’s range is significantly larger than the ADR
Indicates heightened volatility
Often associated with trending or breakout environments
Range Compressing: Today’s range is much smaller
Suggests low volatility
Common before breakout phases
Characteristic of consolidation or balanced markets
This volatility context helps traders assess whether the session is behaving within normal boundaries or deviating significantly.
Dashboard Overview :
When enabled, the dashboard summarizes key intraday metrics in a structured table:
Trend status (Strong Uptrend, Strong Downtrend, Bullish, Bearish, Neutral)
Range position (%)
Signal status (Long Cross, Short Cross, Extreme High/Low, or None)
Day range calculation
Range vs ADR (%)
Day High / Day Low
Current price level
Simplified action label based on current conditions
This provides a quick reference system to interpret both trend and volatility at a glance without analyzing the full chart visually.
Visual Elements
SRC includes:
Colored dynamic plot for easy trend recognition
Horizontal reference lines at key levels (0%, 50%, 100%, strong-trend thresholds)
Background shading during extreme zone conditions
A separate ADR comparison plot
These visuals ensure the indicator remains intuitive regardless of chart style or timeframe.
Alerts
The script includes alert conditions for:
Long cross
Short cross
Strong trend detection
Extreme high / extreme low
These allow users to automate notifications during key market events without manually monitoring the chart.
Customization Options
Users can configure:
ADR length
Strong trend thresholds
Dashboard visibility
Dashboard position on chart
This makes SRC adaptable to different trading instruments and intraday styles.
Usage Notes
Works best on intraday timeframes where session boundaries are clearly defined.
Designed for analytical interpretation—trend bias, volatility phase, and range structure.
Can complement other tools such as moving averages, volume, or market structure analysis.
Disclaimer :
This indicator is intended for chart analysis and educational purposes only.
It does not generate financial, investment, or trading advice.
Users should validate signals with additional research and apply proper risk management.

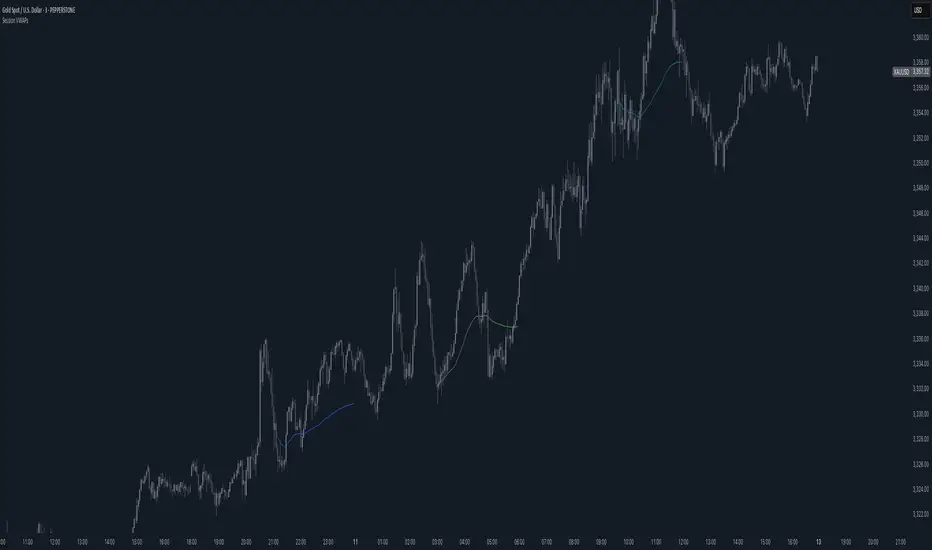
Session VWAPsThis indicator plots volume-weighted average price (VWAP) lines for three major trading sessions: Tokyo, London, and New York. Each VWAP resets at the start of its session and tracks the average price weighted by volume during that window. You can choose the exact session times, turn individual sessions on or off, and optionally extend each VWAP line until the end of the trading day.
It’s designed to give you a clear view of how price is behaving relative to session-specific value areas. This can help in identifying session overlaps, shifts in price control, or whether price is holding above or below a particular session’s average. The indicator supports futures-style day rollovers and works across markets.
Session Levels by EV EV Session Levels highlights the most important price levels of the main trading sessions in a clear and non-repainting way.
The indicator identifies the High, Low, and 50% equilibrium level of the Asian, London, and New York sessions, helping traders understand where price has previously found balance or liquidity.
Each session is visualized with a subtle range box showing the full price movement during that session.
Session Highs and Lows are extended into future sessions and automatically stop extending once price touches them, keeping the chart clean and relevant.
Only the most recent sessions are displayed to avoid clutter, making this tool especially useful for learning session structure, intraday context, and level interaction without overwhelming the chart.

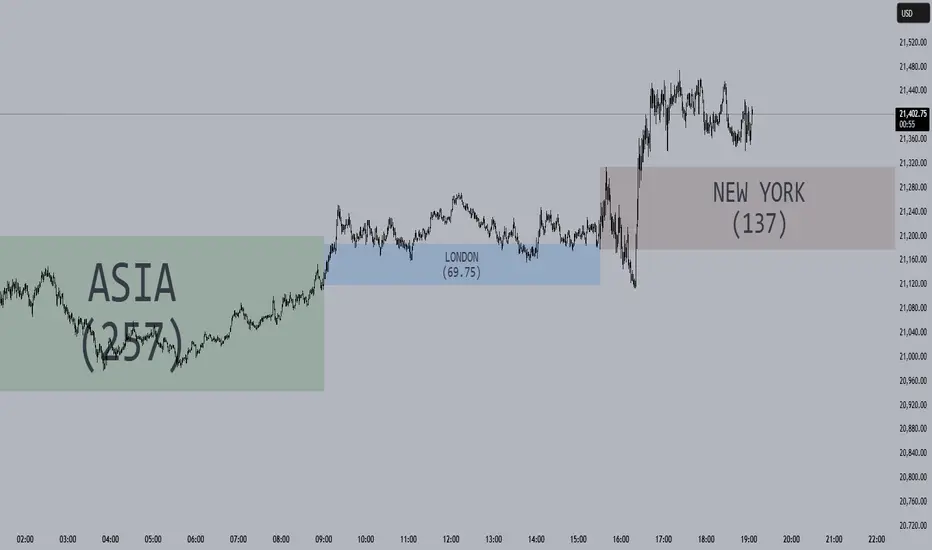
Session Relative VolumeSession Relative Volume is an advanced intraday futures volume indicator that analyzes volume separately for Asia, London, and New York sessions - something standard relative volume tools can’t do.
Instead of aggregating the entire day’s volume, the indicator compares current volume to historical averages for the same session and time of day, allowing you to spot true volume strength and meaningful spikes, especially around session opens.
Background
Relative volume helps traders spot unusual activity: high volume often signals institutional participation and trending days, while low volume suggests weak commitment and possible mean reversion. In futures markets, sessions ( Asia, London, New York ) must be analyzed separately, but TradingView’s Relative Volume in Time aggregates the entire day, masking session-specific behavior - especially during the New York open. Since volume can vary by more than 20× between sessions, standard averages struggle to identify meaningful volume spikes when trader conviction matters most.
Indicator Description
The “Session Relative Volume” indicator solves these problems by calculating historical average volume specific to each session and time of day, and comparing current volume against those benchmarks. It offers four display modes and fully customizable session times
Altogether, it provides traders with a powerful tool for analyzing intraday futures volume, helping to better assess market participation, trader conviction, and overall market conditions - ultimately supporting improved trading decisions.
Parameters
Mode – display mode:
R-VOL: Relative cumulative session-specific volume at time
VOL CUM: Cumulative session volume at time compared to historical average cumulative session-specific volume
VOL AVG: Average session intrabar volume at time compared to historical average session-specific intrabar volume
VOL: Individual bars volume, highlighting (solid color) unusual spikes
Lookback period – number of days used for calculating historical average session volume at time
MA Len – length of the moving average, representing average bar volume within a session based on previous periods (different from historical cumulative volume!). Used only in VOL and VOL AVG modes
MA Thresh – deviation from moving average, used to detect bar volume spikes (bar volume > K × moving average)
Start Time – End Time and Time Zone parameters for each session. The time zone must be set using TradingView’s format (e.g., GMT+1).

Session Gap Fill [LuxAlgo]The Session Gap Fill tool detects and highlights filled and unfilled price gaps between regular sessions. It features a dashboard with key statistics about the detected gaps.
The tool is highly customizable, allowing users to filter by different types of gaps and customize how they are displayed on the chart.
🔶 USAGE
By default, the tool detects all price gaps between sessions. A price gap is defined as a difference between the opening price of one session and the closing price of the previous session. In this case, the tool uses the opening price of the first bar of the session against the closing price of the previous bar.
A bullish gap is detected when the session open price is higher than the last close, and a bearish gap is detected when the session open price is lower than the last close.
Gaps represent a change in market sentiment, a difference in what market participants think between the close of one trading session and the open of the next.
What is useful to traders is not the gap itself, but how the market reacts to it.
Unfilled gaps occur when prices do not return to the previous session's closing price.
Filled gaps occur when prices come back to the previous session's close price.
By analyzing how markets react to gaps, traders can understand market sentiment, whether different prices are accepted or rejected, and take advantage of this information to position themselves in favor of bullish or bearish market sentiment.
Next, we will cover the Gap Type Filter and Statistics Dashboard.
🔹 Gap Type Filter
Traders can choose from three options: display all gaps, display only overlapping gaps, or display only non-overlapping gaps. All gaps are displayed by default.
An overlapping gap is defined when the first bar of the session has any price in common with the previous bar. No overlapping gap is defined when the two bars do not share any price levels.
As we will see in the next section, there are clear differences in market behavior around these types of gaps.
🔹 Statistics Dashboard
The Statistics Dashboard displays key metrics that help traders understand market behavior around each type of gap.
Gaps: The percentage of bullish and bearish gaps.
Filled: The percentage of filled bullish and bearish gaps.
Reversed: The percentage of filled gaps that move in favor of the gap
Bars Avg.: The average number of bars for a gap to be filled.
Now, let's analyze the chart on the left of the image to understand those stats. These are the stats for all gaps, both overlapping and non-overlapping.
Of the total, bullish gaps represent 55%, and bearish ones represent 44%. The gap bias is pretty balanced in this market.
The second statistic, Filled, shows that 63% of gaps are filled, both bullish and bearish. Therefore, there is a higher probability that a gap will be filled than not.
The third statistic is reversed. This is the percentage of filled gaps where prices move in favor of the gap. This applies to filled bullish gaps when the close of the session is above the open, and to filled bearish gaps when the close of the session is below the open. In other words, first there is a gap, then it fills, and finally it reverses. As we can see in the chart, this only happens 35% of the time for bullish gaps and 29% of the time for bearish gaps.
The last statistic is Bars Avg., which is the average number of bars for a gap to be filled. On average, it takes between one and two bars for both bullish and bearish gaps. On average, gaps fill quickly.
As we can see on the chart, selecting different types of gaps yields different statistics and market behavior. For example, overlapping gaps have a greater than 90% chance of being filled, whereas non-overlapping gaps have a less than 40% chance.
🔶 SETTINGS
Gap Type: Select the type of gap to display.
🔹 Dashboard
Dashboard: Enable or disable the dashboard.
Position: Select the location of the dashboard.
Size: Select the dashboard size.
🔹 Style
Filled Bullish Gap: Enable or disable this gap and choose the color.
Filled Bearish Gap: Enable or disable this gap and choose the color.
Unfilled Gap: Enable or disable this gap and choose the color.
Max Deviation Level: Enable or disable this level and choose the color.
Open Price Level: Enable or disable this level and choose the color.

Session Profile AnalyzerWhat’s This Thing Do?
Hey there, trader! Meet the Session Profile Analyzer (SPA) your new go-to pal for breaking down market action within your favorite trading sessions. It’s an overlay indicator that mixes Rotation Factor (RF), Average Subperiod Range (ASPR), Volume Value Area Range (VOLVAR), and TPO Value Area Range (TPOVAR) into one tidy little toolkit. Think of it as your market vibe checker momentum, volatility, and key levels, all served up with a grin.
The Cool Stuff It Does:
Rotation Factor (RF) : Keeps tabs on whether the market’s feeling bullish, bearish, or just chilling. It’s like a mood ring for price action shows “UP ↑,” “DOWN ↓,” or “NONE ↔.”
ASPR : Averages out the range of your chosen blocks. Big swings? Tiny wiggles? This tells you the session’s energy level.
VOLVAR : Dives into volume to find where the action’s at, with a smart twist it adjusts price levels based on the session’s size and tiny timeframe moves (capped at 128 so your chart doesn’t cry).
TPOVAR : Grabs lower timeframe data to spot where price hung out the most, TPO-style. Value zones, anyone?
Dynamic Precision : No ugly decimal overload SPA matches your asset’s style (2 decimals for BTC, 5 for TRX, you get it).
How to Play With It:
Session Start/End : Pick your trading window (say, 0930-2200) and a timezone (America/New_York, or wherever you’re at).
Block Size : Set the chunk size for RF and ASPR like 30M if you’re into half-hour vibes.
Value Area Timeframe : Go micro with something like 1S for VOLVAR and TPOVAR precision.
Label : Size it (small to huge), color it (white, neon pink, whatever), and slap it where you want (start, mid, end).
How It All Works (No PhD Required):
RF : Imagine breaking your session into blocks (via Block Size). For each block, SPA checks if the high beats the last high (+1) or not (0), and if the low dips below the last low (-1) or not (0). Add those up, and boom positive RF means upward vibes, negative means downward, near zero is “meh.” Use it to catch trends or spot when the market’s napping.
ASPR : Takes those same blocks, measures high-to-low range each time, and averages them. It’s your volatility pulse big ASPR = wild ride, small ASPR = snooze fest. Great for sizing up session action.
VOLVAR : Here’s the fun part. It takes the session’s full range (high minus low), divides it by the average range of your tiny Value Area Timeframe bars (e.g., 1S), and picks a sensible number of price levels capped at 128 so it doesn’t overthink. Then it bins volume into those levels, finds the busiest price (POC), and grows a 70% value area around it. Perfect for spotting where the big players parked their cash.
TPOVAR : Grabs midpoints from those tiny timeframe bars, sorts them, and snips off the top and bottom 15% to find the 70% “value zone” where price chilled the most. Think of it as the market’s comfort zone great for support/resistance hunting.
Why You’ll Like It:
Whether you’re scalping crypto, swinging forex, or dissecting stocks, SPA’s got your back. Use RF to catch momentum shifts like jumping on an “UP ↑” trend or fading a “DOWN ↓” exhaustion. ASPR’s your secret weapon for sizing up trades: a big ASPR (say, 100 on BTC) means you can aim for juicy targets (like 1-2x ASPR) or set invalidations tight when it’s tiny (e.g., 0.001 on TRX) to dodge chop. VOLVAR and TPOVAR are your level-finders nail those key zones where price loves to bounce or break, perfect for entries, stops, or profit grabs. It’s like having a trading co-pilot who’s chill but knows their stuff.
Heads-Up:
Load enough history for those micro timeframes to shine (1S needs some bars to work with).
Keeps things light won’t bog down your chart even with decent-sized sessions.
Let’s Roll:
Slap SPA on your chart, tweak it to your style, and watch it spill the beans on your session. Happy trading, fam may your pips be plenty and your losses few!

SessionVWAP + ORBThis TradingView Pine Script indicator combines two powerful intraday tools:
Multiple Rolling VWAPs: It plots up to four independent rolling (continuous) Volume Weighted Average Prices (VWAPs) with user-defined periods (e.g., 1-hour, 2-hour, 4-hour, daily). These are "anchored" to a customizable session start time and roll forward accurately without daily resets, providing dynamic fair-value benchmarks that react at different speeds (fastest/shortest on top).
Opening Range Breakout (ORB) Zones: It displays the high/low range (with optional background shading and lines) for major global trading sessions — Sydney, Tokyo, London, New York, and US RTH (Regular Trading Hours, starting at 9:30 ET) — over the first configurable minutes (default 30) after each session open, with history for several prior days.
The latest version adds full timezone flexibility (e.g., Chicago, New York, UTC, London, Tokyo, Sydney), automatically adjusting anchor times and session opens.
Use Case
This script is ideal for intraday and day traders (especially in stocks, futures, forex, or indices) seeking confluence between volume-based value areas and session momentum.
VWAP Component: Use the layered rolling VWAPs as dynamic support/resistance. Price above the fastest VWAPs suggests bullish bias; pullbacks to slower VWAPs offer mean-reversion entries. The multi-timeframe view helps gauge short-term vs. longer-term "fair value."
ORB Component: Trade breakouts from major session opening ranges — e.g., buy above the New York ORB high (red line) for momentum longs, or fade failures for reversals. Combine with VWAP (e.g., only take NY ORB longs if price is above session VWAP) for higher-probability filters.
Overall: Overlay on lower timeframes (1-15 min) to spot setups like ORB breakouts aligning with VWAP crosses, or use for risk management (stops beyond ORB extremes). The timezone support makes it versatile for global markets without manual adjustments.

Session Opening Ranges [DB](Reuploaded with open source script)
A simple indicator that displays the 15 minute opening ranges of the Asia, London and New York trading sessions.
You can select how many days you want to display in total and also customise the colors of each session. The indicator is coded to NY time and should always display at the correct times, which are:
- 18:00 - 18:15 for Asia
- 03:00 - 03:15 for London
- 09:30 - 09:45 for New York
You can also choose to display the sessions name and/or range in points.
If you find any bugs let me know in the comments.
Enjoy!
Session High/Low Average & Range [1CG]The Session High/Low Average & Range indicator independently measures the average price movement from the opening price in each direction. It also displays the maximum high and low distance, called Range. Separating the averages and range into highs and lows helps analyze the volatility of the market as well as the direction.
USE EXAMPLES
Session Open
Session Close
Customization
Minimal - 1x and 2x Averages are replaced with custom lines, in order to show distance to3x.
Calculations
Average High: (high price of session - session opening price) / (session period)
Average Low: (session opening price - low price of session) / (session period)
Range High: The highest price of the last (session period)
Range Low: The lowest price of the last (session period)
INPUTS
Session
Here you can choose the hours for your session and time zone. The default is London session in New York time. Next, the session period determines how many sessions to sample from for the average and range lines, the default is 20. Lastly, you can choose the number of sessions to appear on the chart not including the current session if you are in one, 5 by default.
Lines
All of the lines allow you to change the color, width, and style. They also have a label option to choose to display the price. The bottom of the section allows you to change the location and size of the label text.
**Open Line** -Displays the opening price for the length of the session.
**Average Lines** - Displays the 1x, 2x, and 3x the average distance from open in each direction. Additionally, you can toggle a background color to highlight the area.
**Custom Lines** - Displays a customizable multiple of either the average or range. By default the first custom line displays the Range at a 1x multiplier and the second line displays an Average at a 1.5x multiplier
Display Distance
Here you can choose to display the distance from the lines to the open. This data is marked with a “Δ”. For the three Average lines this will display in the area between the line and the open in the position and size of your choice. The custom lines will have the distance information displayed on the line itself. This helps keep the data organized.

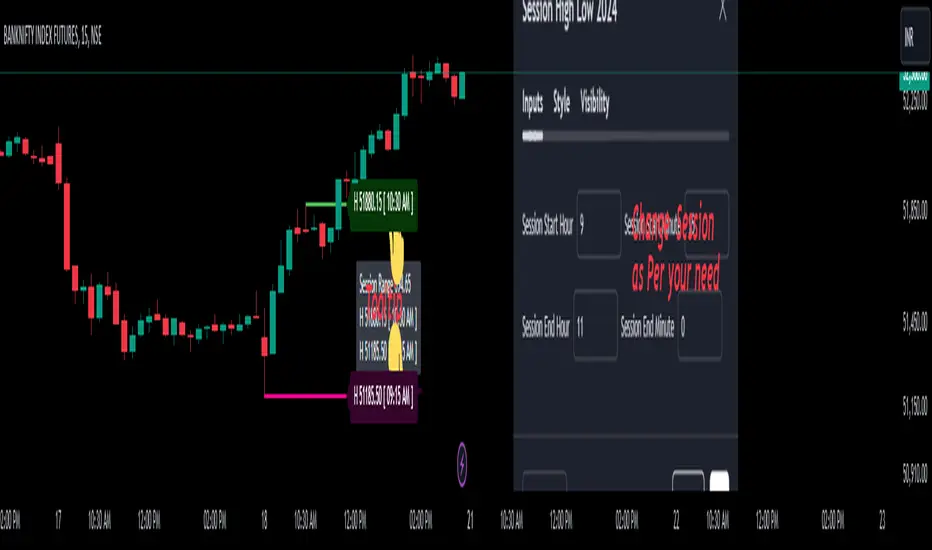
Session High Low 2024
Overview of the Code:
Input for Session Times:
You set up inputs for the start and end times of the trading session, allowing you to customize them as needed.
Time Range Function:
A function isTimeInRange checks whether the current time falls within the specified session start and end times.
initialize High and Low:
indicator initialize session high, low, and their corresponding labels and lines.
Tracking Session High and Low:
Within the specified time range, continuously update session1High and session1Low based on the highest and lowest prices encountered.
Time of Session High/Low:
The High_Time and Low_Time are tracked using the ta.valuewhen() function to capture the exact times when the session high and low occur.
Notes Creation:
You format the high and low values along with their timestamps to create notes that will be displayed alongside the lines.
Drawing Lines and Labels:
After the session ends, you check if there is a new session high or low and draw lines and labels accordingly. If a line or label already exists, you delete it before drawing a new one.
Resetting for Next Session:
At the end of the session, the high and low values are reset for the next session.
Suggestions for Improvement:
Dynamic Line Extensions:
Clear Variable Names Used in Code:
Consider using more descriptive names for variables like Entry_Point and SL_Point to make the code easier to understand.
Commenting:
Although the code is well-commented, always ensure the comments explain the "why" behind the code rather than just the "what."
Example Output:
The output will show the highest and lowest prices during the specified session times and the times they occurred formatted correctly. This output is useful for quick reference during trading and aids in making informed decisions.
Added functionality tool tip Note:
Added a tooltip Note to Get All information of Session High Low & Range.
If you need further modifications, enhancements, or specific functionalities added to this script, please let me know!
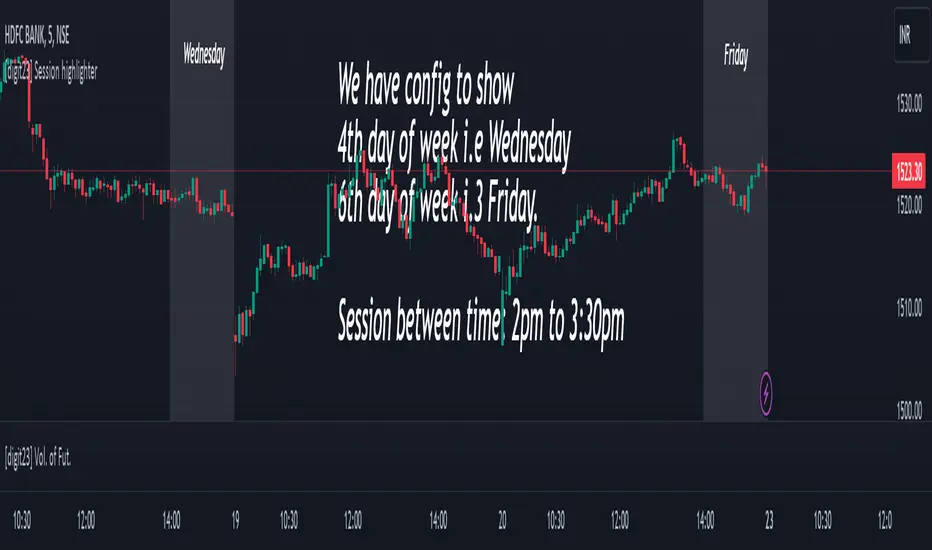
Session highlighter [Digit23]This Pine Script indicator, crafted by Digit23, serves as a session highlighter to enrich your TradingView trading experience. It offers a visual representation of a specified trading session, aiding traders in identifying and concentrating on pivotal time intervals.
Key Features:
User-Defined Session: Tailor the trading session by setting specific start and end times, allowing traders to align the indicator with their preferred timeframes.
Day of Week Filter: Optionally, refine the highlighted session by selecting a specific day of the week, providing flexibility to accommodate diverse trading strategies.
Visual Clarity: The indicator employs a customizable background color during the defined trading session, ensuring quick recognition and differentiation of the highlighted timeframe.
How to Use:
Session Configuration: Adjust the start and end times to define your preferred trading session.
Day of Week Filter (Optional): Fine-tune the indicator by specifying a particular day of the week to apply the session highlight.
Visual Enhancement: The indicator visually highlights the specified trading session, offering a clear and intuitive representation on your TradingView chart.
Compatibility:
This indicator seamlessly integrates with all markets and timeframes available on TradingView, providing versatility for traders across different instruments.
Note:
Use this indicator alongside other technical analysis tools for a comprehensive trading strategy.
This indicator is shared for educational and informational purposes only. Trading involves risk, and it's crucial to conduct thorough research and analysis before making trading decisions.
Disclaimer: This script is provided for educational and informational purposes only. Trading involves risk, and it is essential to conduct thorough research and analysis before making trading decisions.
Session Open Candle MarkerThe "Session Open Candle Marker" is a Pine Script indicator designed for forex and futures traders using Smart Money Concepts (SMC) and RP Profits-inspired strategies. It marks the 15-minute opening range candles for the Asia, London, and NY sessions, where institutional "big players" often gather liquidity. Each session’s range is drawn as a rectangle with a customizable midpoint line, ideal for spotting breakouts, retests, and liquidity sweeps.
Features
Session Open Ranges: Plots rectangles for the 15m open candles of Asia (03:00 EEST), London (10:00 EEST), and NY (15:00 EEST), corresponding to 01:00, 08:00, and 13:00 GMT+1.
Customizable Visualization:
Toggle each session (Asia, London, NY) on/off.
Independent high/low label toggles for each session.
Adjustable rectangle color, midpoint line color, style (solid/dashed/dotted), and width.
Customizable rectangle duration (default: 96 bars, ~24 hours on 15m).
Timezone Flexibility: Default times are set for EEST (UTC+3). Adjust session inputs for your chart’s timezone (e.g., GMT+1: Asia 01:00, London 08:00, NY 13:00; UTC: Asia 00:00, London 07:00, NY 12:00).
Clean Design: Rectangles and labels update dynamically, with proper cleanup to avoid clutter.
Usage:
Setup: Add to a 15m chart (e.g., EURUSD, ES1!). Check your chart’s timezone (Chart Settings > Symbol > Timezone) and adjust session times if needed.
Settings:
Toggle sessions and labels to focus on desired ranges (e.g., London and NY for high volatility).
Customize colors, midpoint line style/width, and rectangle duration.
Trading:
Breakouts/Retests: Trade breakouts above/below the rectangle high/low, with retests back to the range or midpoint (aligned with RP Profits scalping).
Liquidity Sweeps: Watch for price sweeping session highs/lows, reversing for entries (SMC concept).

Sessions By petranThis indicator highlights the key trading sessions on the chart: Asian, Frankfurt, London, and New York. It helps traders visually track when each session begins and ends, making it easier to analyze price action, volume, and volatility during specific times of the day.
Key features:
Customizable session start and end times
Up to 4 major sessions highlighted
Best used on intraday timeframes (1-minute to 1-hour)
Clean, minimal design with adjustable colors and transparency
No repainting – reliable for both live trading and backtesting
Ideal for intraday traders and anyone who wants to better understand market dynamics during different trading sessions.

Session Pivots + EMA20/50 + Bollinger BandsMulti-tool indicator combining session pivots, EMA trend filters, Bollinger Bands, and alerts for intraday trading.
📌 Description
One of the biggest advantages of this indicator is that it supports TradingView’s ALERT system, so traders can be notified the moment price crosses the daily/session pivot level. This allows faster decision-making without constant chart watching.
This script combines three powerful tools into a single indicator:
Session Pivot Levels (with Support/Resistance): Automatically calculates pivot, R1–R3 and S1–S3 levels based on the previous trading session (London, New York, Asia, or custom). Levels are plotted with clean labels and connector lines so you always see the exact price values ahead of time.
EMA Trend Filters (20 & 50): Tracks short- and medium-term market direction with two popular exponential moving averages, helping confirm entries and exits.
Bollinger Bands (fully customizable): Adds volatility bands with choice of SMA, EMA, SMMA, WMA, or VWMA for the middle line, plus adjustable standard deviation and offset.
✅ Key Features
Auto-detects London, New York, and Asian sessions or set your own custom session.
Displays up to 3 levels of support and resistance from the previous session.
Clean label display with customizable theme options (Dark, Light, Custom).
Alerts included: Get notified instantly when price crosses above or below the Pivot.
EMA20/50 trend confirmation built-in.
Bollinger Bands with multiple moving average types and volatility settings.
Works for Forex, Crypto, Indices, Commodities — optimized for intraday & scalping.
This makes it a complete intraday toolkit, reducing the need to load multiple separate indicators.
📄 Full documentation available here: [ link ]

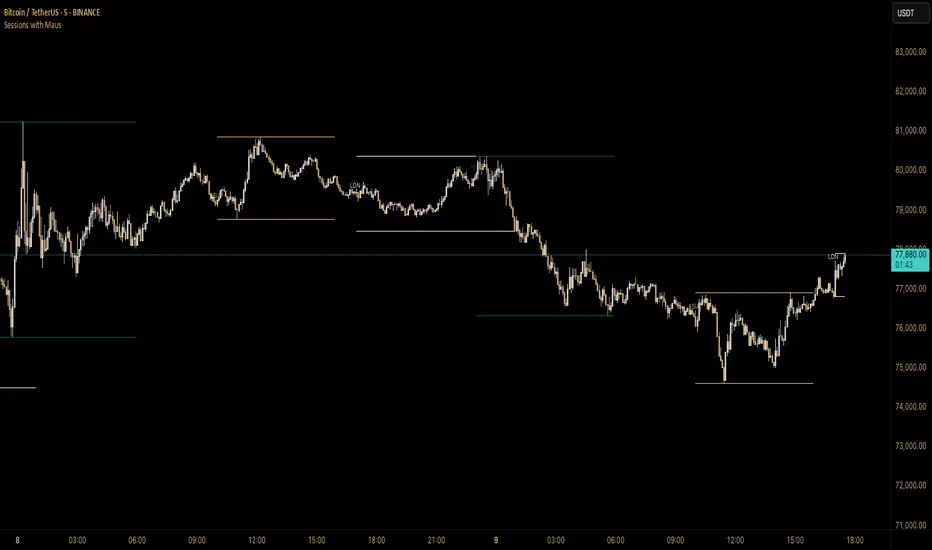
Sessions with Mausa session high/low tracker that draws flat, horizontal lines for Asia, London, and New York trading sessions. It updates those levels in real time during each session, locks them in once the session ends, and keeps them on the chart for context.
At a glance, you always know:
Where each session’s highs and lows were set
Which session produced them (ASIA, LDN, NY labels float cleanly above the highs)
When price is approaching or reacting to prior session levels
🔹 Use Cases:
• Key Levels – See where Asia, London, or NY set boundaries, and watch how price respects or rejects them
• Breakout Zones – Monitor when price breaks above/below session highs/lows
• Session Structure – Know instantly if a move happened during London or NY without squinting at the clock
• Backtesting – Keep historic session levels on the chart for reference — nothing gets deleted
• Confluence – Align these levels with support/resistance, fibs, or liquidity zones
Simple, visual, no distractions — just session structure at a glance.
Session Highlighter (Asia / London / New York)This TradingView Pine Script highlights the three major Forex sessions—Asia, London, and New York—directly on the chart. Each session has customizable start/end times (based on New York time), toggle switches to show or hide them, and adjustable background colors. The script automatically detects sessions that cross midnight and shades the chart accordingly. It can also place optional labels at the exact opening of each session.

Sessions 13-Zones ValentijnJelteA simple indicator to display multiple sessions within sessions. For example, you can divide the New York session into different time slots of 3 hours, 1 hour, and 30 minutes, or whatever you need for your analysis.

Session MasterSession Master Indicator
Overview
The "Session Master" indicator is a unique tool designed to enhance trading decisions by providing visual cues and relevant information during the critical last 15 minutes of a trading session. It also integrates advanced trend analysis using the Average Directional Index (ADX) and Directional Movement Index (DI) to offer insights into market trends and potential entry/exit points.
Originality and Functionality
This script combines session timing, visual alerts, and trend analysis in a cohesive manner to give traders a comprehensive view of market behavior as the trading day concludes. Here’s a breakdown of its key features:
Last 15 Minutes Highlight : The script identifies the last 15 minutes of the trading session and highlights this period with a semi-transparent blue background, helping traders focus on end-of-day price movements.
Previous Session High and Low : The script dynamically plots the high and low of the previous trading session. These levels are crucial for identifying support and resistance and are highlighted with dashed lines and labeled for easy identification during the last 15 minutes of the current session.
Directional Movement and Trend Analysis : Using a combination of ADX and DI, the script calculates and plots trend strength and direction. A 21-period Exponential Moving Average (EMA) is plotted with color coding (green for bullish and red for bearish) based on the DI difference, offering clear visual cues about the market trend.
Technical Explanation
Last 15 Minutes Highlight:
The script checks the current time and compares it to the session’s last 15 minutes.
If within this period, the background color is changed to a semi-transparent blue to alert the trader.
Previous Session High and Low:
The script retrieves the high and low of the previous daily session.
During the last 15 minutes of the session, these levels are plotted as dashed lines and labeled appropriately.
ADX and DI Calculation:
The script calculates the True Range, Directional Movement (both positive and negative), and smoothes these values over a specified length (28 periods by default).
It then computes the Directional Indicators (DI+ and DI-) and the ADX to gauge trend strength.
The 21-period EMA is plotted with dynamic color changes based on the DI difference to indicate trend direction.
How to Use
Highlight Key Moments: Use the blue background highlight to concentrate on market movements in the critical last 15 minutes of the trading session.
Identify Key Levels: Pay attention to the plotted high and low of the previous session as they often act as significant support and resistance levels.
Assess Trend Strength: Use the ADX and DI values to understand the strength and direction of the market trend, aiding in making informed trading decisions.
EMA for Entry/Exit: Use the color-coded 21-period EMA for potential entry and exit signals based on the trend direction indicated by the DI.
Conclusion
The "Session Master" indicator is a powerful tool designed to help traders make informed decisions during the crucial end-of-session period. By combining session timing, previous session levels, and advanced trend analysis, it provides a comprehensive overview that is both informative and actionable. This script is particularly useful for intraday traders looking to optimize their strategies around session close times.

Sessions by nolimitCustom Trading Sessions Indicator (6 Sessions)
This indicator allows you to display up to 6 customizable trading sessions on your chart with full control over timing, colors, and timezone settings.
Features:
- 6 independent trading sessions that can be enabled/disabled individually
- Flexible time range settings for each session
- Individual color selection for each session background
- Timezone selection (UTC-12 to UTC+12) that applies to all sessions
- Clean, organized settings grouped by session
