Exchange sessionsThe Exchange sessions indicator allows you to show world trading sessions on the chart, taking into account working hours in the corresponding time zone .
>> For traders:
The settings set the working hours of the exchange, and the indicator itself automatically binds it to the time zone of the selected exchange location - this allows you not to get confused about the correctness of the entered time ranges for any type of chart - stock, futures, index, forex or crypto. By default, the valid working hours are set and no further configuration is required.
In addition, you can select those zones that you want to highlight (using the marker to the left of the session name), and you can also highlight the beginning of each trading session - the start marker.
>> For encoders:
In the code, you can see how to set the session time and bind its control to the time zone from the IANA time zone database.
Also, in the code you will find a way to align the description of input parameters using Unicode Spaces.
I hope that my script will benefit the community and provide a quality result in my work!
All profit!
=========================================================================================
Индикатор Exchange sessions позволяет показать на графике мировые торговые сесси с учётом рабочего времени в соответствующм часовом поясе .
>> Для трейдеров:
В настройках выставляется рабочее время биржи, а индикатор сам автоматически привязывает его к часовому поясу выбранной локации биржи - это позволяет не путаться в корректности введённых временных диапазонов при любом типе графика - stock, futures, index, forex или crypto. По умолчанию задано действующее рабочее время и дополнительная настройка не требуется.
Кроме этого - можно выбирать те зоны, которые нужно подсветить (с помощью маркера слева от названия сессии), а также можно выделить начало каждой торговой сессии - маркер start.
>> Для кодеров:
В коде Вы можете посмотреть как задавать время сессии и привязать его контроль к временной зоне из базы данных часовых поясов IANA.
Также, в коде Вы найдёте способ выравнивания описания входных параметров с помощью Unicode Spaces.
Я надеюсь, что мой скрипт принесёт пользу сообществу и предоставит качественный результат в своей работе!
Всем профита!
Cari dalam skrip untuk "session"

Advanced Time SessionsIntroducing Advanced Time Sessions , this tool uses a 24 hour look ahead plot - this is to help inform the trader about not just the current session but the next one coming up. Now traders, at a quick glance can see what session they trading in, how much time till the sessions close, what is the next session, and when the daily market close is! Main features of the tool include daily dividers, day labels and kill zone highlighters.
This tool is a day traders dream to have this subtle and stylish data at a glance letting you focus on more strategically placing your trades based around time and price!
EURUSD - 15m
EURUSD - 5m
Smart Money Concepts used with Advanced Time Sessions

Hancock - RSI [Session]This is an improvement of my RSI Volume indicator.
I have made a session based RSI indicator which helps to aid the decision making upon session opens and gives a good indication of trend during. It also has various fixes for bugs found in the above indicator.
It has multiple settings to configure:
Use session: This toggles the RSI to be session based mode.
Session - Time: The session hours for the RSI .
Session - Days of Week: This is the days for the session based RSI to use.
Session - Mode: The RSI is reset when a new session starts. This mode adjusts how the initial value of the RSI is calculated:
OC: RSI uses the absolute open - close * volume value.
TR: RSI uses the true range * volume value.
VOL: RSI uses the volume value.
TF - Resolution: This is the lower time frame to be used in calculating the wick adjusted buy and sell volume used in the calculation of Volume weighted RSI . A lower time frame produces more accurate buy and sell volumes.
Use Volume: Enabling this produces a Volume weighted RSI . Disabled produces a normal RSI .
Use Wicks: Enabling this adjusts the calculation for buy and sell volume by taking wicks into account.
RSI - Length: This is the length to be used for the RSI . If session based this is the maximum value the RSI length can be - length can be shorter to not include previous session data.
RSI - Overbought: This is the "overbought" level for the RSI .
RSI - Oversold: This is the "oversold" level for the RSI .
RSI - Threshold: This is the threshold used to indicate trend change colours on the RSI .
Happy Trading
Hancock

Global Session AlertsSee liquidity shifts before they happen. Session & market structure alerts, plotted X minutes early.
Global Session Alerts: Multi-Time-zone (Configurable Lead)
Clean, intraday session and structure alerts plotted directly on your chart: X minutes before the event, fully configurable.
This indicator draws vertical dotted lines + labels for key market sessions, rhythm shifts, and close mechanics, helping you anticipate liquidity and volatility before it hits.
Sessions
Asian Open / Close
London Open / Close
NY Open / Close
Rhythm / Structure
10:00am Reversal / Trend
Wall Street Lunch
PM Session
Power Hour
Close Mechanics
Pre-Close
HOOD Effect
Closing Cross
Features
Configurable lead time (minutes before event)
Editable event times + label text
Vertical or horizontal labels
Adjustable label size & offset
Per-group color + opacity
IANA timezone support (DST-aware)
Optional TradingView alerts
Intraday-only, non-repainting
Automatic cleanup (count-based & time-based)
Designed for SPX / ES / NQ / 0DTE scalpers who care about when the market moves, not just where.

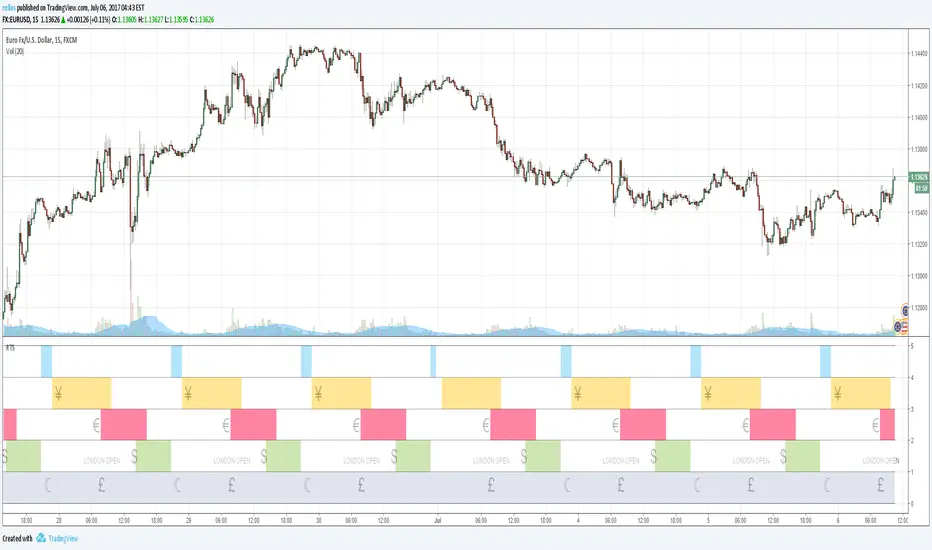
Session Dominance Profile [Pointalgo]Session Dominance Profile is a visual volume-distribution tool that shows which global trading session (Asia, London, or New York) dominates price activity across different price levels within a defined historical range.
The indicator builds a horizontal volume profile using candle close prices and volume, then classifies each price level by the session that contributed the highest volume.
How It Works :
The script analyzes a configurable lookback period
Price range is divided into multiple horizontal bins
Volume is accumulated per price level
Each bin is split into three session buckets:
Asia Session (Yellow)
London Session (Blue)
New York Session (Red)
The session with the highest volume at that price level determines the color
This results in a Session-based Dominance Profile, helping traders visually identify:
Where major sessions were most active
Session-specific acceptance or rejection zones
Potential intraday and swing reaction areas
Practical Use Cases :
Identify price levels dominated by a specific session
Understand session rotation and participation
Combine with:
Market structure
Support & resistance
VWAP or moving averages
Useful for intraday, scalping, and swing trading
Inputs Explained:
Lookback – Number of historical bars used to build the profile
Resolution – Number of price bins (higher = more detail)
Fixed Width (Bars) – Maximum horizontal width of the profile
Offset (Bars) – Distance of the profile from the current bar
Profile Direction – Left-to-Right or Right-to-Left rendering
Session Time Reference:
All sessions are calculated using UTC time.
Important Notes:
This indicator is visual and analytical only
It does not generate buy or sell signals
No repainting: the profile is calculated on the last bar only
Designed for educational and research purposes
Disclaimer:
This script does not provide financial advice.
Trading involves risk, and past volume behavior does not guarantee future results.
Always confirm signals using additional analysis and proper risk management.

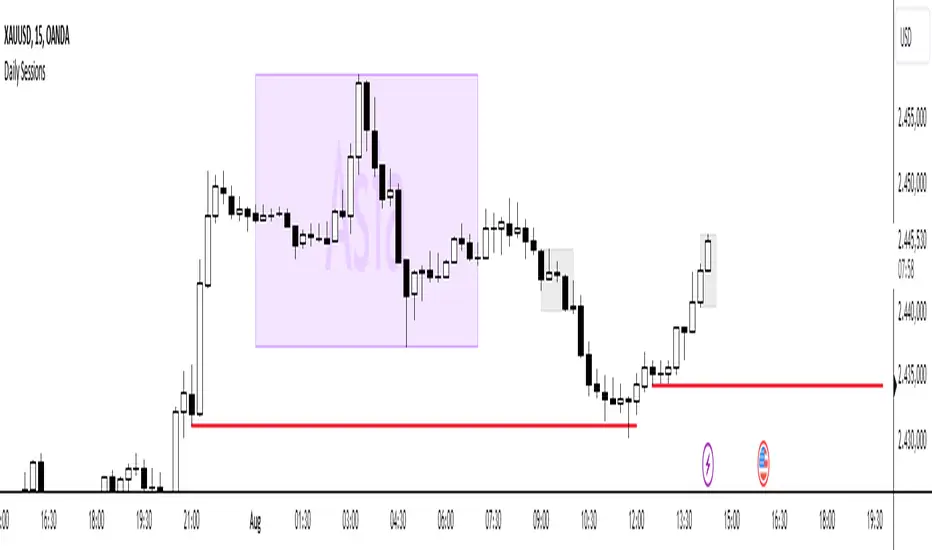
Watermark with Session Boxes (by Rufi)Watermark & Session Boxes - Chart Branding Tool
What it does: Combines professional chart watermarking with automated trading session visualization for clean, branded analysis.
Key Features:
Smart Session Boxes: Auto-draws boxes around Asia (8PM-11:59PM), London (2AM-5AM), and NY (7AM-10AM) sessions using high/low detection
Custom Watermark: Professional text overlay with your brand/tagline
Full Customization: Adjustable colors, transparency (0-100%), and display limits (1-30 days)
How it works: Uses Pine Script's time() function to detect session periods, tracks price extremes during each session, then draws filled rectangles from session high to low. Perfect for identifying key support/resistance levels from major trading periods.
Best for: Intraday traders who want branded charts with clear session-based S/R levels. Ideal for forex, indices, and crypto on lower timeframes.

Quarterly Theory ICT 01 [TradingFinder] XAMD + Q1-Q4 Sessions🔵 Introduction
The Quarterly Theory ICT indicator is an advanced analytical system based on the concepts of ICT (Inner Circle Trader) and fractal time. It divides time into quarterly periods and accurately determines entry and exit points for trades by using the True Open as the starting point of each cycle. This system is applicable across various time frames including annual, monthly, weekly, daily, and even 90-minute sessions.
Time is divided into four quarters: in the first quarter (Q1), which is dedicated to the Accumulation phase, the market is in a consolidation state, laying the groundwork for a new trend; in the second quarter (Q2), allocated to the Manipulation phase (also known as Judas Swing), sudden price changes and false moves occur, marking the true starting point of a trend change; the third quarter (Q3) is dedicated to the Distribution phase, during which prices are broadly distributed and price volatility peaks; and the fourth quarter (Q4), corresponding to the Continuation/Reversal phase, either continues or reverses the previous trend.
By leveraging smart algorithms and technical analysis, this system identifies optimal price patterns and trading positions through the precise detection of stop-run and liquidity zones.
With the division of time into Q1 through Q4 and by incorporating key terms such as Quarterly Theory ICT, True Open, Accumulation, Manipulation (Judas Swing), Distribution, Continuation/Reversal, ICT, fractal time, smart algorithms, technical analysis, price patterns, trading positions, stop-run, and liquidity, this system enables traders to identify market trends and make informed trading decisions using real data and precise analysis.
♦ Important Note :
This indicator and the "Quarterly Theory ICT" concept have been developed based on material published in primary sources, notably the articles on Daye( traderdaye ) and Joshuuu . All copyright rights are reserved.
🔵 How to Use
The Quarterly Theory ICT strategy is built on dividing time into four distinct periods across various time frames such as annual, monthly, weekly, daily, and even 90-minute sessions. In this approach, time is segmented into four quarters, during which the phases of Accumulation, Manipulation (Judas Swing), Distribution, and Continuation/Reversal appear in a systematic and recurring manner.
The first segment (Q1) functions as the Accumulation phase, where the market consolidates and lays the foundation for future movement; the second segment (Q2) represents the Manipulation phase, during which prices experience sudden initial changes, and with the aid of the True Open concept, the real starting point of the market’s movement is determined; in the third segment (Q3), the Distribution phase takes place, where prices are widely dispersed and price volatility reaches its peak; and finally, the fourth segment (Q4) is recognized as the Continuation/Reversal phase, in which the previous trend either continues or reverses.
This strategy, by harnessing the concepts of fractal time and smart algorithms, enables precise analysis of price patterns across multiple time frames and, through the identification of key points such as stop-run and liquidity zones, assists traders in optimizing their trading positions. Utilizing real market data and dividing time into Q1 through Q4 allows for a comprehensive and multi-level technical analysis in which optimal entry and exit points are identified by comparing prices to the True Open.
Thus, by focusing on keywords like Quarterly Theory ICT, True Open, Accumulation, Manipulation, Distribution, Continuation/Reversal, ICT, fractal time, smart algorithms, technical analysis, price patterns, trading positions, stop-run, and liquidity, the Quarterly Theory ICT strategy acts as a coherent framework for predicting market trends and developing trading strategies.
🔵b]Settings
Cycle Display Mode: Determines whether the cycle is displayed on the chart or on the indicator panel.
Show Cycle: Enables or disables the display of the ranges corresponding to each quarter within the micro cycles (e.g., Q1/1, Q1/2, Q1/3, Q1/4, etc.).
Show Cycle Label: Toggles the display of textual labels for identifying the micro cycle phases (for example, Q1/1 or Q2/2).
Table Display Mode: Enables or disables the ability to display cycle information in a tabular format.
Show Table: Determines whether the table—which summarizes the phases (Q1 to Q4)—is displayed.
Show More Info: Adds additional details to the table, such as the name of the phase (Accumulation, Manipulation, Distribution, or Continuation/Reversal) or further specifics about each cycle.
🔵 Conclusion
Quarterly Theory ICT provides a fractal and recurring approach to analyzing price behavior by dividing time into four quarters (Q1, Q2, Q3, and Q4) and defining the True Open at the beginning of the second phase.
The Accumulation, Manipulation (Judas Swing), Distribution, and Continuation/Reversal phases repeat in each cycle, allowing traders to identify price patterns with greater precision across annual, monthly, weekly, daily, and even micro-level time frames.
Focusing on the True Open as the primary reference point enables faster recognition of potential trend changes and facilitates optimal management of trading positions. In summary, this strategy, based on ICT principles and fractal time concepts, offers a powerful framework for predicting future market movements, identifying optimal entry and exit points, and managing risk in various trading conditions.

Indian Market Sessions for BacktestingThis indicator is designed to increase the quality of your backtesting in the Indian Market.
NSE & BSE run from 9:15 am IST to 3:30 pm IST.
Naturally different times have different kinds of volatility.
On your chart you will find premarked -
Saffron - 9:15 am to 10:30 am - Opening Session - High Volatility Observed Historically
White - 10:35 am to 2:25 pm - Middle Session - Lower Volatility Observed Historically
Green - 2:30 pm to 3:30 pm - Closing Session - Medium to High Volatility Observed Historically
You will also find the start of each session marked with an arrow.
Feel free to change the times from the input settings and the color and visibility from the style settings.
_______________
Usage:
When you backtest any strategies, say moving average crossovers, also mark the sessions in your sheet which will help you further increase accuracy.
Feel free to drop your doubts in the comments.

ATR+ Advanced Sessions ATR for DaterangeATR+ Advanced Sessions ATR for Daterange
The ATR+ adds the following additional filters to the stock ATR indicator by Tradingview:
- Calculates the overall average ATR for a user defined daterange, optionally filtered by trading session and selected weekdays, presented as a secondary line over the standard ATR line.
- Basic ATR line, with colour highlight to indicate the selected sessions, days and timeframe being calculated by the average ATR+ line.
- Average ATR+ line indicating the average of all ATRs within the defined timeframe, optionally filtered by instances of a selected trading session and selected weekdays.
- Customisable appearance.
- The ATR+ also includes the basic ATR configuration options typically found in the standard ATR by Tradingview, including period length and smoothing type. Defaults are set to the factory standards: 14 length, RMA smoothing type.
What Is the Average True Range (ATR)?
The ATR is a technical analysis tool that measures market volatility by decomposing the entire range asset price for that period. Investopedia describes the ATR as follows:
"The average true range (ATR) is a technical analysis indicator, introduced by market technician J. Welles Wilder Jr. in his book New Concepts in Technical Trading Systems, that measures market volatility by decomposing the entire range of an asset price for that period.
The true range indicator is taken as the greatest of the following: current high less the current low; the absolute value of the current high less the previous close; and the absolute value of the current low less the previous close. The ATR is then a moving average, generally using 14 days, of the true ranges."
For more information on the ATR and its calculations and use cases, see here:
Investopedia link here.
Tradingview link here.
Note
The indicator may time out if the number of bars being calculated is too long. If this happens, you will need to reduce the datetime range, or increase the chart timeframe in order to reduce the number of bars being calculated and the indicator will attempt to recalculate.

FX Sessions - All in OneFX Sessions - All In One
This Script offer a wide variety of goodies
SESSION OPEN
it will draw a line for the TOP, MID and LOW of the asian session (you can adjust the hours of the session)
It will draw a line for the TOP and LOW of the London Session (you can adjust the hours of the session)
It will draw a line for the TOP and LOW of the NY Session (you can adjust the hours of the session)
SEPARATORS
while on lower timeframe, you will have a separator for days that occurs at midnight NY time
While on Daily timeframe, you will have a separator that will separate every month, on the 1st trading day of that given month
IMBALANCE
The candle leaving imbalance (a candle where there is a portion that is not matched with a price action left or right)
NY Midnight opening price
a dotted line will be drawn (up to 500 bar limitation) from NY open until it reaches either the 500 bar or the end of the day.
on lower timeframe (below 3 minutes) the bar will not reach the end of the day

London&NY Sessions with DaysOnly has certain time frames for New York and London which can be changed. Does not included other sessions. Also has options to include the market open.


Range Multi-jour Double - SessionEnglish:
Allows you to display the daily highs and lows for two specific sessions, along with the RSI shown as a numerical value at the top. This lets you see at a glance if it's overbought or oversold (turning red). It provides an OPR for both the London and NY sessions in a single indicator.
Français:
Permet d'avoir le plus haut et le plus bas de 2 sessions pour chaque journée + le RSI afficher en haut en chiffre pour voir en un coup d'oeil s'il est en surachat ou en survente, il devient rouge. Ca permet d'avoir un OPR pour la session de londre et de NY en 1 indicateur.

Market Sessions V2🔄 MAJOR UPDATE v2.0
✨ NEW FEATURES:
- Live Info Panel with session status, timer, range & change%
- Average range statistics (based on history period)
- Weekend mode highlighting (Fri US Close → Mon Asia Open)
- Pre-market & Post-market tracking for US session (table only)
- Auto/Manual session times with validation
🔧 IMPROVEMENTS:
- Accurate official exchange hours (TSE 09:00-15:30, LSE 08:00-16:30, NYSE 09:30-16:00, ASX 10:00-16:00)
- Automatic DST handling via native timezones
- Tokyo Lunch Break indicator (11:30-12:30 JST)
- Works on all timeframes with smart adaptation (boxes ≤4H, table always)
- Bar Replay compatible
🛡️ RELIABILITY:
- Input validation for manual time entries
- Graceful handling of higher timeframes
- Optimized memory management
📖 For Forex/Crypto traders: Sessions show continuous trading hours.
Tokyo lunch (11:30-12:30 JST) is indicated in table only.

Session High/LowSession High Low
Trading Sessions
Forex Sessions (oder Futures Sessions, je nachdem, was du handelst)
Pine Script Indicator
Intraday Levels
Market Sessions
High Low Lines
Day Trading Tools

Aude - Minimal Session IndicatorMinimal Session Indicator
- The indicator allows users to highlight specific sessions (time range) on the chart.
- There are options to change the visual settings of the session box (BG color, Border color, Border style).
- Max 500 sessions drawn

Session Volume Spike DetectorSession Volume Spike Detector (Buy/Sell, Dual Windows, MTF + Edge/Cooldown)
What it does
Detects statistically significant buy/sell volume spikes inside two DST-aware Mountain Time sessions and projects 1m / 5m / 10m signals onto any chart timeframe (even 1s). Spikes are confirmed at the close of their native bar and are edge-triggered with optional cooldowns to prevent duplicate alerts.
How spikes are detected
Volume ≥ SMA × multiplier
Optional jump vs recent highest volume
Optional Z-Score gate for significance
Separate Buy/Sell logic using your Direction Mode (Prev Close or Candle Body)
Multi-Timeframe (MTF) display
Shows 1m, 5m, 10m arrows on your current chart
Each HTF fires once on its bar close (no repaint after close)
Sessions (DST-aware, MT)
Morning: 05:30–08:30
Midday: 11:00–13:30
Spikes only count inside these windows.
Inputs & styling
Thresholds: SMA length, multipliers, recent lookback, Z-Score toggle/level
Toggles for which TFs to display (chart TF, 1m, 5m, 10m)
Per-TF colors + cooldowns (seconds) for Any TF, 1m, 5m, 10m
Alerts (edge + cooldown)
MTF Volume Spike (Any TF) — fires on the first qualifying spike across enabled TFs
1m / 5m / 10m Volume Spike — per-TF alerts, Buy or Sell
Recommended: set alert Trigger = Once per bar close. Cooldowns tame “triggered too often” warnings.
Great with
FVG zones, bank/insto levels, session range breaks, and trend filters. Use the MTF arrows as a participation/pressure tell to confirm or fade moves.
Notes
Works on any symbol/timeframe; best viewed on 1m or sub-minute charts.
HTF spikes appear on the bar close of 1m/5m/10m respectively.
No dynamic plot titles; Pine v6-safe.
Short summary (≤250 chars):
MTF volume-spike detector for intraday sessions (DST-aware, MT). Projects 1m/5m/10m buy/sell spikes onto any chart, with edge-triggered alerts and per-TF cooldowns to prevent duplicates. Ideal for spotting institutional participation.

Key Levels & Session Highs/Lows by OdegosProfessional multi-timeframe support and resistance level indicator that automatically tracks and displays key price levels across different trading sessions and timeframes.
🎯 What it shows:
Session Open - Daily market open reference line
Asia & London Sessions - High/low levels from major trading sessions
Previous Day - Yesterday's actual high and low levels
Weekly & Monthly - Higher timeframe support/resistance levels
⚡ Smart Features:
Auto-combines overlapping levels with merged labels
Break detection - Lines stop when price breaks through (optional)
Timezone support - Works with any global timezone
Universal colors - Optimized for both light and dark chart themes
Clean interface - Organized settings with intuitive dropdowns
🛠️ Fully Customizable:
Individual show/hide toggles for each level type
Custom colors, line styles, and widths
Adjustable label text and positioning
Global text color override option
Perfect for day traders, swing traders, and anyone who relies on key support/resistance levels for market analysis.

30 Second Futures Session Open RangeThis indicator displays 30 second opening ranges from Globex, Europe, and RTH sessions.
From the RTH session range, it also displays infinitely generating Price Targets based on a % of the opening range size.
I am retrieving the 30 second data using the new "request.security_lower_tf()" function.
The importance of these levels is based on the idea that when the market opens, algorithms establish their positions within the first 30 seconds.
These areas can also be seen as potential areas of support and resistance throughout the sessions.
Enjoy!

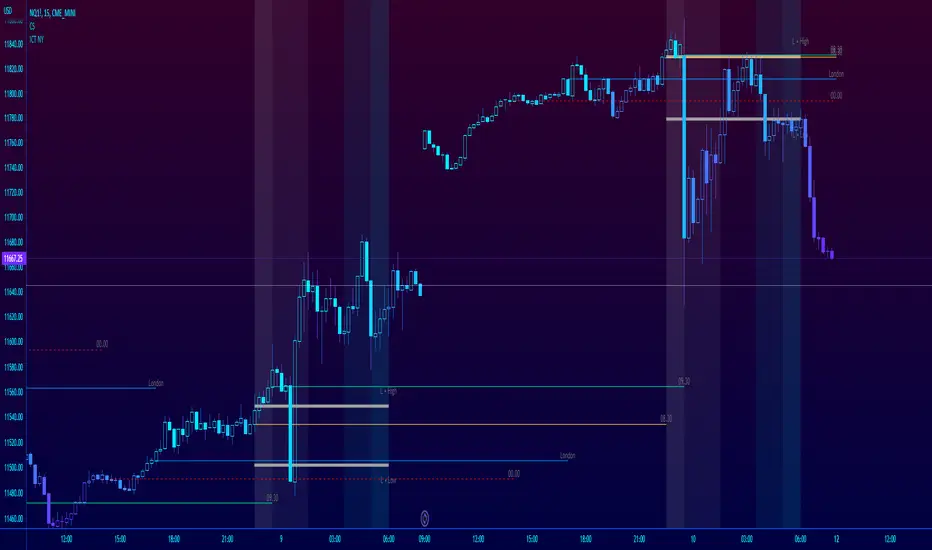
ICT NY Futures Indices Session Model - YT New York MentorshipThis indicator plots out the time periods and open lines as outlined in ICT's 2022 Mentorship and is designed specifically for the New York futures trading session.
Time zone is set to GMT-4 (NY) by default but can be changed for accommodate daylight saving in the menu.
Please note this indicator is to be used only on the 30min timeframe and below.
Here are its features:
The background color shows the morning session, in two parts (8.30am to 9.30am and 9.30am to 11.30am), then a two hour gap for lunch (ICT calls this "Dead time") and finally, the afternoon session, also to two (1.30pm to 3pm and 3pm to 4pm).
It not only shows the current killzones, but future zones as well.
These times are important; trades can be framed within these zones as taught in the mentorship.
Next are the open lines. These lines are automatically plotted and can be areas for price to react off of; they are the opening price of a candle at these times:
00.00 (New York Midnight, also known as "True Day Open")
8.30am (New York Equities pre-open)
9.30am (New York Equities open)
2.00am (London Stock Exchange open)
And lastly, London's trading session High and Low are projected forward onto the New York trading session.
These two price points are areas of liquidity that were pooled during London, but they can also often set the high or low of the day.
Please let me know if there are any bugs or if you have suggestions for the next update.
Trademinator Forex Sessions"Trademinator Forex Sessions" displays overlapping colored boxes on the chart delimited by the opening and closing times of the specific exchange on the horizontal axis, and the maximum and minimum trading prices on the vertical axis, respectively. It also displays the exchange name on top of the candle corresponding to the opening time for each exchange.
Sessions can be enabled or disabled on the chart for each individual exchange through the "Inputs" tab of the "Settings" dialog box of the indicator. The exchange names can also be enabled or disabled in the same tab.
The included exchange sessions in sequential opening order are:
1- Sydney
2- Tokio
3- Frankfurt
4- London
5- New York
And additional session is included to account for the 2 hour timespan between the New York close and the Sydney open, when all exchanges are closed but still there is someone out there trading the Forex. I don't need to nominate you, since by now you already know who you are.
A future release of the indicator is planned to automatically adjust the opening and closing times of each exchange by the Daylight Saving Time.
