Session barsthis script marks off the extended hours trading for NY session. Shades the off hours and overnight data. Highlights the regular trading session for NY session. It can be adjusted for any particular market.
I use it specifically to show the missing data on the SPY as compared with the continuous data on the SPX500.
Cari dalam skrip untuk "session"

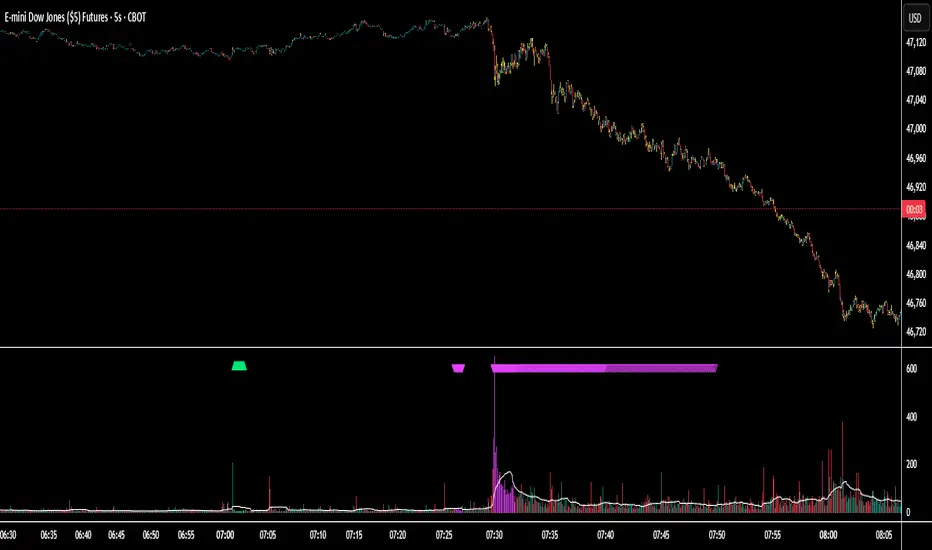
Session Volume Spike Detector (MTF Arrows)Overview
The Session Volume Spike Detector is a precision multi-timeframe (MTF) tool that identifies sudden surges in buy or sell volume during key market windows. It highlights high-impact institutional participation by comparing current volume against its historical baseline and short-term highs, then plots directional markers on your chart.
This version adds MTF awareness, showing spikes from 1-minute, 5-minute, and 10-minute frames on a single chart. It’s ideal for traders monitoring microstructure shifts across multiple time compressions while staying on a fast chart (like 1-second or 1-minute).
Key Features
Dual Session Windows (DST-aware)
Automatically tracks Morning (05:30–08:30 MT) and Midday (11:00–13:30 MT) activity, adjusted for daylight savings.
Directional Spike Detection
Flags Buy spikes (green triangles) and Sell spikes (magenta triangles) using dynamic volume gates, Z-Score normalization, and recent-bar jump filters.
Multi-Timeframe Projection
Displays higher-timeframe (1m / 5m / 10m) spikes directly on your active chart for continuous visual context — even on sub-minute intervals.
Adaptive Volume Logic
Each spike is validated against:
Volume ≥ SMA × multiplier
Volume ≥ recent-high × jump factor
Optional Z-Score threshold for statistical significance
Session-Only Filtering
Ensures spikes are only plotted within specified trading sessions — ideal for futures or intraday equity traders.
Configurable Alerts
Built-in alert conditions for:
Any timeframe (MTF aggregate)
Individual 1m, 5m, or 10m windows
Alerts trigger only when a new qualifying spike appears at the close of its bar.
Use Cases
Detect algorithmic or institutional activity bursts inside your trading window.
Track confluence of volume surges across multiple timeframes.
Combine with FVGs, bank levels, or range breakouts to identify probable continuation or reversal zones.
Build custom automation or alert workflows around statistically unusual participation spikes.
Recommended Settings
Use on 1-minute chart for full MTF display.
Adjust the SMA length (default 20) and Z-Score threshold (default 3.0) to suit market volatility.
For scalping or high-frequency environments, disable the 10m layer to reduce visual clutter.
Credits
Developed by Jason Hyde
© 2025 — All rights reserved.
Designed for clarity, precision, and MTF-synchronized institutional volume detection.
Intraday Sessions Ranges with Time SegmentationSession Ranges indicator overlays customizable range boxes on major trading sessions (e.g. London, Premarket, NY AM and NY PM) using New York time.
Toggle visibility, add evenly spaced vertical segment lines, and highlight key time zones. Perfect for traders marking price action and levels across multiple historical days.

Sessions by SHARK [Kyiv Time]Why Forex Sessions Matter
First of all, it is very convenient for a trader to structure their working hours. The best times to open positions are during the London Kill Zone (KZ) and New York Kill Zone (KZ). Based on what happens within each session, you can build your future analysis while considering the overall context.
We must understand that there are specific times of the day that are more or less volatile. Knowing this will help you determine when you should be looking for trade setups and when you should avoid them.
Trading outside of the Kill Zones can lead to holding positions for too long because market liquidity decreases, which in turn leads to lower volatility.

Sessions by Aegean This script has the full 8 hours for the 3 major sessions and 1 hour for the Frankfurt, Germany session

Trading Sessions v.2 - Max WarrenUpdated to work with Pine updates:
London DST timezone still broken. Will fix later.
As always full customization visually, with London fix I'll add more options.
Keep in mind the render resolution option

session high and low (only for current day) -HITHVEERits about session highs and lows and only for the current day and main sessions are asia london and newyork

Session Highs and LowsShows the current and previous session highs and lows for the New York, London and Asian sessions

Session Start & Day BackgroundThis indicator visually enhances your TradingView charts by highlighting the start of each new trading day and coloring the background based on the day of the week.
The first candle of each new trading day is marked in gray for better session separation.
The background color changes based on the current day of the week, making it easier to recognize market patterns and trends at a glance.
Works across all markets including Forex, Stocks, and Crypto.
Designed to improve chart readability and market structure visualization.
Ideal for traders who want a clearer overview of daily sessions and better differentiation between trading days! 🚀

Session High and Low IndicatorThis script is meant for stocks that have a pre-market session. It is meant to be used on the 1 min time frame. This script will draw a green line at the high of pre-market, and a red line at the low of pre-market and extend these lines across the regular session day
This makes it easy to see if price action during regular market has broken above pre-market high or broken below pre-market low.
The high/low skips any quick spikes in price action (similar to what happens at 8:30 am every day).


Session HeatmapIntraday Seasonality
Overview
Analyzes historical patterns by time of day. Identifies when volatility, volume, and open interest changes tend to be highest or lowest.
Features
Multiple Metrics: TR (volatility), Volume, and Open Interest changes
Flexible Grouping: View patterns by weekday or month to spot day-of-week or seasonal effects
Heatmap Visualization: Blue (low) to Red (high) color scale for quick pattern recognition
Percentile Mode: Reduces outlier impact by using 5th-95th percentile range
Timezone Support: Display in UTC alongside your local time
Metrics Explained
TR: Volatility - when markets move most
Volume: Liquidity - when participation is highest
OI Increase: When new positions are opened
OI Decrease: When positions are closed
OI Net: Net open interest change
Usage
Set your timezone and preferred slot size (30min/1H)
Choose a date range (relative or custom)
Select a metric to analyze
Use "Group By" to see weekday or monthly patterns
Switch to Percentile color scale if outliers dominate
Notes
Chart timeframe should be equal to or smaller than Slot Size
OI metrics require Binance Perpetual symbols
DST is not automatically adjusted; consider seasonal shifts for US/EU sessions

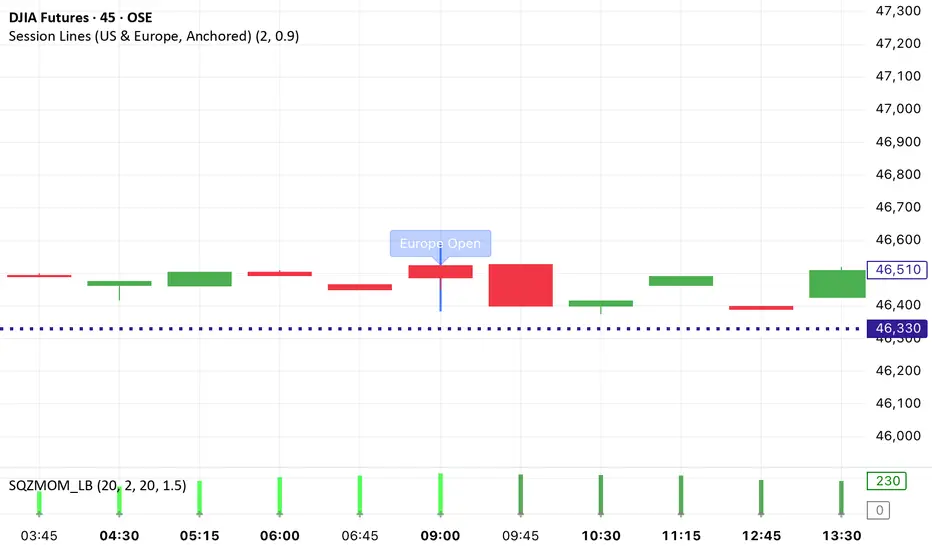
Session Lines (US & Europe, Anchored and Adaptive)A sleek indicator that marks the London (blue) and New York (red) trading sessions with perfectly aligned vertical lines both open and close times.
Lines automatically scale with your chart, adapt to any timeframe, and fade smoothly on higher intervals to keep your layout clean and professional.

Session VolumeThis script tracks and displays 30-minute volume segments during the Regular Trading Hours (RTH) session. It allows traders to visually compare each time block’s volume today vs. the same block from the previous day, helping spot early signs of strength, weakness, or divergence.
Features:
Tracks 13 blocks from 9:30 AM to 4:15 PM ET.
Compares today's volume against historical volume from the same time block yesterday.
Highlights percentage changes per block.
Summary row totals show overall volume trend today vs. yesterday.
This tool is useful for discretionary traders, auction market theorists, and anyone who incorporates market-generated information into their decision-making.


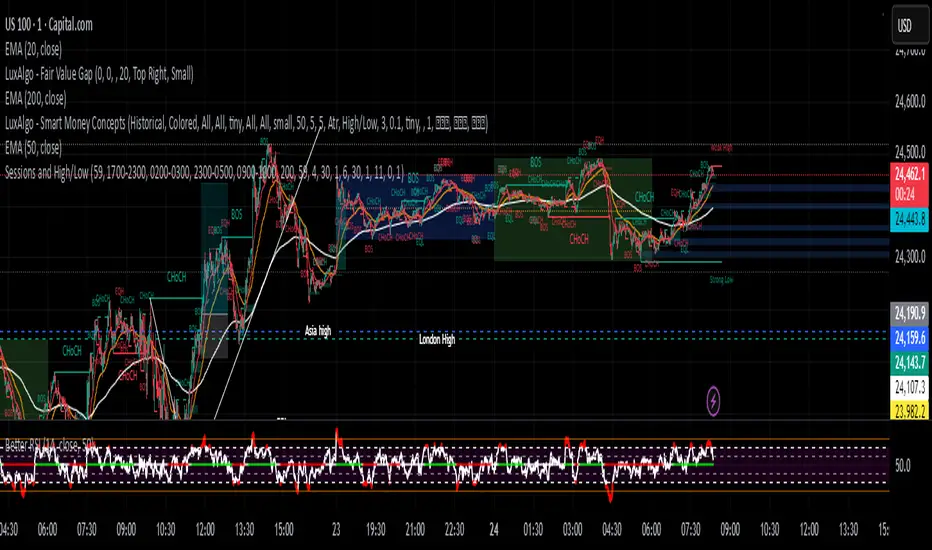
Sessions and High/LowCan be used to mark highs and lows of any sessions you desire can do 4 sessions
Session TPO Market ProfileIntroduction
Wikipedia: A Market Profile is an intra-day charting technique (price vertical, time/activity horizontal) devised by J. Peter Steidlmayer, a trader at the Chicago Board of Trade (CBOT), ca 1959-1985. Steidlmayer was seeking a way to determine and to evaluate market value as it developed in the day time frame. The concept was to display price on a vertical axis against time on the horizontal, and the ensuing graphic generally is a bell shape--fatter at the middle prices, with activity trailing off and volume diminished at the extreme higher and lower prices. In this structure he recognized the 'normal', Gaussian distribution he had been introduced to in college statistics.
Important : The market profile tool is designed to be used on the 30min timeframe, however, you can modify its parameters and use it on lower timeframes (15/10/5min)
This indicators displays the following information
Session open
TPO
Value area calculation zone
POC
Highlight of Single prints
Session High/Low
The current price (TPO Profile is often used isolated without any candlesticks on it)
Parameters
Session beginning configuration (not coded with a session input yet)
Number of candles to use for calculation (default 13 for a single session)
Extend yesterday's levels (VAH/VAL/POC)
Show/Hide Market profile calculation area (background color)
Bars number (number of rows that will be used to draw the profile)
Show/Hide TPO's
TPO Colors customization (For in/out of VA, VAL/VAH/POC/High/Low levels and single prints)
Show/Hide High/Low levels
Show/Hide VAL/VAH/POC Levels as lines
Enable/Disable Single prints highlighting
Value area size (as percent)
Show/Hide current price (corresponding to a line scaled on the "close" price)
Additional Notes
Each session is drawn when the day is over
To use as much space as possible, TPO's are not directly drawn on the area of their calculation (which can be confusing if you use candlesticks directly over it)
This script will probably be updated in the future (especially concerning its implementation which is a bit spaghetti coded for now) .
If you have interesting suggestions about new features that are usual within market profile tools and missing from this script , don't hesitate to suggest it.

Sessions Lines & BackgroundDisplay Asia, London & New York sessions as background colors or lines (for a cleaner chart).

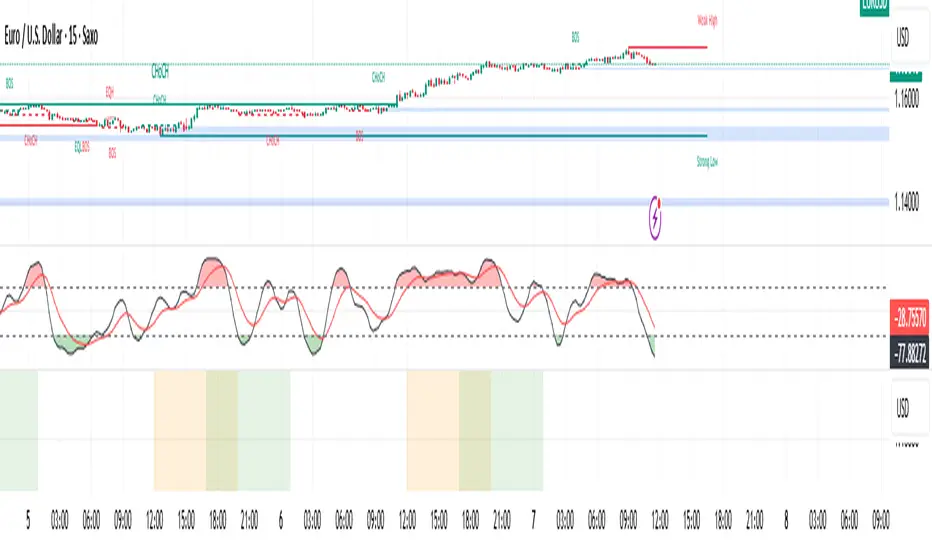
Session Levels (3of3)This system is designed to strip away market noise and highlight the areas where institutional capital is actually active.
Most retail traders fail because they treat every price movement with equal importance. They often enter trades in the "middle of nowhere" or get trapped by "fakeouts" at standard support/resistance levels.
This tool solves:
Context Blindness: It defines the "playing field" by marking institutional session boundaries (Asia, London, NY), so you know exactly where liquidity resides.
Computation Lag: Standard Volume Profiles often slow down a chart. Our Optimized VPC provides the "Magnet" price without the lag.
Indecision: By requiring a Market Structure Shift (MSS) alongside a Fair Value Gap (FVG), it removes the guesswork of "Is this a reversal or a continuation?"
Why It Is Unique:
Unlike standard indicators that look at a single data point (like just price or just volume), this is a Holistic System.
Auto-Mitigation: Most FVG indicators clutter your screen with old boxes. This tool automatically deletes zones once price "fills" them, keeping your focus on live opportunities.
Institutional "Sweep" Logic: It specifically tracks if price has "stolen" the liquidity from a previous session before issuing a signal.
The "Vegas" Filter: It uses the 144 EMA (Vegas Floor) as a high-probability institutional trend filter, ensuring you aren't fighting the primary trend.
When testing this, track one specific stat: "Did price hit the VPC after the MSS?" You will likely find that even when the trade doesn't reach the far PRZ targets, it reaches the VPC Magnet over 70% of the time. Focusing on that "snap-back" to the orange line is the secret to a high win rate with this tool.

Session High and Lowmarks out previous NY session high/low, asian and london session high/low and updates automatically. Perfect indicator for overnight liquidity.
